

Key Insights
The AI in Pharma industry is poised for remarkable expansion, projected to reach a market size of 3.05 billion USD by 2025. This growth is fueled by a CAGR of 42.68%, indicating a rapid and sustained upward trajectory. Key drivers propelling this surge include the increasing demand for novel drug development, the need to accelerate drug discovery timelines, and the growing complexity of clinical trials. The integration of AI technologies is fundamentally transforming pharmaceutical research and development, enabling scientists to analyze vast datasets, identify potential drug candidates more efficiently, and predict treatment outcomes with greater accuracy. This technological revolution is not only optimizing existing processes but also unlocking entirely new avenues for therapeutic innovation.
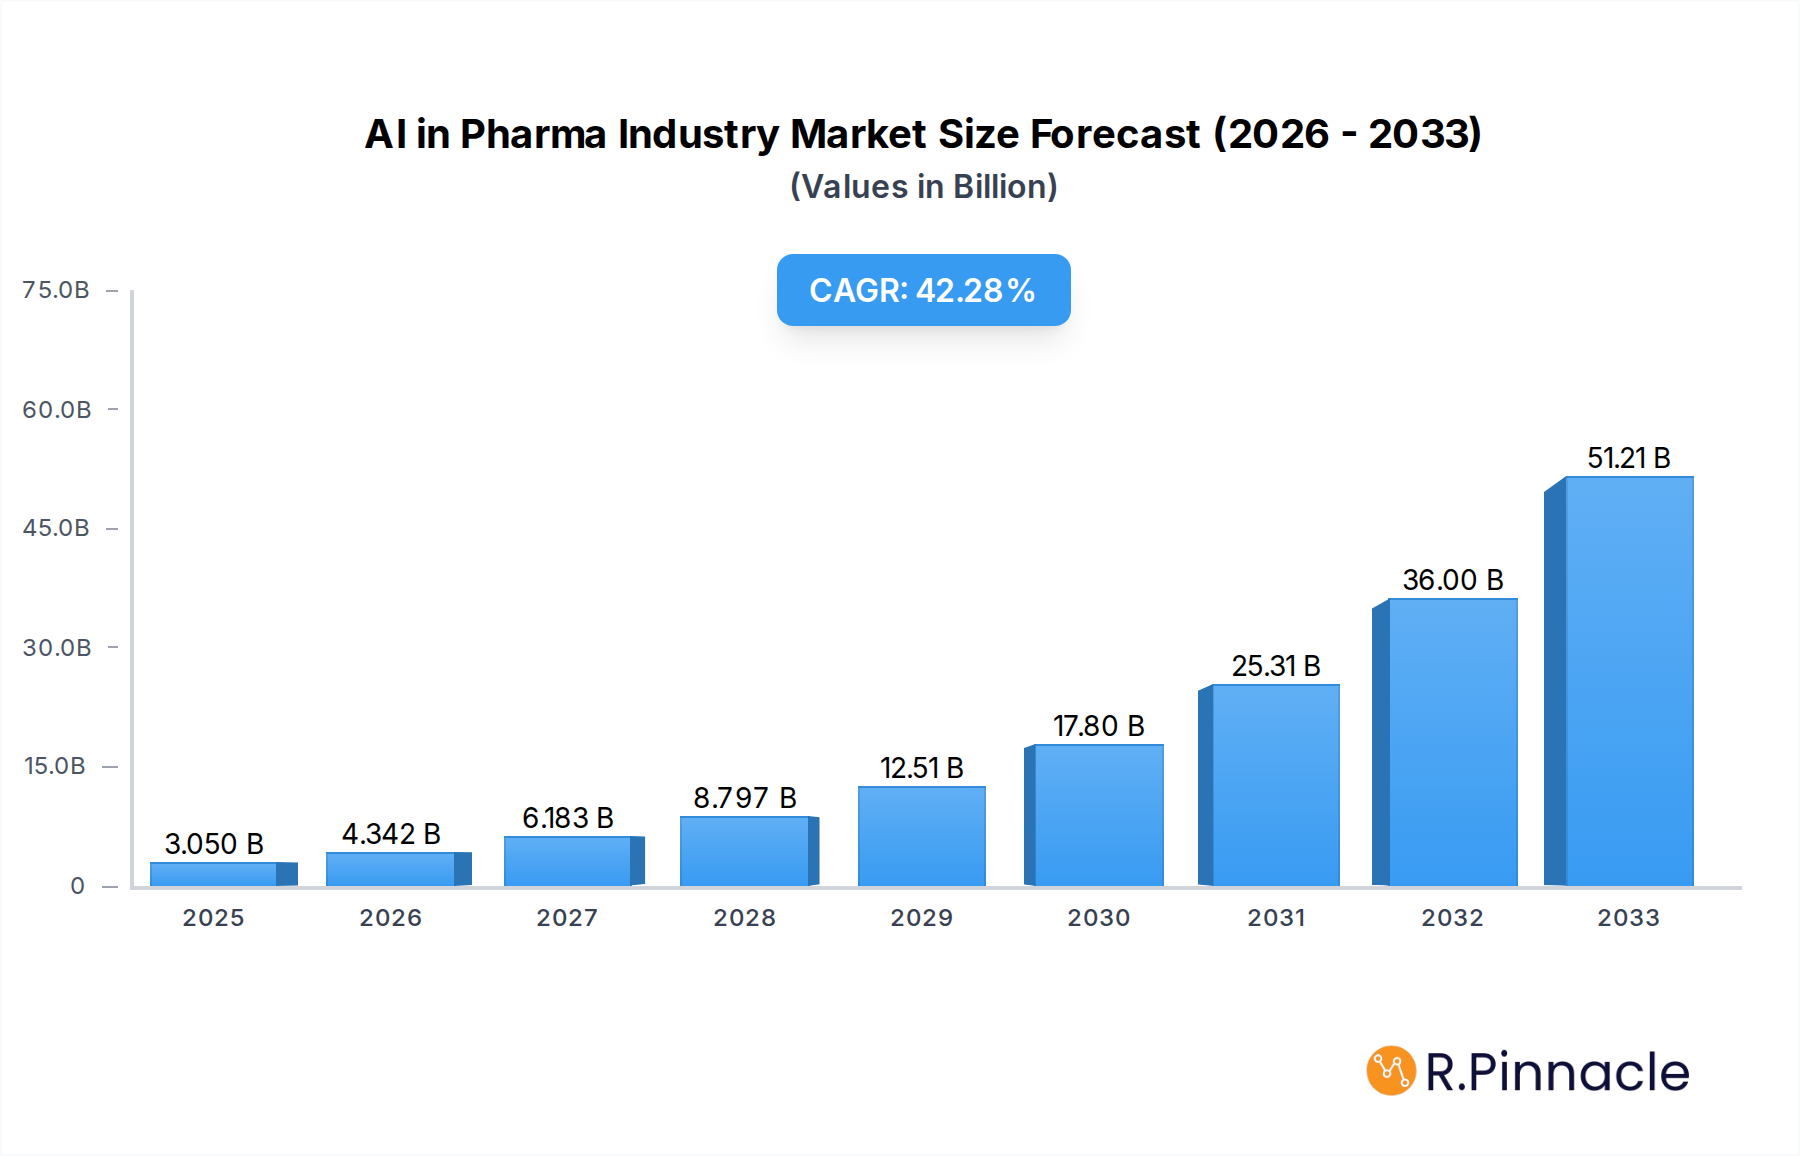
AI in Pharma Industry Market Size (In Billion)
The market is segmented across various crucial areas, with Machine Learning leading the technological adoption, alongside other advanced technologies. In terms of offerings, both Software and Services are experiencing significant demand, reflecting a comprehensive integration of AI solutions within the pharmaceutical ecosystem. Major applications driving this growth include Drug Discovery, where AI is revolutionizing target identification and lead optimization, and Clinical Trial optimization, enhancing patient recruitment and data analysis. Laboratory Automation is another key area benefiting from AI, increasing efficiency and reducing manual labor. The competitive landscape is robust, featuring prominent companies like BenevolentAI, Cloud Pharmaceuticals Inc., Exscientia, Alphabet Inc. (Isomorphic Labs), and Insilico Medicine, all actively contributing to the market's dynamism. Geographically, North America and Europe are leading markets, with significant contributions from Asia Pacific, driven by increasing R&D investments and a growing adoption of cutting-edge technologies.

AI in Pharma Industry Company Market Share
AI in Pharma Industry Market Structure & Innovation Trends
The AI in Pharma industry is characterized by a dynamic market structure driven by intense innovation and strategic collaborations. The market exhibits moderate concentration, with key players like BenevolentAI, Alphabet Inc (Isomorphic Labs), and Exscientia investing heavily in cutting-edge AI technologies for drug discovery and development. Innovation is primarily fueled by advancements in Machine Learning algorithms, sophisticated computational biology, and the increasing availability of vast biological datasets. Regulatory frameworks are evolving to accommodate AI-driven drug development, with a focus on data integrity, validation, and ethical considerations. Product substitutes are limited, as AI offers unique capabilities in accelerating traditional R&D pipelines, leading to significant market share gains for early adopters. Mergers and acquisitions (M&A) are a significant trend, with deal values often in the hundreds of millions of dollars, as larger pharmaceutical companies seek to integrate AI expertise and platforms. For example, investments in AI-powered drug discovery startups often reach figures exceeding $500 Million. The end-user demographic is primarily comprised of pharmaceutical and biotechnology companies, research institutions, and contract research organizations (CROs) seeking to optimize their drug development processes.
AI in Pharma Industry Market Dynamics & Trends
The AI in Pharma industry is experiencing exponential growth, driven by a confluence of technological advancements, pressing healthcare needs, and a paradigm shift in drug discovery methodologies. The Compound Annual Growth Rate (CAGR) for the AI in Pharma market is projected to be in the range of 25-35% over the forecast period of 2025–2033. Market penetration is rapidly increasing, moving from niche applications to becoming an integral part of the entire pharmaceutical value chain.
Key Growth Drivers:
- Accelerated Drug Discovery and Development: AI significantly reduces the time and cost associated with identifying novel drug candidates, optimizing preclinical research, and streamlining clinical trial design and analysis. This is a critical factor in addressing unmet medical needs across various therapeutic areas.
- Enhanced Precision Medicine: AI enables the analysis of complex genomic, proteomic, and patient data to develop highly personalized therapies, leading to improved treatment efficacy and reduced adverse events. The market penetration for AI solutions in precision medicine is rapidly expanding, with an estimated 40% of new drug development programs leveraging AI in this domain by 2030.
- Cost Optimization: By improving efficiency and reducing failure rates in R&D, AI-powered solutions offer substantial cost savings for pharmaceutical companies. The estimated cost reduction per drug brought to market using AI is in the range of $100 Million to $500 Million.
- Big Data Analytics: The pharmaceutical industry generates vast amounts of data from clinical trials, real-world evidence, and scientific literature. AI is essential for extracting meaningful insights from this data, uncovering new therapeutic targets, and predicting drug efficacy and safety. The volume of pharmaceutical data is projected to grow by over 30% annually, making AI indispensable for its analysis.
- Advancements in Machine Learning and Deep Learning: Continuous improvements in AI algorithms, particularly in areas like natural language processing (NLP) for literature review and generative models for molecule design, are expanding the application scope of AI in pharmaceuticals.
- Growing Investment and Funding: Venture capital funding and strategic investments in AI-focused pharmaceutical companies have surged, indicating strong market confidence and a robust pipeline of innovative solutions. Total investment in AI for pharma is expected to reach over $10 Billion by 2027.
Technological Disruptions:
The integration of AI, particularly Machine Learning (ML), is fundamentally disrupting traditional R&D workflows. ML algorithms are revolutionizing target identification, compound screening, and drug repurposing. Deep learning models are excelling in predicting molecular properties and designing novel chemical structures. Beyond ML, other technologies like quantum computing are beginning to show promise in accelerating complex simulations relevant to drug discovery.
Consumer Preferences (Implicit):
While not direct consumers of AI, patient and healthcare provider preferences for faster access to effective and personalized treatments are indirectly driving the adoption of AI in pharma. The demand for novel therapies for chronic and rare diseases also fuels the need for AI's accelerated R&D capabilities.
Competitive Dynamics:
The competitive landscape is evolving with the emergence of specialized AI-first drug discovery companies competing alongside established pharmaceutical giants. Strategic partnerships and collaborations between AI technology providers and pharmaceutical firms are common, creating a dynamic ecosystem. Key competitive strategies involve acquiring AI expertise, investing in proprietary AI platforms, and leveraging AI for data-driven decision-making throughout the drug lifecycle. The market is characterized by a significant number of startups with valuations often exceeding $100 Million, attracting substantial investment.
Dominant Regions & Segments in AI in Pharma Industry
The AI in Pharma industry exhibits strong regional and segmental dominance, driven by robust R&D infrastructure, favorable regulatory environments, and significant investment. North America, particularly the United States, is the leading region, accounting for an estimated 45-50% of the global AI in Pharma market share. This dominance is fueled by a concentration of leading pharmaceutical companies, a thriving venture capital ecosystem, and extensive academic research institutions fostering innovation. Key countries like the UK and Germany also show substantial contributions in Europe.
Dominant Segments:
Technology: Machine Learning
- Key Drivers: The pervasive application of Machine Learning algorithms across the entire drug development lifecycle is a primary driver of its dominance. This includes predictive modeling for target identification, virtual screening of drug compounds, optimizing clinical trial patient selection, and analyzing real-world evidence. The predictive accuracy and efficiency gains offered by ML solutions are unparalleled, leading to their widespread adoption. The market share for Machine Learning in AI for Pharma is projected to exceed 70% of the total AI technology spend.
- Dominance Analysis: ML's ability to process and learn from massive biological datasets, coupled with advancements in deep learning, makes it the foundational technology for most AI applications in pharmaceuticals. Companies are investing heavily in ML expertise and infrastructure to gain a competitive edge in drug discovery and development.
Type: Software
- Key Drivers: The demand for sophisticated AI-powered software platforms that automate and accelerate drug discovery, clinical trial management, and laboratory processes is a significant factor in the dominance of the software segment. These platforms offer scalable and customizable solutions for complex R&D challenges. The market for AI software in pharma is anticipated to grow at a CAGR of approximately 30%.
- Dominance Analysis: Integrated AI software suites provide end-to-end solutions, from initial hypothesis generation to post-market surveillance. Companies are increasingly opting for comprehensive software packages that streamline workflows, enhance collaboration, and improve data management. The value of AI software solutions deployed in pharma is estimated to reach $15 Billion by 2028.
Application: Drug Discovery
- Key Drivers: The application of AI in drug discovery is the most significant driver of market growth. AI's ability to rapidly identify novel drug targets, design potential drug molecules with desired properties, and predict compound efficacy and toxicity is revolutionizing the R&D pipeline. The market for AI in drug discovery is projected to be valued at over $10 Billion by 2026.
- Dominance Analysis: Pharmaceutical companies are heavily investing in AI to reduce the exorbitant costs and lengthy timelines associated with traditional drug discovery. AI-driven approaches are proving to be more efficient and successful in identifying promising drug candidates, leading to a substantial shift in R&D strategies.
Other Dominant Factors:
- Economic Policies: Government initiatives supporting innovation in life sciences and healthcare, coupled with tax incentives for R&D, further bolster the growth of AI in Pharma, particularly in regions like North America and Europe.
- Infrastructure: The availability of advanced computing infrastructure, including high-performance computing (HPC) and cloud platforms, is crucial for supporting the computationally intensive AI algorithms used in pharmaceutical research.
- Talent Pool: A skilled workforce of data scientists, AI engineers, and bioinformaticians is essential for the development and implementation of AI solutions, making regions with strong educational institutions and research capabilities more dominant.
AI in Pharma Industry Product Innovations
Product innovations in the AI in Pharma industry are focused on enhancing speed, accuracy, and predictive capabilities across the drug lifecycle. Companies are developing AI platforms for novel target identification, accelerating the design of new molecular entities with improved efficacy and reduced toxicity. Furthermore, AI is being integrated into laboratory automation to streamline experimental processes and improve data reproducibility. Competitive advantages are derived from proprietary algorithms, extensive datasets, and demonstrable success in predicting drug outcomes, leading to faster preclinical development and improved clinical trial success rates. The market is witnessing a surge in AI-driven solutions that offer predictive insights for personalized medicine and a deeper understanding of complex disease mechanisms.
Report Scope & Segmentation Analysis
This report comprehensively analyzes the AI in Pharma industry, covering key technological, type, and application segments. The study period spans from 2019–2033, with a base year of 2025.
Technology: Machine Learning Machine Learning is a foundational technology, comprising over 70% of AI applications in pharma. Its growth is driven by its widespread use in predictive analytics, target identification, and clinical trial optimization. Projected market size for ML solutions in pharma by 2028 is $15 Billion.
Technology: Other Technologies This segment includes advancements in natural language processing (NLP), computer vision, and other AI subfields. These technologies are crucial for text analysis of scientific literature, image analysis in diagnostics, and data integration. Growth projections indicate a significant expansion, reaching $5 Billion by 2028.
Type: Software AI software platforms are essential for automating and accelerating R&D workflows. This segment accounts for a substantial market share, with growth driven by integrated solutions for drug discovery and clinical trial management. Projected market size by 2028 is $12 Billion.
Type: Services AI-enabled consulting and outsourcing services are critical for companies lacking in-house AI expertise. These services offer strategic guidance, implementation support, and custom AI solution development. Growth is strong, with an estimated market value of $8 Billion by 2028.
Application: Drug Discovery This is the largest application segment, driven by AI's ability to identify novel targets, design molecules, and predict efficacy. Projected market value by 2026 is over $10 Billion.
Application: Clinical Trial AI's role in optimizing patient recruitment, trial design, and data analysis in clinical trials is rapidly growing. Expected market growth is robust, reaching $6 Billion by 2028.
Application: Laboratory Automation AI enhances laboratory workflows through robotics and intelligent data analysis, improving efficiency and reproducibility. Projected market size by 2028 is $4 Billion.
Application: Other Applications This includes AI uses in pharmacovigilance, regulatory affairs, and manufacturing optimization. This segment shows emerging growth potential, with projections reaching $3 Billion by 2028.
Key Drivers of AI in Pharma Industry Growth
The AI in Pharma industry's growth is propelled by several interconnected factors. Technologically, rapid advancements in Machine Learning and Deep Learning algorithms are enabling more sophisticated data analysis and predictive modeling. Economically, the increasing pressure to reduce R&D costs and accelerate drug development timelines, coupled with substantial venture capital investments exceeding $1 Billion annually, is a major catalyst. Regulatory bodies are also becoming more receptive to AI-driven drug submissions, fostering innovation. The growing availability of vast, high-quality biological and clinical datasets, often measured in petabytes, provides the fuel for these AI models. Furthermore, the unmet medical needs across numerous disease areas create a strong demand for faster and more effective therapeutic solutions, which AI is uniquely positioned to deliver.
Challenges in the AI in Pharma Industry Sector
Despite its immense potential, the AI in Pharma sector faces several significant challenges. Regulatory hurdles remain a concern, as frameworks for validating AI-generated data and ensuring the safety and efficacy of AI-discovered drugs are still evolving, potentially adding 1-2 years to approval timelines in some cases. The integration of AI into existing legacy IT systems within established pharmaceutical companies can be complex and costly, with implementation costs often exceeding $50 Million for large enterprises. Data quality and accessibility are also critical issues, as biased or incomplete datasets can lead to flawed AI models and potentially dangerous outcomes, impacting market penetration. Furthermore, the need for highly skilled AI talent, including data scientists and bioinformaticians, creates a competitive talent landscape. Ethical considerations surrounding data privacy and AI decision-making also require careful navigation.
Emerging Opportunities in AI in Pharma Industry
Emerging opportunities in the AI in Pharma industry are vast and expanding. The development of AI-powered platforms for personalized medicine, tailored to individual patient genomics and disease profiles, offers significant growth potential, projected to capture over $20 Billion in market value by 2030. The application of AI in rare disease drug discovery, where patient populations are small and data is scarce, presents a unique opportunity to accelerate the identification of therapeutic candidates. Another burgeoning area is the use of AI in digital twins for drug development, creating virtual replicas of biological systems to simulate drug responses and optimize clinical trials, potentially reducing trial costs by 30-40%. Furthermore, the integration of AI with emerging technologies like quantum computing for complex molecular simulations promises to unlock unprecedented capabilities.
Leading Players in the AI in Pharma Industry Market
- BenevolentAI
- Cloud Pharmaceuticals Inc
- Exscientia
- Alphabet Inc (Isomorphic Labs)
- Insilico Medicine
- Atomwise Inc
- Deargen Inc
- XtalPi Inc
- Cyclica Inc
- Euretos
- Deep Genomics
- InveniAI LLC
Key Developments in AI in Pharma Industry Industry
- December 2022: Cyclica Inc and SK Chemicals Co., Ltd. entered an artificial intelligence (AI)-driven drug discovery and development partnership to develop therapies across a range of disease areas. Under the collaboration with SK Chemicals, Cyclica will deploy its robust, proprietary drug discovery platforms to identify novel drug candidates for challenging biological targets across therapeutic areas of mutual interest to Cyclica and SK Chemicals. This partnership aims to accelerate the identification of novel drug candidates, potentially reducing discovery timelines by 18-24 months.
- October 2022: Deerfield Management and BioSymetrics entered a five-year joint venture to accelerate the advancement of new therapeutics, with an initial focus on cardiovascular and neurological diseases. The collaboration will identify new drug discovery programs that combine BioSymetrics' AI-powered target discovery and validation platform with Deerfield's drug discovery and commercial modeling capabilities. This strategic alliance is expected to bring new therapeutic programs to the clinic within 3-5 years.
Future Outlook for AI in Pharma Industry Market
The future outlook for the AI in Pharma industry is exceptionally promising, with continued exponential growth anticipated. The market is poised to transform drug discovery and development, making it faster, more efficient, and more personalized. Key growth accelerators include the increasing integration of AI across all stages of the pharmaceutical value chain, from early-stage research to post-market surveillance, with an estimated market size reaching over $100 Billion by 2030. Advancements in generative AI for de novo drug design and the expanded use of AI in clinical trial optimization will further drive market expansion. Strategic collaborations between AI tech companies and pharmaceutical giants will continue to foster innovation and accelerate the translation of AI-driven discoveries into life-saving therapies, significantly impacting global healthcare outcomes.
AI in Pharma Industry Segmentation
-
1. Technology
- 1.1. Machine Learning
- 1.2. Other Technologies
-
2. Type
- 2.1. Software
- 2.2. Services
-
3. Application
- 3.1. Drug Discovery
- 3.2. Clinical Trial
- 3.3. Laboratory Automation
- 3.4. Other Applications
AI in Pharma Industry Segmentation By Geography
-
1. North America
- 1.1. United States
- 1.2. Canada
- 1.3. Mexico
-
2. Europe
- 2.1. Germany
- 2.2. United Kingdom
- 2.3. France
- 2.4. Italy
- 2.5. Spain
- 2.6. Rest of Europe
-
3. Asia Pacific
- 3.1. China
- 3.2. Japan
- 3.3. India
- 3.4. Australia
- 3.5. South Korea
- 3.6. Rest of Asia Pacific
-
4. Middle East and Africa
- 4.1. GCC
- 4.2. South Africa
- 4.3. Rest of Middle East and Africa
-
5. South America
- 5.1. Brazil
- 5.2. Argentina
- 5.3. Rest of South America

AI in Pharma Industry Regional Market Share
Geographic Coverage of AI in Pharma Industry
AI in Pharma Industry REPORT HIGHLIGHTS
| Aspects | Details |
|---|---|
| Study Period | 2020-2034 |
| Base Year | 2025 |
| Estimated Year | 2026 |
| Forecast Period | 2026-2034 |
| Historical Period | 2020-2025 |
| Growth Rate | CAGR of 42.68% from 2020-2034 |
| Segmentation |
|
Table of Contents
- 1. Introduction
- 1.1. Research Scope
- 1.2. Market Segmentation
- 1.3. Research Objective
- 1.4. Definitions and Assumptions
- 2. Executive Summary
- 2.1. Market Snapshot
- 3. Market Dynamics
- 3.1. Market Drivers
- 3.2. Market Restrains
- 3.3. Market Trends
- 3.4. Market Opportunities
- 4. Market Factor Analysis
- 4.1. Porters Five Forces
- 4.1.1. Bargaining Power of Suppliers
- 4.1.2. Bargaining Power of Buyers
- 4.1.3. Threat of New Entrants
- 4.1.4. Threat of Substitutes
- 4.1.5. Competitive Rivalry
- 4.2. PESTEL analysis
- 4.3. BCG Analysis
- 4.3.1. Stars (High Growth, High Market Share)
- 4.3.2. Cash Cows (Low Growth, High Market Share)
- 4.3.3. Question Mark (High Growth, Low Market Share)
- 4.3.4. Dogs (Low Growth, Low Market Share)
- 4.4. Ansoff Matrix Analysis
- 4.5. Supply Chain Analysis
- 4.6. Regulatory Landscape
- 4.7. Current Market Potential and Opportunity Assessment (TAM–SAM–SOM Framework)
- 4.8. PRI Analyst Note
- 4.1. Porters Five Forces
- 5. Market Analysis, Insights and Forecast 2021-2033
- 5.1. Market Analysis, Insights and Forecast - by Technology
- 5.1.1. Machine Learning
- 5.1.2. Other Technologies
- 5.2. Market Analysis, Insights and Forecast - by Type
- 5.2.1. Software
- 5.2.2. Services
- 5.3. Market Analysis, Insights and Forecast - by Application
- 5.3.1. Drug Discovery
- 5.3.2. Clinical Trial
- 5.3.3. Laboratory Automation
- 5.3.4. Other Applications
- 5.4. Market Analysis, Insights and Forecast - by Region
- 5.4.1. North America
- 5.4.2. Europe
- 5.4.3. Asia Pacific
- 5.4.4. Middle East and Africa
- 5.4.5. South America
- 5.1. Market Analysis, Insights and Forecast - by Technology
- 6. Global AI in Pharma Industry Analysis, Insights and Forecast, 2021-2033
- 6.1. Market Analysis, Insights and Forecast - by Technology
- 6.1.1. Machine Learning
- 6.1.2. Other Technologies
- 6.2. Market Analysis, Insights and Forecast - by Type
- 6.2.1. Software
- 6.2.2. Services
- 6.3. Market Analysis, Insights and Forecast - by Application
- 6.3.1. Drug Discovery
- 6.3.2. Clinical Trial
- 6.3.3. Laboratory Automation
- 6.3.4. Other Applications
- 6.1. Market Analysis, Insights and Forecast - by Technology
- 7. North America AI in Pharma Industry Analysis, Insights and Forecast, 2020-2032
- 7.1. Market Analysis, Insights and Forecast - by Technology
- 7.1.1. Machine Learning
- 7.1.2. Other Technologies
- 7.2. Market Analysis, Insights and Forecast - by Type
- 7.2.1. Software
- 7.2.2. Services
- 7.3. Market Analysis, Insights and Forecast - by Application
- 7.3.1. Drug Discovery
- 7.3.2. Clinical Trial
- 7.3.3. Laboratory Automation
- 7.3.4. Other Applications
- 7.1. Market Analysis, Insights and Forecast - by Technology
- 8. Europe AI in Pharma Industry Analysis, Insights and Forecast, 2020-2032
- 8.1. Market Analysis, Insights and Forecast - by Technology
- 8.1.1. Machine Learning
- 8.1.2. Other Technologies
- 8.2. Market Analysis, Insights and Forecast - by Type
- 8.2.1. Software
- 8.2.2. Services
- 8.3. Market Analysis, Insights and Forecast - by Application
- 8.3.1. Drug Discovery
- 8.3.2. Clinical Trial
- 8.3.3. Laboratory Automation
- 8.3.4. Other Applications
- 8.1. Market Analysis, Insights and Forecast - by Technology
- 9. Asia Pacific AI in Pharma Industry Analysis, Insights and Forecast, 2020-2032
- 9.1. Market Analysis, Insights and Forecast - by Technology
- 9.1.1. Machine Learning
- 9.1.2. Other Technologies
- 9.2. Market Analysis, Insights and Forecast - by Type
- 9.2.1. Software
- 9.2.2. Services
- 9.3. Market Analysis, Insights and Forecast - by Application
- 9.3.1. Drug Discovery
- 9.3.2. Clinical Trial
- 9.3.3. Laboratory Automation
- 9.3.4. Other Applications
- 9.1. Market Analysis, Insights and Forecast - by Technology
- 10. Middle East and Africa AI in Pharma Industry Analysis, Insights and Forecast, 2020-2032
- 10.1. Market Analysis, Insights and Forecast - by Technology
- 10.1.1. Machine Learning
- 10.1.2. Other Technologies
- 10.2. Market Analysis, Insights and Forecast - by Type
- 10.2.1. Software
- 10.2.2. Services
- 10.3. Market Analysis, Insights and Forecast - by Application
- 10.3.1. Drug Discovery
- 10.3.2. Clinical Trial
- 10.3.3. Laboratory Automation
- 10.3.4. Other Applications
- 10.1. Market Analysis, Insights and Forecast - by Technology
- 11. South America AI in Pharma Industry Analysis, Insights and Forecast, 2020-2032
- 11.1. Market Analysis, Insights and Forecast - by Technology
- 11.1.1. Machine Learning
- 11.1.2. Other Technologies
- 11.2. Market Analysis, Insights and Forecast - by Type
- 11.2.1. Software
- 11.2.2. Services
- 11.3. Market Analysis, Insights and Forecast - by Application
- 11.3.1. Drug Discovery
- 11.3.2. Clinical Trial
- 11.3.3. Laboratory Automation
- 11.3.4. Other Applications
- 11.1. Market Analysis, Insights and Forecast - by Technology
- 12. Competitive Analysis
- 12.1. Company Profiles
- 12.1.1 BenevolentAI
- 12.1.1.1. Company Overview
- 12.1.1.2. Products
- 12.1.1.3. Company Financials
- 12.1.1.4. SWOT Analysis
- 12.1.2 Cloud Pharmaceuticals Inc
- 12.1.2.1. Company Overview
- 12.1.2.2. Products
- 12.1.2.3. Company Financials
- 12.1.2.4. SWOT Analysis
- 12.1.3 Exscientia
- 12.1.3.1. Company Overview
- 12.1.3.2. Products
- 12.1.3.3. Company Financials
- 12.1.3.4. SWOT Analysis
- 12.1.4 Alphabet Inc (Isomorphic Labs)
- 12.1.4.1. Company Overview
- 12.1.4.2. Products
- 12.1.4.3. Company Financials
- 12.1.4.4. SWOT Analysis
- 12.1.5 Insilico Medicine
- 12.1.5.1. Company Overview
- 12.1.5.2. Products
- 12.1.5.3. Company Financials
- 12.1.5.4. SWOT Analysis
- 12.1.6 Atomwise Inc
- 12.1.6.1. Company Overview
- 12.1.6.2. Products
- 12.1.6.3. Company Financials
- 12.1.6.4. SWOT Analysis
- 12.1.7 Deargen Inc
- 12.1.7.1. Company Overview
- 12.1.7.2. Products
- 12.1.7.3. Company Financials
- 12.1.7.4. SWOT Analysis
- 12.1.8 XtalPi Inc
- 12.1.8.1. Company Overview
- 12.1.8.2. Products
- 12.1.8.3. Company Financials
- 12.1.8.4. SWOT Analysis
- 12.1.9 Cyclica Inc
- 12.1.9.1. Company Overview
- 12.1.9.2. Products
- 12.1.9.3. Company Financials
- 12.1.9.4. SWOT Analysis
- 12.1.10 Euretos
- 12.1.10.1. Company Overview
- 12.1.10.2. Products
- 12.1.10.3. Company Financials
- 12.1.10.4. SWOT Analysis
- 12.1.11 Deep Genomics
- 12.1.11.1. Company Overview
- 12.1.11.2. Products
- 12.1.11.3. Company Financials
- 12.1.11.4. SWOT Analysis
- 12.1.12 InveniAI LLC
- 12.1.12.1. Company Overview
- 12.1.12.2. Products
- 12.1.12.3. Company Financials
- 12.1.12.4. SWOT Analysis
- 12.1.1 BenevolentAI
- 12.2. Market Entropy
- 12.2.1 Company's Key Areas Served
- 12.2.2 Recent Developments
- 12.3. Company Market Share Analysis 2025
- 12.3.1 Top 5 Companies Market Share Analysis
- 12.3.2 Top 3 Companies Market Share Analysis
- 12.4. List of Potential Customers
- 13. Research Methodology
List of Figures
- Figure 1: Global AI in Pharma Industry Revenue Breakdown (Million, %) by Region 2025 & 2033
- Figure 2: Global AI in Pharma Industry Volume Breakdown (K Unit, %) by Region 2025 & 2033
- Figure 3: North America AI in Pharma Industry Revenue (Million), by Technology 2025 & 2033
- Figure 4: North America AI in Pharma Industry Volume (K Unit), by Technology 2025 & 2033
- Figure 5: North America AI in Pharma Industry Revenue Share (%), by Technology 2025 & 2033
- Figure 6: North America AI in Pharma Industry Volume Share (%), by Technology 2025 & 2033
- Figure 7: North America AI in Pharma Industry Revenue (Million), by Type 2025 & 2033
- Figure 8: North America AI in Pharma Industry Volume (K Unit), by Type 2025 & 2033
- Figure 9: North America AI in Pharma Industry Revenue Share (%), by Type 2025 & 2033
- Figure 10: North America AI in Pharma Industry Volume Share (%), by Type 2025 & 2033
- Figure 11: North America AI in Pharma Industry Revenue (Million), by Application 2025 & 2033
- Figure 12: North America AI in Pharma Industry Volume (K Unit), by Application 2025 & 2033
- Figure 13: North America AI in Pharma Industry Revenue Share (%), by Application 2025 & 2033
- Figure 14: North America AI in Pharma Industry Volume Share (%), by Application 2025 & 2033
- Figure 15: North America AI in Pharma Industry Revenue (Million), by Country 2025 & 2033
- Figure 16: North America AI in Pharma Industry Volume (K Unit), by Country 2025 & 2033
- Figure 17: North America AI in Pharma Industry Revenue Share (%), by Country 2025 & 2033
- Figure 18: North America AI in Pharma Industry Volume Share (%), by Country 2025 & 2033
- Figure 19: Europe AI in Pharma Industry Revenue (Million), by Technology 2025 & 2033
- Figure 20: Europe AI in Pharma Industry Volume (K Unit), by Technology 2025 & 2033
- Figure 21: Europe AI in Pharma Industry Revenue Share (%), by Technology 2025 & 2033
- Figure 22: Europe AI in Pharma Industry Volume Share (%), by Technology 2025 & 2033
- Figure 23: Europe AI in Pharma Industry Revenue (Million), by Type 2025 & 2033
- Figure 24: Europe AI in Pharma Industry Volume (K Unit), by Type 2025 & 2033
- Figure 25: Europe AI in Pharma Industry Revenue Share (%), by Type 2025 & 2033
- Figure 26: Europe AI in Pharma Industry Volume Share (%), by Type 2025 & 2033
- Figure 27: Europe AI in Pharma Industry Revenue (Million), by Application 2025 & 2033
- Figure 28: Europe AI in Pharma Industry Volume (K Unit), by Application 2025 & 2033
- Figure 29: Europe AI in Pharma Industry Revenue Share (%), by Application 2025 & 2033
- Figure 30: Europe AI in Pharma Industry Volume Share (%), by Application 2025 & 2033
- Figure 31: Europe AI in Pharma Industry Revenue (Million), by Country 2025 & 2033
- Figure 32: Europe AI in Pharma Industry Volume (K Unit), by Country 2025 & 2033
- Figure 33: Europe AI in Pharma Industry Revenue Share (%), by Country 2025 & 2033
- Figure 34: Europe AI in Pharma Industry Volume Share (%), by Country 2025 & 2033
- Figure 35: Asia Pacific AI in Pharma Industry Revenue (Million), by Technology 2025 & 2033
- Figure 36: Asia Pacific AI in Pharma Industry Volume (K Unit), by Technology 2025 & 2033
- Figure 37: Asia Pacific AI in Pharma Industry Revenue Share (%), by Technology 2025 & 2033
- Figure 38: Asia Pacific AI in Pharma Industry Volume Share (%), by Technology 2025 & 2033
- Figure 39: Asia Pacific AI in Pharma Industry Revenue (Million), by Type 2025 & 2033
- Figure 40: Asia Pacific AI in Pharma Industry Volume (K Unit), by Type 2025 & 2033
- Figure 41: Asia Pacific AI in Pharma Industry Revenue Share (%), by Type 2025 & 2033
- Figure 42: Asia Pacific AI in Pharma Industry Volume Share (%), by Type 2025 & 2033
- Figure 43: Asia Pacific AI in Pharma Industry Revenue (Million), by Application 2025 & 2033
- Figure 44: Asia Pacific AI in Pharma Industry Volume (K Unit), by Application 2025 & 2033
- Figure 45: Asia Pacific AI in Pharma Industry Revenue Share (%), by Application 2025 & 2033
- Figure 46: Asia Pacific AI in Pharma Industry Volume Share (%), by Application 2025 & 2033
- Figure 47: Asia Pacific AI in Pharma Industry Revenue (Million), by Country 2025 & 2033
- Figure 48: Asia Pacific AI in Pharma Industry Volume (K Unit), by Country 2025 & 2033
- Figure 49: Asia Pacific AI in Pharma Industry Revenue Share (%), by Country 2025 & 2033
- Figure 50: Asia Pacific AI in Pharma Industry Volume Share (%), by Country 2025 & 2033
- Figure 51: Middle East and Africa AI in Pharma Industry Revenue (Million), by Technology 2025 & 2033
- Figure 52: Middle East and Africa AI in Pharma Industry Volume (K Unit), by Technology 2025 & 2033
- Figure 53: Middle East and Africa AI in Pharma Industry Revenue Share (%), by Technology 2025 & 2033
- Figure 54: Middle East and Africa AI in Pharma Industry Volume Share (%), by Technology 2025 & 2033
- Figure 55: Middle East and Africa AI in Pharma Industry Revenue (Million), by Type 2025 & 2033
- Figure 56: Middle East and Africa AI in Pharma Industry Volume (K Unit), by Type 2025 & 2033
- Figure 57: Middle East and Africa AI in Pharma Industry Revenue Share (%), by Type 2025 & 2033
- Figure 58: Middle East and Africa AI in Pharma Industry Volume Share (%), by Type 2025 & 2033
- Figure 59: Middle East and Africa AI in Pharma Industry Revenue (Million), by Application 2025 & 2033
- Figure 60: Middle East and Africa AI in Pharma Industry Volume (K Unit), by Application 2025 & 2033
- Figure 61: Middle East and Africa AI in Pharma Industry Revenue Share (%), by Application 2025 & 2033
- Figure 62: Middle East and Africa AI in Pharma Industry Volume Share (%), by Application 2025 & 2033
- Figure 63: Middle East and Africa AI in Pharma Industry Revenue (Million), by Country 2025 & 2033
- Figure 64: Middle East and Africa AI in Pharma Industry Volume (K Unit), by Country 2025 & 2033
- Figure 65: Middle East and Africa AI in Pharma Industry Revenue Share (%), by Country 2025 & 2033
- Figure 66: Middle East and Africa AI in Pharma Industry Volume Share (%), by Country 2025 & 2033
- Figure 67: South America AI in Pharma Industry Revenue (Million), by Technology 2025 & 2033
- Figure 68: South America AI in Pharma Industry Volume (K Unit), by Technology 2025 & 2033
- Figure 69: South America AI in Pharma Industry Revenue Share (%), by Technology 2025 & 2033
- Figure 70: South America AI in Pharma Industry Volume Share (%), by Technology 2025 & 2033
- Figure 71: South America AI in Pharma Industry Revenue (Million), by Type 2025 & 2033
- Figure 72: South America AI in Pharma Industry Volume (K Unit), by Type 2025 & 2033
- Figure 73: South America AI in Pharma Industry Revenue Share (%), by Type 2025 & 2033
- Figure 74: South America AI in Pharma Industry Volume Share (%), by Type 2025 & 2033
- Figure 75: South America AI in Pharma Industry Revenue (Million), by Application 2025 & 2033
- Figure 76: South America AI in Pharma Industry Volume (K Unit), by Application 2025 & 2033
- Figure 77: South America AI in Pharma Industry Revenue Share (%), by Application 2025 & 2033
- Figure 78: South America AI in Pharma Industry Volume Share (%), by Application 2025 & 2033
- Figure 79: South America AI in Pharma Industry Revenue (Million), by Country 2025 & 2033
- Figure 80: South America AI in Pharma Industry Volume (K Unit), by Country 2025 & 2033
- Figure 81: South America AI in Pharma Industry Revenue Share (%), by Country 2025 & 2033
- Figure 82: South America AI in Pharma Industry Volume Share (%), by Country 2025 & 2033
List of Tables
- Table 1: Global AI in Pharma Industry Revenue Million Forecast, by Technology 2020 & 2033
- Table 2: Global AI in Pharma Industry Volume K Unit Forecast, by Technology 2020 & 2033
- Table 3: Global AI in Pharma Industry Revenue Million Forecast, by Type 2020 & 2033
- Table 4: Global AI in Pharma Industry Volume K Unit Forecast, by Type 2020 & 2033
- Table 5: Global AI in Pharma Industry Revenue Million Forecast, by Application 2020 & 2033
- Table 6: Global AI in Pharma Industry Volume K Unit Forecast, by Application 2020 & 2033
- Table 7: Global AI in Pharma Industry Revenue Million Forecast, by Region 2020 & 2033
- Table 8: Global AI in Pharma Industry Volume K Unit Forecast, by Region 2020 & 2033
- Table 9: Global AI in Pharma Industry Revenue Million Forecast, by Technology 2020 & 2033
- Table 10: Global AI in Pharma Industry Volume K Unit Forecast, by Technology 2020 & 2033
- Table 11: Global AI in Pharma Industry Revenue Million Forecast, by Type 2020 & 2033
- Table 12: Global AI in Pharma Industry Volume K Unit Forecast, by Type 2020 & 2033
- Table 13: Global AI in Pharma Industry Revenue Million Forecast, by Application 2020 & 2033
- Table 14: Global AI in Pharma Industry Volume K Unit Forecast, by Application 2020 & 2033
- Table 15: Global AI in Pharma Industry Revenue Million Forecast, by Country 2020 & 2033
- Table 16: Global AI in Pharma Industry Volume K Unit Forecast, by Country 2020 & 2033
- Table 17: United States AI in Pharma Industry Revenue (Million) Forecast, by Application 2020 & 2033
- Table 18: United States AI in Pharma Industry Volume (K Unit) Forecast, by Application 2020 & 2033
- Table 19: Canada AI in Pharma Industry Revenue (Million) Forecast, by Application 2020 & 2033
- Table 20: Canada AI in Pharma Industry Volume (K Unit) Forecast, by Application 2020 & 2033
- Table 21: Mexico AI in Pharma Industry Revenue (Million) Forecast, by Application 2020 & 2033
- Table 22: Mexico AI in Pharma Industry Volume (K Unit) Forecast, by Application 2020 & 2033
- Table 23: Global AI in Pharma Industry Revenue Million Forecast, by Technology 2020 & 2033
- Table 24: Global AI in Pharma Industry Volume K Unit Forecast, by Technology 2020 & 2033
- Table 25: Global AI in Pharma Industry Revenue Million Forecast, by Type 2020 & 2033
- Table 26: Global AI in Pharma Industry Volume K Unit Forecast, by Type 2020 & 2033
- Table 27: Global AI in Pharma Industry Revenue Million Forecast, by Application 2020 & 2033
- Table 28: Global AI in Pharma Industry Volume K Unit Forecast, by Application 2020 & 2033
- Table 29: Global AI in Pharma Industry Revenue Million Forecast, by Country 2020 & 2033
- Table 30: Global AI in Pharma Industry Volume K Unit Forecast, by Country 2020 & 2033
- Table 31: Germany AI in Pharma Industry Revenue (Million) Forecast, by Application 2020 & 2033
- Table 32: Germany AI in Pharma Industry Volume (K Unit) Forecast, by Application 2020 & 2033
- Table 33: United Kingdom AI in Pharma Industry Revenue (Million) Forecast, by Application 2020 & 2033
- Table 34: United Kingdom AI in Pharma Industry Volume (K Unit) Forecast, by Application 2020 & 2033
- Table 35: France AI in Pharma Industry Revenue (Million) Forecast, by Application 2020 & 2033
- Table 36: France AI in Pharma Industry Volume (K Unit) Forecast, by Application 2020 & 2033
- Table 37: Italy AI in Pharma Industry Revenue (Million) Forecast, by Application 2020 & 2033
- Table 38: Italy AI in Pharma Industry Volume (K Unit) Forecast, by Application 2020 & 2033
- Table 39: Spain AI in Pharma Industry Revenue (Million) Forecast, by Application 2020 & 2033
- Table 40: Spain AI in Pharma Industry Volume (K Unit) Forecast, by Application 2020 & 2033
- Table 41: Rest of Europe AI in Pharma Industry Revenue (Million) Forecast, by Application 2020 & 2033
- Table 42: Rest of Europe AI in Pharma Industry Volume (K Unit) Forecast, by Application 2020 & 2033
- Table 43: Global AI in Pharma Industry Revenue Million Forecast, by Technology 2020 & 2033
- Table 44: Global AI in Pharma Industry Volume K Unit Forecast, by Technology 2020 & 2033
- Table 45: Global AI in Pharma Industry Revenue Million Forecast, by Type 2020 & 2033
- Table 46: Global AI in Pharma Industry Volume K Unit Forecast, by Type 2020 & 2033
- Table 47: Global AI in Pharma Industry Revenue Million Forecast, by Application 2020 & 2033
- Table 48: Global AI in Pharma Industry Volume K Unit Forecast, by Application 2020 & 2033
- Table 49: Global AI in Pharma Industry Revenue Million Forecast, by Country 2020 & 2033
- Table 50: Global AI in Pharma Industry Volume K Unit Forecast, by Country 2020 & 2033
- Table 51: China AI in Pharma Industry Revenue (Million) Forecast, by Application 2020 & 2033
- Table 52: China AI in Pharma Industry Volume (K Unit) Forecast, by Application 2020 & 2033
- Table 53: Japan AI in Pharma Industry Revenue (Million) Forecast, by Application 2020 & 2033
- Table 54: Japan AI in Pharma Industry Volume (K Unit) Forecast, by Application 2020 & 2033
- Table 55: India AI in Pharma Industry Revenue (Million) Forecast, by Application 2020 & 2033
- Table 56: India AI in Pharma Industry Volume (K Unit) Forecast, by Application 2020 & 2033
- Table 57: Australia AI in Pharma Industry Revenue (Million) Forecast, by Application 2020 & 2033
- Table 58: Australia AI in Pharma Industry Volume (K Unit) Forecast, by Application 2020 & 2033
- Table 59: South Korea AI in Pharma Industry Revenue (Million) Forecast, by Application 2020 & 2033
- Table 60: South Korea AI in Pharma Industry Volume (K Unit) Forecast, by Application 2020 & 2033
- Table 61: Rest of Asia Pacific AI in Pharma Industry Revenue (Million) Forecast, by Application 2020 & 2033
- Table 62: Rest of Asia Pacific AI in Pharma Industry Volume (K Unit) Forecast, by Application 2020 & 2033
- Table 63: Global AI in Pharma Industry Revenue Million Forecast, by Technology 2020 & 2033
- Table 64: Global AI in Pharma Industry Volume K Unit Forecast, by Technology 2020 & 2033
- Table 65: Global AI in Pharma Industry Revenue Million Forecast, by Type 2020 & 2033
- Table 66: Global AI in Pharma Industry Volume K Unit Forecast, by Type 2020 & 2033
- Table 67: Global AI in Pharma Industry Revenue Million Forecast, by Application 2020 & 2033
- Table 68: Global AI in Pharma Industry Volume K Unit Forecast, by Application 2020 & 2033
- Table 69: Global AI in Pharma Industry Revenue Million Forecast, by Country 2020 & 2033
- Table 70: Global AI in Pharma Industry Volume K Unit Forecast, by Country 2020 & 2033
- Table 71: GCC AI in Pharma Industry Revenue (Million) Forecast, by Application 2020 & 2033
- Table 72: GCC AI in Pharma Industry Volume (K Unit) Forecast, by Application 2020 & 2033
- Table 73: South Africa AI in Pharma Industry Revenue (Million) Forecast, by Application 2020 & 2033
- Table 74: South Africa AI in Pharma Industry Volume (K Unit) Forecast, by Application 2020 & 2033
- Table 75: Rest of Middle East and Africa AI in Pharma Industry Revenue (Million) Forecast, by Application 2020 & 2033
- Table 76: Rest of Middle East and Africa AI in Pharma Industry Volume (K Unit) Forecast, by Application 2020 & 2033
- Table 77: Global AI in Pharma Industry Revenue Million Forecast, by Technology 2020 & 2033
- Table 78: Global AI in Pharma Industry Volume K Unit Forecast, by Technology 2020 & 2033
- Table 79: Global AI in Pharma Industry Revenue Million Forecast, by Type 2020 & 2033
- Table 80: Global AI in Pharma Industry Volume K Unit Forecast, by Type 2020 & 2033
- Table 81: Global AI in Pharma Industry Revenue Million Forecast, by Application 2020 & 2033
- Table 82: Global AI in Pharma Industry Volume K Unit Forecast, by Application 2020 & 2033
- Table 83: Global AI in Pharma Industry Revenue Million Forecast, by Country 2020 & 2033
- Table 84: Global AI in Pharma Industry Volume K Unit Forecast, by Country 2020 & 2033
- Table 85: Brazil AI in Pharma Industry Revenue (Million) Forecast, by Application 2020 & 2033
- Table 86: Brazil AI in Pharma Industry Volume (K Unit) Forecast, by Application 2020 & 2033
- Table 87: Argentina AI in Pharma Industry Revenue (Million) Forecast, by Application 2020 & 2033
- Table 88: Argentina AI in Pharma Industry Volume (K Unit) Forecast, by Application 2020 & 2033
- Table 89: Rest of South America AI in Pharma Industry Revenue (Million) Forecast, by Application 2020 & 2033
- Table 90: Rest of South America AI in Pharma Industry Volume (K Unit) Forecast, by Application 2020 & 2033
Frequently Asked Questions
1. What is the projected Compound Annual Growth Rate (CAGR) of the AI in Pharma Industry?
The projected CAGR is approximately 42.68%.
2. Which companies are prominent players in the AI in Pharma Industry?
Key companies in the market include BenevolentAI, Cloud Pharmaceuticals Inc, Exscientia, Alphabet Inc (Isomorphic Labs), Insilico Medicine, Atomwise Inc, Deargen Inc, XtalPi Inc, Cyclica Inc, Euretos, Deep Genomics, InveniAI LLC.
3. What are the main segments of the AI in Pharma Industry?
The market segments include Technology, Type, Application.
4. Can you provide details about the market size?
The market size is estimated to be USD 3.05 Million as of 2022.
5. What are some drivers contributing to market growth?
Growing Number of Cross-industry Collaborations and Partnerships; Surge In Adoption of Artificial Intelligence (AI) for Clinical Trials; Increasing Need to Reduce Drug Discovery & Development Costs and Timelines.
6. What are the notable trends driving market growth?
Drug Discovery Segment is Expected to Witness Significant Growth in the Market Over the Forecast Period.
7. Are there any restraints impacting market growth?
Inadequate Availability of Skilled Professionals; Incompatible Healthcare IT Infrastructure.
8. Can you provide examples of recent developments in the market?
December 2022: Cyclica Inc and SK Chemicals Co., Ltd. entered an artificial intelligence (AI)-driven drug discovery and development partnership to develop therapies across a range of disease areas. Under the collaboration with SK Chemicals, Cyclica will deploy its robust, proprietary drug discovery platforms to identify novel drug candidates for challenging biological targets across therapeutic areas of mutual interest to Cyclica and SK Chemicals.
9. What pricing options are available for accessing the report?
Pricing options include single-user, multi-user, and enterprise licenses priced at USD 4750, USD 5250, and USD 8750 respectively.
10. Is the market size provided in terms of value or volume?
The market size is provided in terms of value, measured in Million and volume, measured in K Unit.
11. Are there any specific market keywords associated with the report?
Yes, the market keyword associated with the report is "AI in Pharma Industry," which aids in identifying and referencing the specific market segment covered.
12. How do I determine which pricing option suits my needs best?
The pricing options vary based on user requirements and access needs. Individual users may opt for single-user licenses, while businesses requiring broader access may choose multi-user or enterprise licenses for cost-effective access to the report.
13. Are there any additional resources or data provided in the AI in Pharma Industry report?
While the report offers comprehensive insights, it's advisable to review the specific contents or supplementary materials provided to ascertain if additional resources or data are available.
14. How can I stay updated on further developments or reports in the AI in Pharma Industry?
To stay informed about further developments, trends, and reports in the AI in Pharma Industry, consider subscribing to industry newsletters, following relevant companies and organizations, or regularly checking reputable industry news sources and publications.
Methodology
Step 1 - Identification of Relevant Samples Size from Population Database


Step 2 - Approaches for Defining Global Market Size (Value, Volume* & Price*)

Note*: In applicable scenarios
Step 3 - Data Sources
Primary Research
- Web Analytics
- Survey Reports
- Research Institute
- Latest Research Reports
- Opinion Leaders
Secondary Research
- Annual Reports
- White Paper
- Latest Press Release
- Industry Association
- Paid Database
- Investor Presentations

Step 4 - Data Triangulation
Involves using different sources of information in order to increase the validity of a study
These sources are likely to be stakeholders in a program - participants, other researchers, program staff, other community members, and so on.
Then we put all data in single framework & apply various statistical tools to find out the dynamic on the market.
During the analysis stage, feedback from the stakeholder groups would be compared to determine areas of agreement as well as areas of divergence