

Key Insights
The global air starter market is projected for substantial expansion, propelled by escalating demand for dependable starting solutions across various industries. This market is anticipated to grow at a Compound Annual Growth Rate (CAGR) of 4.75%, reaching an estimated market size of 416.18 million by 2025. Key growth catalysts include the robust expansion of the oil and gas sector, increasing power generation capacities, especially in renewable energy requiring reliable start-up mechanisms, and amplified mining activities. Advancements in technology for more efficient and durable air starters, coupled with stricter emission regulations favoring cleaner energy, further stimulate market growth. The market is segmented by type into vane and turbine air starters, with turbine variants expected to dominate due to their superior power output for larger engines. Major end-user industries comprise oil & gas, power generation, and mining, among others such as construction and marine. While North America and Europe currently lead in market share, the Asia-Pacific region, particularly China and India, presents significant growth prospects due to rapid industrialization and infrastructure development. The competitive landscape features established players and specialized manufacturers, fostering innovation and price competition.
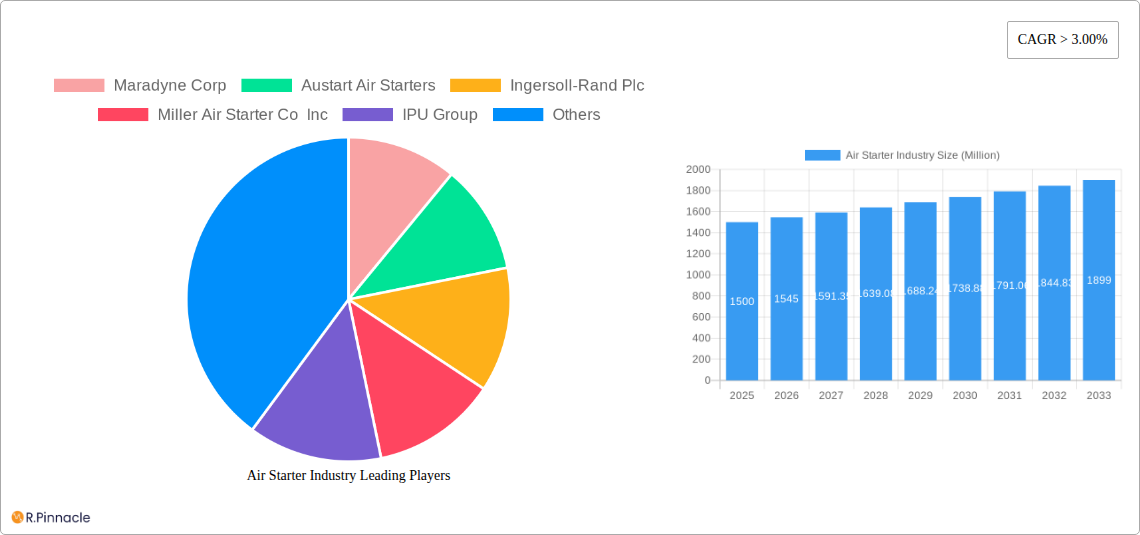
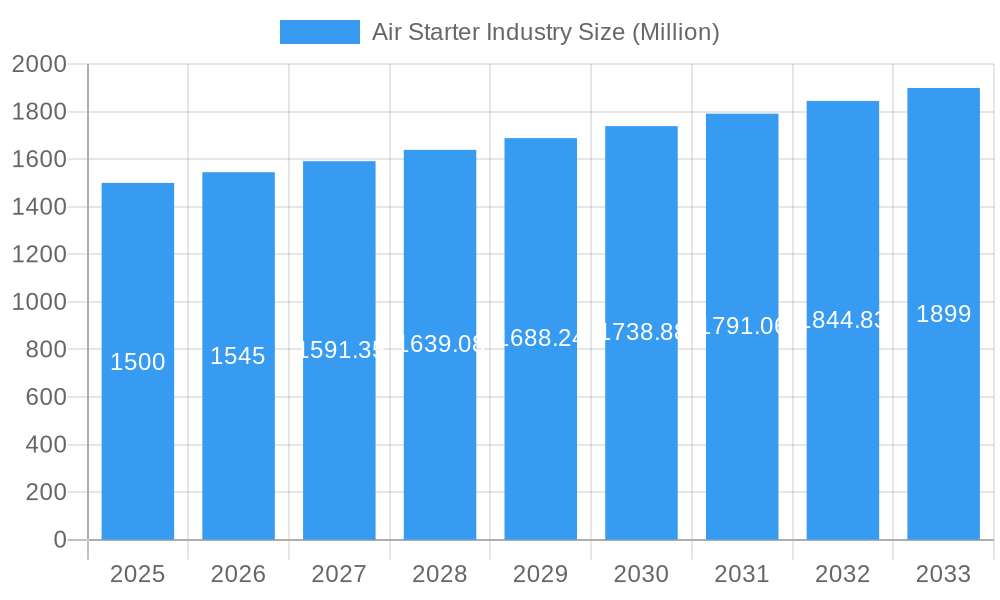
Air Starter Industry Market Size (In Million)
Market limitations include the considerable upfront investment for advanced air starter models and volatility in raw material costs. The cyclical nature of key end-user industries, such as mining and oil & gas, can also influence market dynamics. Nevertheless, the long-term forecast remains optimistic, driven by the persistent need for reliable starting systems in diverse applications. The burgeoning renewable energy sector, including wind and solar power, offers significant opportunities for air starter manufacturers, as efficient start-up mechanisms are critical. Continued research and development focused on enhancing air starter efficiency, durability, and environmental performance are expected to drive further market expansion.
Air Starter Industry Company Market Share
Air Starter Industry Market Report: 2019-2033 Forecast
This comprehensive report provides an in-depth analysis of the global air starter industry, offering invaluable insights for industry professionals, investors, and strategic decision-makers. With a focus on market size, growth drivers, competitive landscape, and future trends, this report covers the period from 2019 to 2033, with a base year of 2025 and an estimated year of 2025. The forecast period extends from 2025 to 2033, while the historical period analyzed encompasses 2019-2024. The report projects a market valued at over $XX Million by 2033.
Air Starter Industry Market Structure & Innovation Trends
This section analyzes the competitive landscape of the air starter industry, including market concentration, innovation drivers, regulatory frameworks, product substitutes, end-user demographics, and mergers and acquisitions (M&A) activities. The market is moderately concentrated, with key players such as Ingersoll-Rand Plc, Maradyne Corp, and Austart Air Starters holding significant market share. However, smaller players like Miller Air Starter Co Inc and IPU Group contribute significantly to the overall market dynamics.
- Market Share: Ingersoll-Rand Plc holds an estimated xx% market share, followed by Maradyne Corp at xx% and Austart Air Starters at xx%. The remaining market share is distributed among numerous smaller players.
- M&A Activity: The industry has witnessed a moderate level of M&A activity in recent years, with deal values totaling approximately $XX Million over the past five years. These activities have primarily focused on expanding product portfolios and geographical reach.
- Innovation Drivers: Stringent emission regulations, the demand for increased efficiency and durability in heavy-duty applications, and the adoption of advanced materials are key innovation drivers.
- Regulatory Frameworks: Compliance with safety and environmental regulations significantly influences product design and manufacturing processes.
Air Starter Industry Market Dynamics & Trends
This section delves into the key factors driving market growth, including technological advancements, evolving consumer preferences, and intense competition. The global air starter market is experiencing a CAGR of xx% during the forecast period (2025-2033). This growth is primarily driven by increasing demand from the oil & gas and power generation sectors. Technological disruptions, such as the adoption of more efficient and environmentally friendly designs, are contributing to market expansion. The market penetration of vane air starters is higher compared to turbine air starters, though the latter segment is expected to witness faster growth due to increasing demand for higher starting torque applications.
Dominant Regions & Segments in Air Starter Industry
This section identifies the leading regions and segments within the air starter industry. The analysis reveals that the [Region Name] region dominates the global market, driven by factors such as robust industrial activity, favorable economic policies, and significant investments in infrastructure development.
- Leading Region: [Region Name]
- Dominant Segment (Type): Vane Air Starters currently hold the largest market share, owing to their cost-effectiveness and suitability for various applications. However, Turbine Air Starters are showing significant growth potential in specialized sectors.
- Dominant Segment (End-User): The Oil & Gas sector currently represents the largest end-user segment, owing to the high demand for reliable and powerful air starters in their operations. The Power Generation segment is also showing strong growth.
Key Drivers:
- Strong economic growth in [Region Name]
- Increasing investments in energy infrastructure
- Rising demand from the Oil & Gas and Power Generation sectors
- Government support for industrial development
Air Starter Industry Product Innovations
Recent innovations in the air starter industry have focused on enhancing efficiency, durability, and environmental friendliness. Manufacturers are incorporating advanced materials, improving design, and integrating smart technologies to create more robust and reliable products. This includes the development of lighter-weight, more compact air starters, and the integration of improved control systems. These innovations aim to cater to the specific needs of various end-user industries, thereby expanding market reach and achieving competitive advantages.
Report Scope & Segmentation Analysis
This report provides a comprehensive segmentation of the air starter market based on type (Vane Air Starter, Turbine Air Starter) and end-user (Oil & Gas, Power Generation, Mining, Others). Each segment's growth projections, market size, and competitive dynamics are analyzed. The market is expected to grow significantly across all segments during the forecast period, with Vane Air Starters maintaining a substantial market share due to cost-effectiveness. The Oil & Gas sector is projected to drive the majority of growth in the end-user segments.
Key Drivers of Air Starter Industry Growth
The growth of the air starter industry is primarily driven by several key factors:
- Increasing Demand from End-User Industries: The robust growth in the Oil & Gas, Power Generation, and Mining sectors is significantly driving the demand for reliable and efficient air starters.
- Technological Advancements: Continuous innovation in design, materials, and manufacturing processes leads to better performance and efficiency.
- Favorable Economic Conditions: Economic growth in key regions fuels industrial expansion, further boosting the demand for air starters.
Challenges in the Air Starter Industry Sector
The air starter industry faces several challenges:
- Intense Competition: The market is characterized by intense competition among established players and emerging companies, pressuring pricing and margins.
- Supply Chain Disruptions: Global supply chain disruptions can impact the availability of raw materials and components.
- Stringent Regulations: Compliance with environmental and safety regulations adds to manufacturing costs.
Emerging Opportunities in Air Starter Industry
Several emerging opportunities exist for growth:
- Expansion into New Markets: Growing industrialization in developing economies presents significant untapped potential.
- Technological Innovations: The adoption of advanced technologies such as electric air starters presents growth avenues.
- Focus on Sustainability: The increasing emphasis on environmental sustainability creates opportunities for eco-friendly air starter designs.
Leading Players in the Air Starter Industry Market
- Maradyne Corp
- Austart Air Starters
- Ingersoll-Rand Plc
- Miller Air Starter Co Inc
- IPU Group
- Multi Torque Industries Pty Ltd
- The Rowland Company
- KH Equipment Pty Ltd
- Air Starter Components
- Gali Group
Key Developments in Air Starter Industry
- [Month, Year]: Ingersoll-Rand Plc launched a new line of high-efficiency air starters.
- [Month, Year]: Maradyne Corp acquired a smaller competitor, expanding its market share.
- [Month, Year]: New emission regulations came into effect, impacting product development strategies. (Further specific examples of developments with dates and impactful details should be included here).
Future Outlook for Air Starter Industry Market
The air starter industry is poised for continued growth, driven by robust demand from key end-user industries and technological advancements. Strategic partnerships, product diversification, and a focus on sustainability will be crucial for success in this competitive market. The market is projected to reach $XX Million by 2033, representing substantial growth potential for established and emerging players.
Air Starter Industry Segmentation
-
1. Type
- 1.1. Vane Air Starter
- 1.2. Turbine Air Starter
-
2. End-User
- 2.1. Oil & Gas
- 2.2. Power Generation
- 2.3. Mining
- 2.4. Others
Air Starter Industry Segmentation By Geography
- 1. North America
- 2. Asia Pacific
- 3. Europe
- 4. South America
- 5. Middle East and Africa
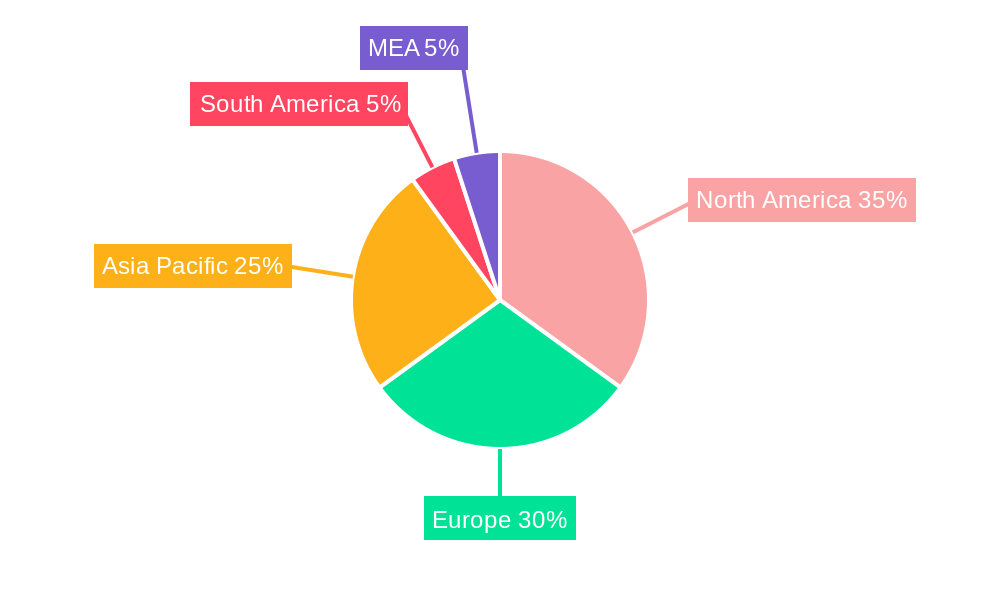
Air Starter Industry Regional Market Share
Geographic Coverage of Air Starter Industry
Air Starter Industry REPORT HIGHLIGHTS
| Aspects | Details |
|---|---|
| Study Period | 2020-2034 |
| Base Year | 2025 |
| Estimated Year | 2026 |
| Forecast Period | 2026-2034 |
| Historical Period | 2020-2025 |
| Growth Rate | CAGR of 4.75% from 2020-2034 |
| Segmentation |
|
Table of Contents
- 1. Introduction
- 1.1. Research Scope
- 1.2. Market Segmentation
- 1.3. Research Objective
- 1.4. Definitions and Assumptions
- 2. Executive Summary
- 2.1. Market Snapshot
- 3. Market Dynamics
- 3.1. Market Drivers
- 3.2. Market Restrains
- 3.3. Market Trends
- 3.4. Market Opportunities
- 4. Market Factor Analysis
- 4.1. Porters Five Forces
- 4.1.1. Bargaining Power of Suppliers
- 4.1.2. Bargaining Power of Buyers
- 4.1.3. Threat of New Entrants
- 4.1.4. Threat of Substitutes
- 4.1.5. Competitive Rivalry
- 4.2. PESTEL analysis
- 4.3. BCG Analysis
- 4.3.1. Stars (High Growth, High Market Share)
- 4.3.2. Cash Cows (Low Growth, High Market Share)
- 4.3.3. Question Mark (High Growth, Low Market Share)
- 4.3.4. Dogs (Low Growth, Low Market Share)
- 4.4. Ansoff Matrix Analysis
- 4.5. Supply Chain Analysis
- 4.6. Regulatory Landscape
- 4.7. Current Market Potential and Opportunity Assessment (TAM–SAM–SOM Framework)
- 4.8. PRI Analyst Note
- 4.1. Porters Five Forces
- 5. Market Analysis, Insights and Forecast 2021-2033
- 5.1. Market Analysis, Insights and Forecast - by Type
- 5.1.1. Vane Air Starter
- 5.1.2. Turbine Air Starter
- 5.2. Market Analysis, Insights and Forecast - by End-User
- 5.2.1. Oil & Gas
- 5.2.2. Power Generation
- 5.2.3. Mining
- 5.2.4. Others
- 5.3. Market Analysis, Insights and Forecast - by Region
- 5.3.1. North America
- 5.3.2. Asia Pacific
- 5.3.3. Europe
- 5.3.4. South America
- 5.3.5. Middle East and Africa
- 5.1. Market Analysis, Insights and Forecast - by Type
- 6. Global Air Starter Industry Analysis, Insights and Forecast, 2021-2033
- 6.1. Market Analysis, Insights and Forecast - by Type
- 6.1.1. Vane Air Starter
- 6.1.2. Turbine Air Starter
- 6.2. Market Analysis, Insights and Forecast - by End-User
- 6.2.1. Oil & Gas
- 6.2.2. Power Generation
- 6.2.3. Mining
- 6.2.4. Others
- 6.1. Market Analysis, Insights and Forecast - by Type
- 7. North America Air Starter Industry Analysis, Insights and Forecast, 2020-2032
- 7.1. Market Analysis, Insights and Forecast - by Type
- 7.1.1. Vane Air Starter
- 7.1.2. Turbine Air Starter
- 7.2. Market Analysis, Insights and Forecast - by End-User
- 7.2.1. Oil & Gas
- 7.2.2. Power Generation
- 7.2.3. Mining
- 7.2.4. Others
- 7.1. Market Analysis, Insights and Forecast - by Type
- 8. Asia Pacific Air Starter Industry Analysis, Insights and Forecast, 2020-2032
- 8.1. Market Analysis, Insights and Forecast - by Type
- 8.1.1. Vane Air Starter
- 8.1.2. Turbine Air Starter
- 8.2. Market Analysis, Insights and Forecast - by End-User
- 8.2.1. Oil & Gas
- 8.2.2. Power Generation
- 8.2.3. Mining
- 8.2.4. Others
- 8.1. Market Analysis, Insights and Forecast - by Type
- 9. Europe Air Starter Industry Analysis, Insights and Forecast, 2020-2032
- 9.1. Market Analysis, Insights and Forecast - by Type
- 9.1.1. Vane Air Starter
- 9.1.2. Turbine Air Starter
- 9.2. Market Analysis, Insights and Forecast - by End-User
- 9.2.1. Oil & Gas
- 9.2.2. Power Generation
- 9.2.3. Mining
- 9.2.4. Others
- 9.1. Market Analysis, Insights and Forecast - by Type
- 10. South America Air Starter Industry Analysis, Insights and Forecast, 2020-2032
- 10.1. Market Analysis, Insights and Forecast - by Type
- 10.1.1. Vane Air Starter
- 10.1.2. Turbine Air Starter
- 10.2. Market Analysis, Insights and Forecast - by End-User
- 10.2.1. Oil & Gas
- 10.2.2. Power Generation
- 10.2.3. Mining
- 10.2.4. Others
- 10.1. Market Analysis, Insights and Forecast - by Type
- 11. Middle East and Africa Air Starter Industry Analysis, Insights and Forecast, 2020-2032
- 11.1. Market Analysis, Insights and Forecast - by Type
- 11.1.1. Vane Air Starter
- 11.1.2. Turbine Air Starter
- 11.2. Market Analysis, Insights and Forecast - by End-User
- 11.2.1. Oil & Gas
- 11.2.2. Power Generation
- 11.2.3. Mining
- 11.2.4. Others
- 11.1. Market Analysis, Insights and Forecast - by Type
- 12. Competitive Analysis
- 12.1. Company Profiles
- 12.1.1 Maradyne Corp
- 12.1.1.1. Company Overview
- 12.1.1.2. Products
- 12.1.1.3. Company Financials
- 12.1.1.4. SWOT Analysis
- 12.1.2 Austart Air Starters
- 12.1.2.1. Company Overview
- 12.1.2.2. Products
- 12.1.2.3. Company Financials
- 12.1.2.4. SWOT Analysis
- 12.1.3 Ingersoll-Rand Plc
- 12.1.3.1. Company Overview
- 12.1.3.2. Products
- 12.1.3.3. Company Financials
- 12.1.3.4. SWOT Analysis
- 12.1.4 Miller Air Starter Co Inc
- 12.1.4.1. Company Overview
- 12.1.4.2. Products
- 12.1.4.3. Company Financials
- 12.1.4.4. SWOT Analysis
- 12.1.5 IPU Group
- 12.1.5.1. Company Overview
- 12.1.5.2. Products
- 12.1.5.3. Company Financials
- 12.1.5.4. SWOT Analysis
- 12.1.6 Multi Torque Industries Pty Ltd
- 12.1.6.1. Company Overview
- 12.1.6.2. Products
- 12.1.6.3. Company Financials
- 12.1.6.4. SWOT Analysis
- 12.1.7 The Rowland Company
- 12.1.7.1. Company Overview
- 12.1.7.2. Products
- 12.1.7.3. Company Financials
- 12.1.7.4. SWOT Analysis
- 12.1.8 KH Equipment Pty Ltd
- 12.1.8.1. Company Overview
- 12.1.8.2. Products
- 12.1.8.3. Company Financials
- 12.1.8.4. SWOT Analysis
- 12.1.9 Air Starter Components
- 12.1.9.1. Company Overview
- 12.1.9.2. Products
- 12.1.9.3. Company Financials
- 12.1.9.4. SWOT Analysis
- 12.1.10 Gali Group
- 12.1.10.1. Company Overview
- 12.1.10.2. Products
- 12.1.10.3. Company Financials
- 12.1.10.4. SWOT Analysis
- 12.1.1 Maradyne Corp
- 12.2. Market Entropy
- 12.2.1 Company's Key Areas Served
- 12.2.2 Recent Developments
- 12.3. Company Market Share Analysis 2025
- 12.3.1 Top 5 Companies Market Share Analysis
- 12.3.2 Top 3 Companies Market Share Analysis
- 12.4. List of Potential Customers
- 13. Research Methodology
List of Figures
- Figure 1: Global Air Starter Industry Revenue Breakdown (million, %) by Region 2025 & 2033
- Figure 2: Global Air Starter Industry Volume Breakdown (K Units, %) by Region 2025 & 2033
- Figure 3: North America Air Starter Industry Revenue (million), by Type 2025 & 2033
- Figure 4: North America Air Starter Industry Volume (K Units), by Type 2025 & 2033
- Figure 5: North America Air Starter Industry Revenue Share (%), by Type 2025 & 2033
- Figure 6: North America Air Starter Industry Volume Share (%), by Type 2025 & 2033
- Figure 7: North America Air Starter Industry Revenue (million), by End-User 2025 & 2033
- Figure 8: North America Air Starter Industry Volume (K Units), by End-User 2025 & 2033
- Figure 9: North America Air Starter Industry Revenue Share (%), by End-User 2025 & 2033
- Figure 10: North America Air Starter Industry Volume Share (%), by End-User 2025 & 2033
- Figure 11: North America Air Starter Industry Revenue (million), by Country 2025 & 2033
- Figure 12: North America Air Starter Industry Volume (K Units), by Country 2025 & 2033
- Figure 13: North America Air Starter Industry Revenue Share (%), by Country 2025 & 2033
- Figure 14: North America Air Starter Industry Volume Share (%), by Country 2025 & 2033
- Figure 15: Asia Pacific Air Starter Industry Revenue (million), by Type 2025 & 2033
- Figure 16: Asia Pacific Air Starter Industry Volume (K Units), by Type 2025 & 2033
- Figure 17: Asia Pacific Air Starter Industry Revenue Share (%), by Type 2025 & 2033
- Figure 18: Asia Pacific Air Starter Industry Volume Share (%), by Type 2025 & 2033
- Figure 19: Asia Pacific Air Starter Industry Revenue (million), by End-User 2025 & 2033
- Figure 20: Asia Pacific Air Starter Industry Volume (K Units), by End-User 2025 & 2033
- Figure 21: Asia Pacific Air Starter Industry Revenue Share (%), by End-User 2025 & 2033
- Figure 22: Asia Pacific Air Starter Industry Volume Share (%), by End-User 2025 & 2033
- Figure 23: Asia Pacific Air Starter Industry Revenue (million), by Country 2025 & 2033
- Figure 24: Asia Pacific Air Starter Industry Volume (K Units), by Country 2025 & 2033
- Figure 25: Asia Pacific Air Starter Industry Revenue Share (%), by Country 2025 & 2033
- Figure 26: Asia Pacific Air Starter Industry Volume Share (%), by Country 2025 & 2033
- Figure 27: Europe Air Starter Industry Revenue (million), by Type 2025 & 2033
- Figure 28: Europe Air Starter Industry Volume (K Units), by Type 2025 & 2033
- Figure 29: Europe Air Starter Industry Revenue Share (%), by Type 2025 & 2033
- Figure 30: Europe Air Starter Industry Volume Share (%), by Type 2025 & 2033
- Figure 31: Europe Air Starter Industry Revenue (million), by End-User 2025 & 2033
- Figure 32: Europe Air Starter Industry Volume (K Units), by End-User 2025 & 2033
- Figure 33: Europe Air Starter Industry Revenue Share (%), by End-User 2025 & 2033
- Figure 34: Europe Air Starter Industry Volume Share (%), by End-User 2025 & 2033
- Figure 35: Europe Air Starter Industry Revenue (million), by Country 2025 & 2033
- Figure 36: Europe Air Starter Industry Volume (K Units), by Country 2025 & 2033
- Figure 37: Europe Air Starter Industry Revenue Share (%), by Country 2025 & 2033
- Figure 38: Europe Air Starter Industry Volume Share (%), by Country 2025 & 2033
- Figure 39: South America Air Starter Industry Revenue (million), by Type 2025 & 2033
- Figure 40: South America Air Starter Industry Volume (K Units), by Type 2025 & 2033
- Figure 41: South America Air Starter Industry Revenue Share (%), by Type 2025 & 2033
- Figure 42: South America Air Starter Industry Volume Share (%), by Type 2025 & 2033
- Figure 43: South America Air Starter Industry Revenue (million), by End-User 2025 & 2033
- Figure 44: South America Air Starter Industry Volume (K Units), by End-User 2025 & 2033
- Figure 45: South America Air Starter Industry Revenue Share (%), by End-User 2025 & 2033
- Figure 46: South America Air Starter Industry Volume Share (%), by End-User 2025 & 2033
- Figure 47: South America Air Starter Industry Revenue (million), by Country 2025 & 2033
- Figure 48: South America Air Starter Industry Volume (K Units), by Country 2025 & 2033
- Figure 49: South America Air Starter Industry Revenue Share (%), by Country 2025 & 2033
- Figure 50: South America Air Starter Industry Volume Share (%), by Country 2025 & 2033
- Figure 51: Middle East and Africa Air Starter Industry Revenue (million), by Type 2025 & 2033
- Figure 52: Middle East and Africa Air Starter Industry Volume (K Units), by Type 2025 & 2033
- Figure 53: Middle East and Africa Air Starter Industry Revenue Share (%), by Type 2025 & 2033
- Figure 54: Middle East and Africa Air Starter Industry Volume Share (%), by Type 2025 & 2033
- Figure 55: Middle East and Africa Air Starter Industry Revenue (million), by End-User 2025 & 2033
- Figure 56: Middle East and Africa Air Starter Industry Volume (K Units), by End-User 2025 & 2033
- Figure 57: Middle East and Africa Air Starter Industry Revenue Share (%), by End-User 2025 & 2033
- Figure 58: Middle East and Africa Air Starter Industry Volume Share (%), by End-User 2025 & 2033
- Figure 59: Middle East and Africa Air Starter Industry Revenue (million), by Country 2025 & 2033
- Figure 60: Middle East and Africa Air Starter Industry Volume (K Units), by Country 2025 & 2033
- Figure 61: Middle East and Africa Air Starter Industry Revenue Share (%), by Country 2025 & 2033
- Figure 62: Middle East and Africa Air Starter Industry Volume Share (%), by Country 2025 & 2033
List of Tables
- Table 1: Global Air Starter Industry Revenue million Forecast, by Type 2020 & 2033
- Table 2: Global Air Starter Industry Volume K Units Forecast, by Type 2020 & 2033
- Table 3: Global Air Starter Industry Revenue million Forecast, by End-User 2020 & 2033
- Table 4: Global Air Starter Industry Volume K Units Forecast, by End-User 2020 & 2033
- Table 5: Global Air Starter Industry Revenue million Forecast, by Region 2020 & 2033
- Table 6: Global Air Starter Industry Volume K Units Forecast, by Region 2020 & 2033
- Table 7: Global Air Starter Industry Revenue million Forecast, by Type 2020 & 2033
- Table 8: Global Air Starter Industry Volume K Units Forecast, by Type 2020 & 2033
- Table 9: Global Air Starter Industry Revenue million Forecast, by End-User 2020 & 2033
- Table 10: Global Air Starter Industry Volume K Units Forecast, by End-User 2020 & 2033
- Table 11: Global Air Starter Industry Revenue million Forecast, by Country 2020 & 2033
- Table 12: Global Air Starter Industry Volume K Units Forecast, by Country 2020 & 2033
- Table 13: Global Air Starter Industry Revenue million Forecast, by Type 2020 & 2033
- Table 14: Global Air Starter Industry Volume K Units Forecast, by Type 2020 & 2033
- Table 15: Global Air Starter Industry Revenue million Forecast, by End-User 2020 & 2033
- Table 16: Global Air Starter Industry Volume K Units Forecast, by End-User 2020 & 2033
- Table 17: Global Air Starter Industry Revenue million Forecast, by Country 2020 & 2033
- Table 18: Global Air Starter Industry Volume K Units Forecast, by Country 2020 & 2033
- Table 19: Global Air Starter Industry Revenue million Forecast, by Type 2020 & 2033
- Table 20: Global Air Starter Industry Volume K Units Forecast, by Type 2020 & 2033
- Table 21: Global Air Starter Industry Revenue million Forecast, by End-User 2020 & 2033
- Table 22: Global Air Starter Industry Volume K Units Forecast, by End-User 2020 & 2033
- Table 23: Global Air Starter Industry Revenue million Forecast, by Country 2020 & 2033
- Table 24: Global Air Starter Industry Volume K Units Forecast, by Country 2020 & 2033
- Table 25: Global Air Starter Industry Revenue million Forecast, by Type 2020 & 2033
- Table 26: Global Air Starter Industry Volume K Units Forecast, by Type 2020 & 2033
- Table 27: Global Air Starter Industry Revenue million Forecast, by End-User 2020 & 2033
- Table 28: Global Air Starter Industry Volume K Units Forecast, by End-User 2020 & 2033
- Table 29: Global Air Starter Industry Revenue million Forecast, by Country 2020 & 2033
- Table 30: Global Air Starter Industry Volume K Units Forecast, by Country 2020 & 2033
- Table 31: Global Air Starter Industry Revenue million Forecast, by Type 2020 & 2033
- Table 32: Global Air Starter Industry Volume K Units Forecast, by Type 2020 & 2033
- Table 33: Global Air Starter Industry Revenue million Forecast, by End-User 2020 & 2033
- Table 34: Global Air Starter Industry Volume K Units Forecast, by End-User 2020 & 2033
- Table 35: Global Air Starter Industry Revenue million Forecast, by Country 2020 & 2033
- Table 36: Global Air Starter Industry Volume K Units Forecast, by Country 2020 & 2033
Frequently Asked Questions
1. What is the projected Compound Annual Growth Rate (CAGR) of the Air Starter Industry?
The projected CAGR is approximately 4.75%.
2. Which companies are prominent players in the Air Starter Industry?
Key companies in the market include Maradyne Corp, Austart Air Starters, Ingersoll-Rand Plc, Miller Air Starter Co Inc, IPU Group, Multi Torque Industries Pty Ltd, The Rowland Company, KH Equipment Pty Ltd, Air Starter Components, Gali Group.
3. What are the main segments of the Air Starter Industry?
The market segments include Type, End-User.
4. Can you provide details about the market size?
The market size is estimated to be USD 416.18 million as of 2022.
5. What are some drivers contributing to market growth?
4.; Growing Vehicle Ownership4.; Government Initiatives.
6. What are the notable trends driving market growth?
Oil & Gas Sector to Dominate the Market.
7. Are there any restraints impacting market growth?
4.; Volatile Crude Oil Prices.
8. Can you provide examples of recent developments in the market?
N/A
9. What pricing options are available for accessing the report?
Pricing options include single-user, multi-user, and enterprise licenses priced at USD 4750, USD 5250, and USD 8750 respectively.
10. Is the market size provided in terms of value or volume?
The market size is provided in terms of value, measured in million and volume, measured in K Units.
11. Are there any specific market keywords associated with the report?
Yes, the market keyword associated with the report is "Air Starter Industry," which aids in identifying and referencing the specific market segment covered.
12. How do I determine which pricing option suits my needs best?
The pricing options vary based on user requirements and access needs. Individual users may opt for single-user licenses, while businesses requiring broader access may choose multi-user or enterprise licenses for cost-effective access to the report.
13. Are there any additional resources or data provided in the Air Starter Industry report?
While the report offers comprehensive insights, it's advisable to review the specific contents or supplementary materials provided to ascertain if additional resources or data are available.
14. How can I stay updated on further developments or reports in the Air Starter Industry?
To stay informed about further developments, trends, and reports in the Air Starter Industry, consider subscribing to industry newsletters, following relevant companies and organizations, or regularly checking reputable industry news sources and publications.
Methodology
Step 1 - Identification of Relevant Samples Size from Population Database


Step 2 - Approaches for Defining Global Market Size (Value, Volume* & Price*)

Note*: In applicable scenarios
Step 3 - Data Sources
Primary Research
- Web Analytics
- Survey Reports
- Research Institute
- Latest Research Reports
- Opinion Leaders
Secondary Research
- Annual Reports
- White Paper
- Latest Press Release
- Industry Association
- Paid Database
- Investor Presentations

Step 4 - Data Triangulation
Involves using different sources of information in order to increase the validity of a study
These sources are likely to be stakeholders in a program - participants, other researchers, program staff, other community members, and so on.
Then we put all data in single framework & apply various statistical tools to find out the dynamic on the market.
During the analysis stage, feedback from the stakeholder groups would be compared to determine areas of agreement as well as areas of divergence