


Key Insights
The global air insulated switchgear market is projected for robust expansion, driven by the escalating need for dependable and efficient power distribution across diverse industries. A projected compound annual growth rate (CAGR) of 7.71% indicates significant market growth from a base year of 2025, reaching an estimated market size of 93.83 billion by the forecast period's end. Key growth drivers include substantial infrastructure development in emerging economies, the increasing integration of renewable energy sources demanding adaptable switchgear, and the continuous automation and expansion within the industrial sector. Stringent safety regulations and a growing emphasis on power outage prevention further bolster market demand. High-voltage switchgear dominates the market share due to its critical role in large-scale power transmission and distribution. While power utilities remain the primary end-users, industrial and commercial sectors are showing considerable growth, propelled by automation initiatives. Leading manufacturers are investing in R&D for smart grid integration and digitalization to elevate product performance. Geographically, North America and Europe hold significant market positions, with the Asia-Pacific region anticipated to exhibit the fastest growth due to rapid industrialization and urbanization.

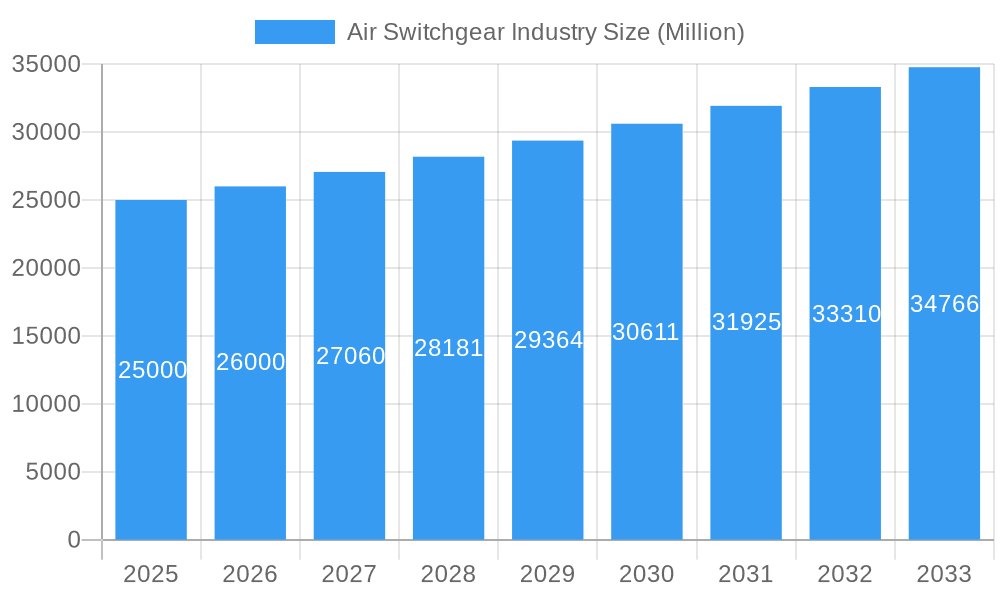
Air Switchgear Industry Market Size (In Billion)

The competitive environment features established global entities and regional competitors, with innovation, technological advancement, and cost-effectiveness being primary differentiators. Companies are prioritizing the development of energy-efficient and sustainable solutions. The market is likely to witness further consolidation through strategic alliances, mergers, and acquisitions. Despite challenges such as fluctuating raw material costs and supply chain disruptions, the long-term outlook for air insulated switchgear remains exceptionally positive, underpinned by sustained global energy sector expansion and the persistent demand for reliable power infrastructure. Significant opportunities exist for innovation and market penetration across various segments and regions.
Air Switchgear Industry Company Market Share
Air Switchgear Industry Market Report: 2019-2033
This comprehensive report provides a detailed analysis of the global air switchgear industry, offering invaluable insights for industry professionals, investors, and strategic decision-makers. The report covers the period from 2019 to 2033, with a base year of 2025 and a forecast period of 2025-2033. The market size is valued in Millions USD throughout the report.
Air Switchgear Industry Market Structure & Innovation Trends
This section analyzes the competitive landscape, innovation drivers, and regulatory influences shaping the air switchgear market. We examine market concentration, assessing the market share held by key players such as Elatec Power Distribution GmbH, ABB Ltd, Alfanar Group, Larsen & Toubro Limited, Mitsubishi Electric Corporation, Siemens AG, Schneider Electric SE, Eaton Corporation PLC, Wenzhou Unisun Electric Co Ltd, and Tavrida Electric (list not exhaustive). The report also delves into M&A activities, quantifying deal values (in Millions USD) where data is available. Innovation drivers, such as the increasing demand for smart grids and advanced automation, are analyzed alongside regulatory frameworks impacting product development and market access. The report also considers the impact of substitute products and evolving end-user demographics. Expected market share data for 2025 is included, with xx% attributed to the top 5 players and xx% to the remaining market. Analysis of M&A deal values for the historical period (2019-2024) reveals a total of approximately $xx Million in transactions.
Air Switchgear Industry Market Dynamics & Trends
This section provides a comprehensive overview of market dynamics, including growth drivers, technological advancements, consumer preferences, and competitive dynamics. We analyze the Compound Annual Growth Rate (CAGR) for the forecast period (2025-2033), estimating a value of xx%. Market penetration rates for various air switchgear types across different end-user segments are also examined. The influence of technological disruptions, such as the adoption of digital technologies and IoT solutions, on market growth is assessed. Furthermore, changing consumer preferences, such as the growing demand for energy-efficient and environmentally friendly solutions, are considered. The competitive dynamics section assesses the strategies adopted by leading players to maintain their market positions and gain competitive advantage.
Dominant Regions & Segments in Air Switchgear Industry
This section identifies the leading regions and segments within the air switchgear market. We analyze performance across voltage levels (Low Voltage, Medium Voltage, High Voltage) and end-user segments (Power Utilities, Industrial, Commercial, and Residential). The report highlights the region (e.g., North America, Europe, Asia-Pacific) exhibiting the strongest growth, providing a detailed analysis of the factors driving its dominance.
Key Drivers for Dominant Region:
- Robust economic growth and supportive government policies.
- Significant investments in infrastructure development.
- High adoption of renewable energy sources.
- Strong industrialization and urbanization.
Dominant Segment Analysis: This section provides a detailed analysis of the dominant segment (e.g., High Voltage in the Power Utilities sector) specifying its market share and explaining its leading position in the market.
Air Switchgear Industry Product Innovations
This section summarizes recent product developments and technological trends in the air switchgear industry, highlighting key innovations such as improved insulation materials, enhanced safety features, and advanced monitoring capabilities. We analyze the competitive advantages offered by these new products and their market fit, considering factors such as cost-effectiveness, reliability, and ease of installation. The impact of these innovations on market growth is also evaluated.
Report Scope & Segmentation Analysis
This report segments the air switchgear market based on voltage level (Low Voltage, Medium Voltage, High Voltage) and end-user (Power Utilities, Industrial, Commercial, Residential). Each segment's growth projections, market size in Millions USD for 2025, and competitive dynamics are detailed. For example, the High Voltage segment is expected to witness significant growth due to expansion of power transmission infrastructure. The Power Utilities segment is anticipated to be the largest due to significant investments in upgrading power grids.
Key Drivers of Air Switchgear Industry Growth
Key drivers of air switchgear industry growth include increased investment in renewable energy infrastructure, the expansion of smart grids, and the growing demand for reliable and efficient power distribution systems across various sectors. Stringent safety regulations and government initiatives promoting energy efficiency also contribute to market growth.
Challenges in the Air Switchgear Industry Sector
Challenges facing the air switchgear industry include fluctuating raw material prices, stringent environmental regulations, and intense competition among manufacturers. Supply chain disruptions and increasing labor costs also pose significant challenges to profitability. The impact of these challenges on market growth is quantified where possible.
Emerging Opportunities in Air Switchgear Industry
Emerging opportunities include the growing adoption of smart grid technologies, the increasing demand for energy-efficient switchgear, and expansion into developing economies. The integration of IoT sensors and advanced analytics into switchgear systems presents significant opportunities for market expansion.
Leading Players in the Air Switchgear Industry Market
- Elatec Power Distribution GmbH
- ABB Ltd
- Alfanar Group
- Larsen & Toubro Limited
- Mitsubishi Electric Corporation
- Siemens AG
- Schneider Electric SE
- Eaton Corporation PLC
- Wenzhou Unisun Electric Co Ltd
- Tavrida Electric
*List Not Exhaustive
Key Developments in Air Switchgear Industry
- August 2021: Schneider Electric launched GenieEvo Connected, a comprehensive, reliable switchgear range with unparalleled connectivity for asset health monitoring, setting a new standard for primary air-insulated switchgear with 24/7 cloud-based service for efficient maintenance. This launch significantly enhanced the market offering in terms of digitalization and remote monitoring capabilities.
Future Outlook for Air Switchgear Industry Market
The air switchgear market is poised for continued growth, driven by increasing investments in power infrastructure upgrades, the expansion of renewable energy sources, and the ongoing adoption of smart grid technologies. Strategic partnerships and technological advancements will play a crucial role in shaping future market dynamics and unlocking significant opportunities for industry players.
Air Switchgear Industry Segmentation
-
1. Voltage Level
- 1.1. Low Voltage
- 1.2. Medium Voltage
- 1.3. High Voltage
-
2. End-User
- 2.1. Power Utilities
- 2.2. Industrial
- 2.3. Commercial and Residential
Air Switchgear Industry Segmentation By Geography
- 1. North America
- 2. Europe
- 3. Asia Pacific
- 4. South America
- 5. Middle East and Africa

Air Switchgear Industry Regional Market Share
Geographic Coverage of Air Switchgear Industry
Air Switchgear Industry REPORT HIGHLIGHTS
| Aspects | Details |
|---|---|
| Study Period | 2020-2034 |
| Base Year | 2025 |
| Estimated Year | 2026 |
| Forecast Period | 2026-2034 |
| Historical Period | 2020-2025 |
| Growth Rate | CAGR of 7.71% from 2020-2034 |
| Segmentation |
|
Table of Contents
- 1. Introduction
- 1.1. Research Scope
- 1.2. Market Segmentation
- 1.3. Research Methodology
- 1.4. Definitions and Assumptions
- 2. Executive Summary
- 2.1. Introduction
- 3. Market Dynamics
- 3.1. Introduction
- 3.2. Market Drivers
- 3.2.1. 4.; Increasing Integration Of Renewable Energy Generation4.; Aging Power Grids And Investments In Transmission And Distribution Infrastructure
- 3.3. Market Restrains
- 3.3.1. 4.; Lack Of Investor Confidence Due To Sociopolitical Instability In Some Countries
- 3.4. Market Trends
- 3.4.1. Power Utilities Segment to Witness Significant Demand
- 4. Market Factor Analysis
- 4.1. Porters Five Forces
- 4.2. Supply/Value Chain
- 4.3. PESTEL analysis
- 4.4. Market Entropy
- 4.5. Patent/Trademark Analysis
- 5. Global Air Switchgear Industry Analysis, Insights and Forecast, 2020-2032
- 5.1. Market Analysis, Insights and Forecast - by Voltage Level
- 5.1.1. Low Voltage
- 5.1.2. Medium Voltage
- 5.1.3. High Voltage
- 5.2. Market Analysis, Insights and Forecast - by End-User
- 5.2.1. Power Utilities
- 5.2.2. Industrial
- 5.2.3. Commercial and Residential
- 5.3. Market Analysis, Insights and Forecast - by Region
- 5.3.1. North America
- 5.3.2. Europe
- 5.3.3. Asia Pacific
- 5.3.4. South America
- 5.3.5. Middle East and Africa
- 5.1. Market Analysis, Insights and Forecast - by Voltage Level
- 6. North America Air Switchgear Industry Analysis, Insights and Forecast, 2020-2032
- 6.1. Market Analysis, Insights and Forecast - by Voltage Level
- 6.1.1. Low Voltage
- 6.1.2. Medium Voltage
- 6.1.3. High Voltage
- 6.2. Market Analysis, Insights and Forecast - by End-User
- 6.2.1. Power Utilities
- 6.2.2. Industrial
- 6.2.3. Commercial and Residential
- 6.1. Market Analysis, Insights and Forecast - by Voltage Level
- 7. Europe Air Switchgear Industry Analysis, Insights and Forecast, 2020-2032
- 7.1. Market Analysis, Insights and Forecast - by Voltage Level
- 7.1.1. Low Voltage
- 7.1.2. Medium Voltage
- 7.1.3. High Voltage
- 7.2. Market Analysis, Insights and Forecast - by End-User
- 7.2.1. Power Utilities
- 7.2.2. Industrial
- 7.2.3. Commercial and Residential
- 7.1. Market Analysis, Insights and Forecast - by Voltage Level
- 8. Asia Pacific Air Switchgear Industry Analysis, Insights and Forecast, 2020-2032
- 8.1. Market Analysis, Insights and Forecast - by Voltage Level
- 8.1.1. Low Voltage
- 8.1.2. Medium Voltage
- 8.1.3. High Voltage
- 8.2. Market Analysis, Insights and Forecast - by End-User
- 8.2.1. Power Utilities
- 8.2.2. Industrial
- 8.2.3. Commercial and Residential
- 8.1. Market Analysis, Insights and Forecast - by Voltage Level
- 9. South America Air Switchgear Industry Analysis, Insights and Forecast, 2020-2032
- 9.1. Market Analysis, Insights and Forecast - by Voltage Level
- 9.1.1. Low Voltage
- 9.1.2. Medium Voltage
- 9.1.3. High Voltage
- 9.2. Market Analysis, Insights and Forecast - by End-User
- 9.2.1. Power Utilities
- 9.2.2. Industrial
- 9.2.3. Commercial and Residential
- 9.1. Market Analysis, Insights and Forecast - by Voltage Level
- 10. Middle East and Africa Air Switchgear Industry Analysis, Insights and Forecast, 2020-2032
- 10.1. Market Analysis, Insights and Forecast - by Voltage Level
- 10.1.1. Low Voltage
- 10.1.2. Medium Voltage
- 10.1.3. High Voltage
- 10.2. Market Analysis, Insights and Forecast - by End-User
- 10.2.1. Power Utilities
- 10.2.2. Industrial
- 10.2.3. Commercial and Residential
- 10.1. Market Analysis, Insights and Forecast - by Voltage Level
- 11. Competitive Analysis
- 11.1. Global Market Share Analysis 2025
- 11.2. Company Profiles
- 11.2.1 Elatec Power Distribution GmbH
- 11.2.1.1. Overview
- 11.2.1.2. Products
- 11.2.1.3. SWOT Analysis
- 11.2.1.4. Recent Developments
- 11.2.1.5. Financials (Based on Availability)
- 11.2.2 ABB Ltd
- 11.2.2.1. Overview
- 11.2.2.2. Products
- 11.2.2.3. SWOT Analysis
- 11.2.2.4. Recent Developments
- 11.2.2.5. Financials (Based on Availability)
- 11.2.3 Alfanar Group
- 11.2.3.1. Overview
- 11.2.3.2. Products
- 11.2.3.3. SWOT Analysis
- 11.2.3.4. Recent Developments
- 11.2.3.5. Financials (Based on Availability)
- 11.2.4 Larsen & Toubro Limited
- 11.2.4.1. Overview
- 11.2.4.2. Products
- 11.2.4.3. SWOT Analysis
- 11.2.4.4. Recent Developments
- 11.2.4.5. Financials (Based on Availability)
- 11.2.5 Mitsubishi Electric Corporation
- 11.2.5.1. Overview
- 11.2.5.2. Products
- 11.2.5.3. SWOT Analysis
- 11.2.5.4. Recent Developments
- 11.2.5.5. Financials (Based on Availability)
- 11.2.6 Siemens AG
- 11.2.6.1. Overview
- 11.2.6.2. Products
- 11.2.6.3. SWOT Analysis
- 11.2.6.4. Recent Developments
- 11.2.6.5. Financials (Based on Availability)
- 11.2.7 Schneider Electric SE
- 11.2.7.1. Overview
- 11.2.7.2. Products
- 11.2.7.3. SWOT Analysis
- 11.2.7.4. Recent Developments
- 11.2.7.5. Financials (Based on Availability)
- 11.2.8 Eaton Corporation PLC
- 11.2.8.1. Overview
- 11.2.8.2. Products
- 11.2.8.3. SWOT Analysis
- 11.2.8.4. Recent Developments
- 11.2.8.5. Financials (Based on Availability)
- 11.2.9 Wenzhou Unisun Electric Co Ltd
- 11.2.9.1. Overview
- 11.2.9.2. Products
- 11.2.9.3. SWOT Analysis
- 11.2.9.4. Recent Developments
- 11.2.9.5. Financials (Based on Availability)
- 11.2.10 Tavrida Electric*List Not Exhaustive
- 11.2.10.1. Overview
- 11.2.10.2. Products
- 11.2.10.3. SWOT Analysis
- 11.2.10.4. Recent Developments
- 11.2.10.5. Financials (Based on Availability)
- 11.2.1 Elatec Power Distribution GmbH
List of Figures
- Figure 1: Global Air Switchgear Industry Revenue Breakdown (billion, %) by Region 2025 & 2033
- Figure 2: North America Air Switchgear Industry Revenue (billion), by Voltage Level 2025 & 2033
- Figure 3: North America Air Switchgear Industry Revenue Share (%), by Voltage Level 2025 & 2033
- Figure 4: North America Air Switchgear Industry Revenue (billion), by End-User 2025 & 2033
- Figure 5: North America Air Switchgear Industry Revenue Share (%), by End-User 2025 & 2033
- Figure 6: North America Air Switchgear Industry Revenue (billion), by Country 2025 & 2033
- Figure 7: North America Air Switchgear Industry Revenue Share (%), by Country 2025 & 2033
- Figure 8: Europe Air Switchgear Industry Revenue (billion), by Voltage Level 2025 & 2033
- Figure 9: Europe Air Switchgear Industry Revenue Share (%), by Voltage Level 2025 & 2033
- Figure 10: Europe Air Switchgear Industry Revenue (billion), by End-User 2025 & 2033
- Figure 11: Europe Air Switchgear Industry Revenue Share (%), by End-User 2025 & 2033
- Figure 12: Europe Air Switchgear Industry Revenue (billion), by Country 2025 & 2033
- Figure 13: Europe Air Switchgear Industry Revenue Share (%), by Country 2025 & 2033
- Figure 14: Asia Pacific Air Switchgear Industry Revenue (billion), by Voltage Level 2025 & 2033
- Figure 15: Asia Pacific Air Switchgear Industry Revenue Share (%), by Voltage Level 2025 & 2033
- Figure 16: Asia Pacific Air Switchgear Industry Revenue (billion), by End-User 2025 & 2033
- Figure 17: Asia Pacific Air Switchgear Industry Revenue Share (%), by End-User 2025 & 2033
- Figure 18: Asia Pacific Air Switchgear Industry Revenue (billion), by Country 2025 & 2033
- Figure 19: Asia Pacific Air Switchgear Industry Revenue Share (%), by Country 2025 & 2033
- Figure 20: South America Air Switchgear Industry Revenue (billion), by Voltage Level 2025 & 2033
- Figure 21: South America Air Switchgear Industry Revenue Share (%), by Voltage Level 2025 & 2033
- Figure 22: South America Air Switchgear Industry Revenue (billion), by End-User 2025 & 2033
- Figure 23: South America Air Switchgear Industry Revenue Share (%), by End-User 2025 & 2033
- Figure 24: South America Air Switchgear Industry Revenue (billion), by Country 2025 & 2033
- Figure 25: South America Air Switchgear Industry Revenue Share (%), by Country 2025 & 2033
- Figure 26: Middle East and Africa Air Switchgear Industry Revenue (billion), by Voltage Level 2025 & 2033
- Figure 27: Middle East and Africa Air Switchgear Industry Revenue Share (%), by Voltage Level 2025 & 2033
- Figure 28: Middle East and Africa Air Switchgear Industry Revenue (billion), by End-User 2025 & 2033
- Figure 29: Middle East and Africa Air Switchgear Industry Revenue Share (%), by End-User 2025 & 2033
- Figure 30: Middle East and Africa Air Switchgear Industry Revenue (billion), by Country 2025 & 2033
- Figure 31: Middle East and Africa Air Switchgear Industry Revenue Share (%), by Country 2025 & 2033
List of Tables
- Table 1: Global Air Switchgear Industry Revenue billion Forecast, by Voltage Level 2020 & 2033
- Table 2: Global Air Switchgear Industry Revenue billion Forecast, by End-User 2020 & 2033
- Table 3: Global Air Switchgear Industry Revenue billion Forecast, by Region 2020 & 2033
- Table 4: Global Air Switchgear Industry Revenue billion Forecast, by Voltage Level 2020 & 2033
- Table 5: Global Air Switchgear Industry Revenue billion Forecast, by End-User 2020 & 2033
- Table 6: Global Air Switchgear Industry Revenue billion Forecast, by Country 2020 & 2033
- Table 7: Global Air Switchgear Industry Revenue billion Forecast, by Voltage Level 2020 & 2033
- Table 8: Global Air Switchgear Industry Revenue billion Forecast, by End-User 2020 & 2033
- Table 9: Global Air Switchgear Industry Revenue billion Forecast, by Country 2020 & 2033
- Table 10: Global Air Switchgear Industry Revenue billion Forecast, by Voltage Level 2020 & 2033
- Table 11: Global Air Switchgear Industry Revenue billion Forecast, by End-User 2020 & 2033
- Table 12: Global Air Switchgear Industry Revenue billion Forecast, by Country 2020 & 2033
- Table 13: Global Air Switchgear Industry Revenue billion Forecast, by Voltage Level 2020 & 2033
- Table 14: Global Air Switchgear Industry Revenue billion Forecast, by End-User 2020 & 2033
- Table 15: Global Air Switchgear Industry Revenue billion Forecast, by Country 2020 & 2033
- Table 16: Global Air Switchgear Industry Revenue billion Forecast, by Voltage Level 2020 & 2033
- Table 17: Global Air Switchgear Industry Revenue billion Forecast, by End-User 2020 & 2033
- Table 18: Global Air Switchgear Industry Revenue billion Forecast, by Country 2020 & 2033
Frequently Asked Questions
1. What is the projected Compound Annual Growth Rate (CAGR) of the Air Switchgear Industry?
The projected CAGR is approximately 7.71%.
2. Which companies are prominent players in the Air Switchgear Industry?
Key companies in the market include Elatec Power Distribution GmbH, ABB Ltd, Alfanar Group, Larsen & Toubro Limited, Mitsubishi Electric Corporation, Siemens AG, Schneider Electric SE, Eaton Corporation PLC, Wenzhou Unisun Electric Co Ltd, Tavrida Electric*List Not Exhaustive.
3. What are the main segments of the Air Switchgear Industry?
The market segments include Voltage Level, End-User.
4. Can you provide details about the market size?
The market size is estimated to be USD 93.83 billion as of 2022.
5. What are some drivers contributing to market growth?
4.; Increasing Integration Of Renewable Energy Generation4.; Aging Power Grids And Investments In Transmission And Distribution Infrastructure.
6. What are the notable trends driving market growth?
Power Utilities Segment to Witness Significant Demand.
7. Are there any restraints impacting market growth?
4.; Lack Of Investor Confidence Due To Sociopolitical Instability In Some Countries.
8. Can you provide examples of recent developments in the market?
In August 2021, Schneider Electric launched GenieEvo Connected, a comprehensive, reliable switchgear range with unparalleled connectivity for asset health monitoring. GenieEvo connected, setting a new standard for primary air-insulated switchgear completely with 24/7 cloud-based service for efficient maintenance.
9. What pricing options are available for accessing the report?
Pricing options include single-user, multi-user, and enterprise licenses priced at USD 4750, USD 5250, and USD 8750 respectively.
10. Is the market size provided in terms of value or volume?
The market size is provided in terms of value, measured in billion.
11. Are there any specific market keywords associated with the report?
Yes, the market keyword associated with the report is "Air Switchgear Industry," which aids in identifying and referencing the specific market segment covered.
12. How do I determine which pricing option suits my needs best?
The pricing options vary based on user requirements and access needs. Individual users may opt for single-user licenses, while businesses requiring broader access may choose multi-user or enterprise licenses for cost-effective access to the report.
13. Are there any additional resources or data provided in the Air Switchgear Industry report?
While the report offers comprehensive insights, it's advisable to review the specific contents or supplementary materials provided to ascertain if additional resources or data are available.
14. How can I stay updated on further developments or reports in the Air Switchgear Industry?
To stay informed about further developments, trends, and reports in the Air Switchgear Industry, consider subscribing to industry newsletters, following relevant companies and organizations, or regularly checking reputable industry news sources and publications.
Methodology
Step 1 - Identification of Relevant Samples Size from Population Database


Step 2 - Approaches for Defining Global Market Size (Value, Volume* & Price*)

Note*: In applicable scenarios
Step 3 - Data Sources
Primary Research
- Web Analytics
- Survey Reports
- Research Institute
- Latest Research Reports
- Opinion Leaders
Secondary Research
- Annual Reports
- White Paper
- Latest Press Release
- Industry Association
- Paid Database
- Investor Presentations

Step 4 - Data Triangulation
Involves using different sources of information in order to increase the validity of a study
These sources are likely to be stakeholders in a program - participants, other researchers, program staff, other community members, and so on.
Then we put all data in single framework & apply various statistical tools to find out the dynamic on the market.
During the analysis stage, feedback from the stakeholder groups would be compared to determine areas of agreement as well as areas of divergence