
Key Insights
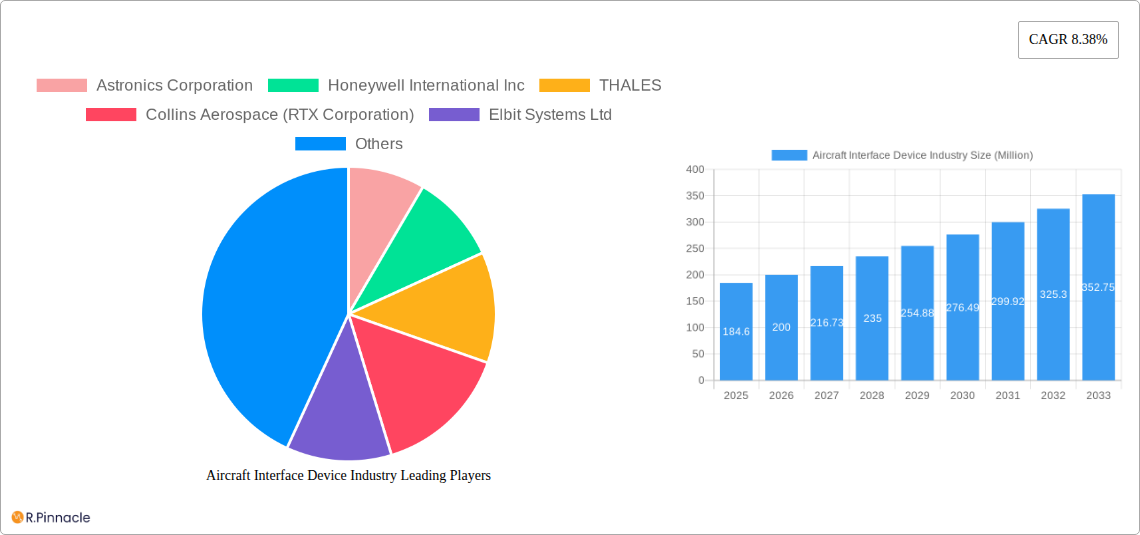
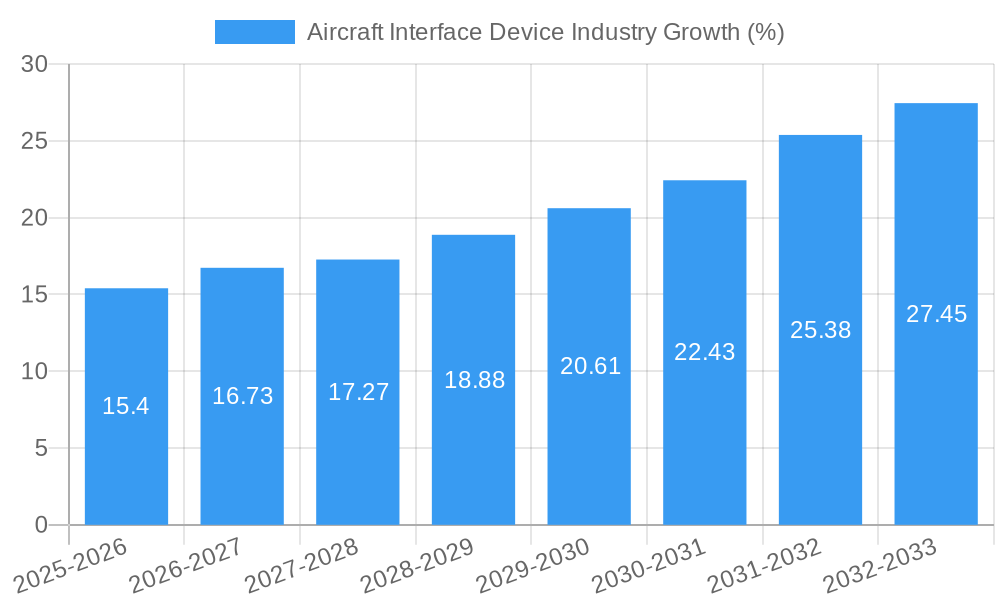
The Aircraft Interface Device (AID) market is experiencing robust growth, projected to reach \$184.60 million in 2025 and maintain a healthy Compound Annual Growth Rate (CAGR) of 8.38% from 2025 to 2033. This expansion is fueled by several key factors. The increasing demand for advanced in-flight connectivity, driven by passenger expectations for seamless communication and entertainment, is a major driver. Furthermore, the ongoing modernization and technological upgrades within both commercial and military aviation sectors are significantly contributing to market growth. Stringent safety regulations and the need for reliable data transmission between aircraft systems are also bolstering adoption. Growth is segmented across various applications, with the commercial aviation sector leading the way due to the high volume of passenger aircraft in operation and the continuous integration of new technologies. Military applications also represent a significant market segment, driven by the need for secure and reliable communication systems in defense operations. The General Aviation segment, while smaller, is showing steady growth due to increasing private jet usage. Competition in the AID market is intense, with established players like Astronics Corporation, Honeywell International Inc, Thales, and Collins Aerospace competing with emerging companies. Geographical expansion, particularly in the Asia-Pacific region due to rapid growth in air travel and infrastructure development, is expected to further drive market expansion.
The forecast period (2025-2033) anticipates continued growth, primarily driven by technological advancements in AID design, leading to improved performance, reduced weight, and enhanced reliability. Increased integration with other onboard systems and the development of next-generation aircraft will continue to create significant opportunities for market expansion. However, challenges remain, such as the high initial investment cost associated with the implementation of new AID systems and potential supply chain disruptions. Nevertheless, the overall market outlook for Aircraft Interface Devices remains positive, indicating substantial growth potential for industry players. The continuous focus on improving passenger experience, coupled with advancements in aviation technology, will underpin the long-term expansion of this vital market segment.
Aircraft Interface Device Industry Report: 2019-2033
This comprehensive report provides an in-depth analysis of the Aircraft Interface Device industry, offering valuable insights for industry professionals, investors, and strategic decision-makers. The report covers the period from 2019 to 2033, with a focus on the forecast period 2025-2033 and a base year of 2025. The global market is projected to reach xx Million by 2033, exhibiting a robust CAGR of xx% during the forecast period.
Aircraft Interface Device Industry Market Structure & Innovation Trends
The Aircraft Interface Device market is moderately concentrated, with key players like Astronics Corporation, Honeywell International Inc, THALES, Collins Aerospace (RTX Corporation), Elbit Systems Ltd, and others holding significant market share. The combined market share of the top five players is estimated at xx%. Innovation is driven by the need for enhanced data connectivity, improved security, and the integration of advanced technologies like IoT and AI. Regulatory frameworks, particularly those related to aviation safety and data security, significantly influence market dynamics. Product substitutes are limited, primarily due to stringent safety and certification requirements. The end-user demographics encompass commercial airlines, military forces, and general aviation operators. M&A activity has been moderate, with deal values totaling approximately xx Million in the last five years. Examples include [Insert specific M&A examples if available, otherwise omit this sentence].
Aircraft Interface Device Industry Market Dynamics & Trends
The Aircraft Interface Device market is experiencing significant growth driven by several factors. The increasing demand for real-time data analytics for improved flight operations and maintenance is a key driver. Technological disruptions, particularly the advancement of high-speed data communication technologies (e.g., 5G), are fueling innovation. Consumer preferences for enhanced passenger connectivity and improved in-flight entertainment systems are also driving demand. Competitive dynamics are characterized by ongoing product innovation, strategic partnerships, and a focus on delivering comprehensive solutions that integrate seamlessly with existing aircraft systems. Market penetration of advanced interface devices is increasing steadily, projected to reach xx% by 2033.
Dominant Regions & Segments in Aircraft Interface Device Industry
The Commercial aviation segment dominates the Aircraft Interface Device market, accounting for approximately xx% of the total market value in 2025.
- Key Drivers for Commercial Aviation Dominance:
- Strong growth in air passenger traffic.
- Increasing adoption of data-driven operations and predictive maintenance.
- Stringent regulatory requirements for flight data recording and transmission.
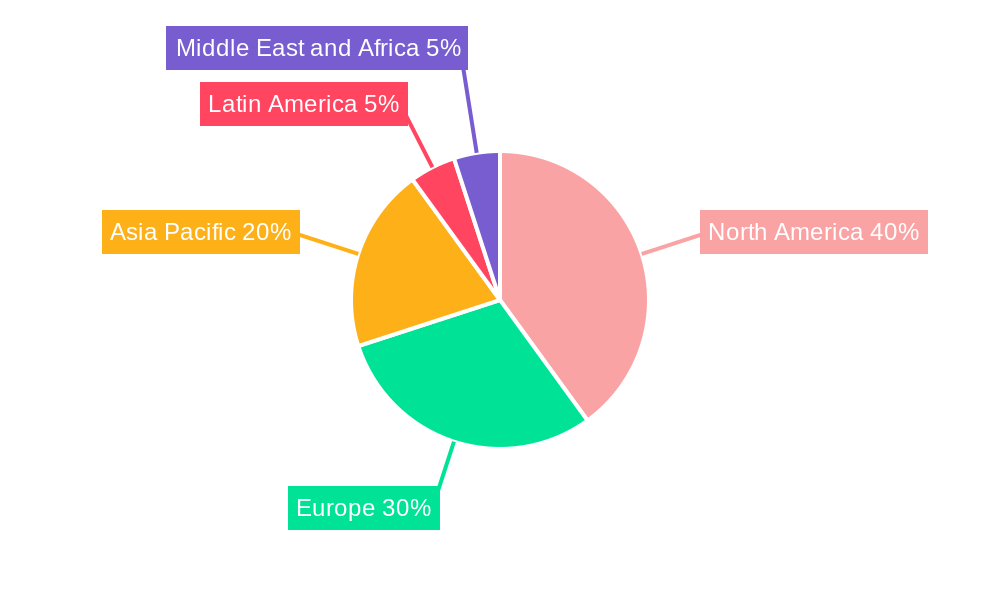
The North American region holds the largest market share, driven by a robust commercial aviation sector and significant investment in aerospace technologies. Europe follows closely, with a strong presence of both commercial and military aviation activities.
- Key Drivers for North American Dominance:
- Large fleet of commercial aircraft.
- High adoption rate of advanced technologies.
- Strong government support for aerospace industry development.
Detailed analysis reveals that the United States is the leading country within North America due to factors like a large number of commercial airlines, strong technological capabilities, and significant defense spending.
Aircraft Interface Device Industry Product Innovations
Recent innovations focus on miniaturization, enhanced data security, and improved integration with existing aircraft systems. Wireless connectivity, cloud-based data management, and improved user interfaces are key features of latest-generation products. These advancements aim to improve data transmission speeds, security, and the overall user experience, thereby providing a clear competitive advantage in the market.
Report Scope & Segmentation Analysis
The report segments the Aircraft Interface Device market by application:
Commercial: This segment is characterized by high volume sales and focus on cost-effectiveness. Growth is driven by increasing fleet sizes and demand for enhanced connectivity. Competitive landscape is intense. Market size is projected to reach xx Million by 2033.
Military: This segment focuses on high-reliability, security, and ruggedized products. Growth is tied to military spending and modernization programs. Competitive dynamics center around technological superiority and contract awards. Market size is projected to reach xx Million by 2033.
General Aviation: This segment prioritizes cost efficiency and ease of integration with smaller aircraft. Growth is moderate but steady. The competitive landscape is less concentrated. Market size is projected to reach xx Million by 2033.
Key Drivers of Aircraft Interface Device Industry Growth
Technological advancements, notably in data communication and processing, are key growth drivers. The increasing need for real-time data analysis for improved operational efficiency and predictive maintenance fuels market expansion. Favorable economic conditions and rising air passenger traffic further contribute to market growth. Stringent regulatory requirements for flight data recording and security also drive adoption of these devices.
Challenges in the Aircraft Interface Device Industry Sector
Regulatory compliance, including stringent safety certifications and data privacy regulations, presents a significant challenge. Supply chain disruptions and fluctuating raw material costs impact profitability. Intense competition from established players and emerging entrants creates pricing pressure and demands continuous innovation. These factors collectively limit market expansion and affect profit margins.
Emerging Opportunities in Aircraft Interface Device Industry
The integration of IoT and AI technologies offers substantial opportunities for advanced data analytics and predictive maintenance. The increasing adoption of cloud-based data management platforms enhances operational efficiency. Expansion into new markets, particularly in emerging economies, provides considerable growth potential. Focus on developing lightweight, energy-efficient, and cost-effective devices also creates opportunities.
Leading Players in the Aircraft Interface Device Industry Market
- Astronics Corporation
- Honeywell International Inc
- THALES
- Collins Aerospace (RTX Corporation)
- Elbit Systems Ltd
- SCI Technology Inc
- Teledyne Technologies Incorporated
- Anuvu
- SKYTRAC Systems Ltd
- ViaSat Inc
- Avionics Interface Technologies
Key Developments in Aircraft Interface Device Industry Industry
August 2023: FLYHT Aerospace Solutions LLC secured a five-year contract extension for software services related to Boeing B777 and B767 fleets. This highlights the growing demand for ongoing software support and data management services within the industry.
May 2023: RTX Corporation announced the installation of Collins Aerospace's InteliSight aircraft interface device on over 200 JetBlue Airways aircraft. This significant deployment showcases the growing adoption of advanced interface devices for real-time data access and improved operational efficiency. It signifies a major step towards cloud-based data management in commercial aviation.
Future Outlook for Aircraft Interface Device Industry Market
The Aircraft Interface Device market is poised for continued growth, fueled by technological advancements, increasing demand for data-driven operations, and expansion into new applications. Strategic partnerships and collaborations among industry players will further drive innovation and market expansion. The focus on enhanced data security, improved connectivity, and the development of cost-effective solutions will shape the future of this dynamic market.
Aircraft Interface Device Industry Segmentation
-
1. Application
- 1.1. Commercial
- 1.2. Military
- 1.3. General Aviation
Aircraft Interface Device Industry Segmentation By Geography
-
1. North America
- 1.1. United States
- 1.2. Canada
-
2. Europe
- 2.1. United Kingdom
- 2.2. Germany
- 2.3. France
- 2.4. Italy
- 2.5. Rest of Europe
-
3. Asia Pacific
- 3.1. China
- 3.2. Japan
- 3.3. India
- 3.4. South Korea
- 3.5. Rest of Asia Pacific
-
4. Latin America
- 4.1. Brazil
- 4.2. Mexico
- 4.3. Rest of Latin America
-
5. Middle East and Africa
- 5.1. United Arab Emirates
- 5.2. Saudi Arabia
- 5.3. Egypt
- 5.4. Qatar
- 5.5. Rest of Middle East and Africa
Aircraft Interface Device Industry REPORT HIGHLIGHTS
| Aspects | Details |
|---|---|
| Study Period | 2019-2033 |
| Base Year | 2024 |
| Estimated Year | 2025 |
| Forecast Period | 2025-2033 |
| Historical Period | 2019-2024 |
| Growth Rate | CAGR of 8.38% from 2019-2033 |
| Segmentation |
|
Table of Contents
- 1. Introduction
- 1.1. Research Scope
- 1.2. Market Segmentation
- 1.3. Research Methodology
- 1.4. Definitions and Assumptions
- 2. Executive Summary
- 2.1. Introduction
- 3. Market Dynamics
- 3.1. Introduction
- 3.2. Market Drivers
- 3.3. Market Restrains
- 3.4. Market Trends
- 3.4.1. Commercial Aircraft Segment to have the Largest Market Share During the Forecast Period
- 4. Market Factor Analysis
- 4.1. Porters Five Forces
- 4.2. Supply/Value Chain
- 4.3. PESTEL analysis
- 4.4. Market Entropy
- 4.5. Patent/Trademark Analysis
- 5. Global Aircraft Interface Device Industry Analysis, Insights and Forecast, 2019-2031
- 5.1. Market Analysis, Insights and Forecast - by Application
- 5.1.1. Commercial
- 5.1.2. Military
- 5.1.3. General Aviation
- 5.2. Market Analysis, Insights and Forecast - by Region
- 5.2.1. North America
- 5.2.2. Europe
- 5.2.3. Asia Pacific
- 5.2.4. Latin America
- 5.2.5. Middle East and Africa
- 5.1. Market Analysis, Insights and Forecast - by Application
- 6. North America Aircraft Interface Device Industry Analysis, Insights and Forecast, 2019-2031
- 6.1. Market Analysis, Insights and Forecast - by Application
- 6.1.1. Commercial
- 6.1.2. Military
- 6.1.3. General Aviation
- 6.1. Market Analysis, Insights and Forecast - by Application
- 7. Europe Aircraft Interface Device Industry Analysis, Insights and Forecast, 2019-2031
- 7.1. Market Analysis, Insights and Forecast - by Application
- 7.1.1. Commercial
- 7.1.2. Military
- 7.1.3. General Aviation
- 7.1. Market Analysis, Insights and Forecast - by Application
- 8. Asia Pacific Aircraft Interface Device Industry Analysis, Insights and Forecast, 2019-2031
- 8.1. Market Analysis, Insights and Forecast - by Application
- 8.1.1. Commercial
- 8.1.2. Military
- 8.1.3. General Aviation
- 8.1. Market Analysis, Insights and Forecast - by Application
- 9. Latin America Aircraft Interface Device Industry Analysis, Insights and Forecast, 2019-2031
- 9.1. Market Analysis, Insights and Forecast - by Application
- 9.1.1. Commercial
- 9.1.2. Military
- 9.1.3. General Aviation
- 9.1. Market Analysis, Insights and Forecast - by Application
- 10. Middle East and Africa Aircraft Interface Device Industry Analysis, Insights and Forecast, 2019-2031
- 10.1. Market Analysis, Insights and Forecast - by Application
- 10.1.1. Commercial
- 10.1.2. Military
- 10.1.3. General Aviation
- 10.1. Market Analysis, Insights and Forecast - by Application
- 11. North America Aircraft Interface Device Industry Analysis, Insights and Forecast, 2019-2031
- 11.1. Market Analysis, Insights and Forecast - By Country/Sub-region
- 11.1.1 United States
- 11.1.2 Canada
- 12. Europe Aircraft Interface Device Industry Analysis, Insights and Forecast, 2019-2031
- 12.1. Market Analysis, Insights and Forecast - By Country/Sub-region
- 12.1.1 United Kingdom
- 12.1.2 Germany
- 12.1.3 France
- 12.1.4 Italy
- 12.1.5 Rest of Europe
- 13. Asia Pacific Aircraft Interface Device Industry Analysis, Insights and Forecast, 2019-2031
- 13.1. Market Analysis, Insights and Forecast - By Country/Sub-region
- 13.1.1 China
- 13.1.2 Japan
- 13.1.3 India
- 13.1.4 South Korea
- 13.1.5 Rest of Asia Pacific
- 14. Latin America Aircraft Interface Device Industry Analysis, Insights and Forecast, 2019-2031
- 14.1. Market Analysis, Insights and Forecast - By Country/Sub-region
- 14.1.1 Brazil
- 14.1.2 Mexico
- 14.1.3 Rest of Latin America
- 15. Middle East and Africa Aircraft Interface Device Industry Analysis, Insights and Forecast, 2019-2031
- 15.1. Market Analysis, Insights and Forecast - By Country/Sub-region
- 15.1.1 United Arab Emirates
- 15.1.2 Saudi Arabia
- 15.1.3 Egypt
- 15.1.4 Qatar
- 15.1.5 Rest of Middle East and Africa
- 16. Competitive Analysis
- 16.1. Global Market Share Analysis 2024
- 16.2. Company Profiles
- 16.2.1 Astronics Corporation
- 16.2.1.1. Overview
- 16.2.1.2. Products
- 16.2.1.3. SWOT Analysis
- 16.2.1.4. Recent Developments
- 16.2.1.5. Financials (Based on Availability)
- 16.2.2 Honeywell International Inc
- 16.2.2.1. Overview
- 16.2.2.2. Products
- 16.2.2.3. SWOT Analysis
- 16.2.2.4. Recent Developments
- 16.2.2.5. Financials (Based on Availability)
- 16.2.3 THALES
- 16.2.3.1. Overview
- 16.2.3.2. Products
- 16.2.3.3. SWOT Analysis
- 16.2.3.4. Recent Developments
- 16.2.3.5. Financials (Based on Availability)
- 16.2.4 Collins Aerospace (RTX Corporation)
- 16.2.4.1. Overview
- 16.2.4.2. Products
- 16.2.4.3. SWOT Analysis
- 16.2.4.4. Recent Developments
- 16.2.4.5. Financials (Based on Availability)
- 16.2.5 Elbit Systems Ltd
- 16.2.5.1. Overview
- 16.2.5.2. Products
- 16.2.5.3. SWOT Analysis
- 16.2.5.4. Recent Developments
- 16.2.5.5. Financials (Based on Availability)
- 16.2.6 SCI Technology Inc
- 16.2.6.1. Overview
- 16.2.6.2. Products
- 16.2.6.3. SWOT Analysis
- 16.2.6.4. Recent Developments
- 16.2.6.5. Financials (Based on Availability)
- 16.2.7 Teledyne Technologies Incorporated
- 16.2.7.1. Overview
- 16.2.7.2. Products
- 16.2.7.3. SWOT Analysis
- 16.2.7.4. Recent Developments
- 16.2.7.5. Financials (Based on Availability)
- 16.2.8 Anuvu
- 16.2.8.1. Overview
- 16.2.8.2. Products
- 16.2.8.3. SWOT Analysis
- 16.2.8.4. Recent Developments
- 16.2.8.5. Financials (Based on Availability)
- 16.2.9 SKYTRAC Systems Ltd
- 16.2.9.1. Overview
- 16.2.9.2. Products
- 16.2.9.3. SWOT Analysis
- 16.2.9.4. Recent Developments
- 16.2.9.5. Financials (Based on Availability)
- 16.2.10 ViaSat Inc
- 16.2.10.1. Overview
- 16.2.10.2. Products
- 16.2.10.3. SWOT Analysis
- 16.2.10.4. Recent Developments
- 16.2.10.5. Financials (Based on Availability)
- 16.2.11 Avionics Interface Technologies
- 16.2.11.1. Overview
- 16.2.11.2. Products
- 16.2.11.3. SWOT Analysis
- 16.2.11.4. Recent Developments
- 16.2.11.5. Financials (Based on Availability)
- 16.2.1 Astronics Corporation
List of Figures
- Figure 1: Global Aircraft Interface Device Industry Revenue Breakdown (Million, %) by Region 2024 & 2032
- Figure 2: North America Aircraft Interface Device Industry Revenue (Million), by Country 2024 & 2032
- Figure 3: North America Aircraft Interface Device Industry Revenue Share (%), by Country 2024 & 2032
- Figure 4: Europe Aircraft Interface Device Industry Revenue (Million), by Country 2024 & 2032
- Figure 5: Europe Aircraft Interface Device Industry Revenue Share (%), by Country 2024 & 2032
- Figure 6: Asia Pacific Aircraft Interface Device Industry Revenue (Million), by Country 2024 & 2032
- Figure 7: Asia Pacific Aircraft Interface Device Industry Revenue Share (%), by Country 2024 & 2032
- Figure 8: Latin America Aircraft Interface Device Industry Revenue (Million), by Country 2024 & 2032
- Figure 9: Latin America Aircraft Interface Device Industry Revenue Share (%), by Country 2024 & 2032
- Figure 10: Middle East and Africa Aircraft Interface Device Industry Revenue (Million), by Country 2024 & 2032
- Figure 11: Middle East and Africa Aircraft Interface Device Industry Revenue Share (%), by Country 2024 & 2032
- Figure 12: North America Aircraft Interface Device Industry Revenue (Million), by Application 2024 & 2032
- Figure 13: North America Aircraft Interface Device Industry Revenue Share (%), by Application 2024 & 2032
- Figure 14: North America Aircraft Interface Device Industry Revenue (Million), by Country 2024 & 2032
- Figure 15: North America Aircraft Interface Device Industry Revenue Share (%), by Country 2024 & 2032
- Figure 16: Europe Aircraft Interface Device Industry Revenue (Million), by Application 2024 & 2032
- Figure 17: Europe Aircraft Interface Device Industry Revenue Share (%), by Application 2024 & 2032
- Figure 18: Europe Aircraft Interface Device Industry Revenue (Million), by Country 2024 & 2032
- Figure 19: Europe Aircraft Interface Device Industry Revenue Share (%), by Country 2024 & 2032
- Figure 20: Asia Pacific Aircraft Interface Device Industry Revenue (Million), by Application 2024 & 2032
- Figure 21: Asia Pacific Aircraft Interface Device Industry Revenue Share (%), by Application 2024 & 2032
- Figure 22: Asia Pacific Aircraft Interface Device Industry Revenue (Million), by Country 2024 & 2032
- Figure 23: Asia Pacific Aircraft Interface Device Industry Revenue Share (%), by Country 2024 & 2032
- Figure 24: Latin America Aircraft Interface Device Industry Revenue (Million), by Application 2024 & 2032
- Figure 25: Latin America Aircraft Interface Device Industry Revenue Share (%), by Application 2024 & 2032
- Figure 26: Latin America Aircraft Interface Device Industry Revenue (Million), by Country 2024 & 2032
- Figure 27: Latin America Aircraft Interface Device Industry Revenue Share (%), by Country 2024 & 2032
- Figure 28: Middle East and Africa Aircraft Interface Device Industry Revenue (Million), by Application 2024 & 2032
- Figure 29: Middle East and Africa Aircraft Interface Device Industry Revenue Share (%), by Application 2024 & 2032
- Figure 30: Middle East and Africa Aircraft Interface Device Industry Revenue (Million), by Country 2024 & 2032
- Figure 31: Middle East and Africa Aircraft Interface Device Industry Revenue Share (%), by Country 2024 & 2032
List of Tables
- Table 1: Global Aircraft Interface Device Industry Revenue Million Forecast, by Region 2019 & 2032
- Table 2: Global Aircraft Interface Device Industry Revenue Million Forecast, by Application 2019 & 2032
- Table 3: Global Aircraft Interface Device Industry Revenue Million Forecast, by Region 2019 & 2032
- Table 4: Global Aircraft Interface Device Industry Revenue Million Forecast, by Country 2019 & 2032
- Table 5: United States Aircraft Interface Device Industry Revenue (Million) Forecast, by Application 2019 & 2032
- Table 6: Canada Aircraft Interface Device Industry Revenue (Million) Forecast, by Application 2019 & 2032
- Table 7: Global Aircraft Interface Device Industry Revenue Million Forecast, by Country 2019 & 2032
- Table 8: United Kingdom Aircraft Interface Device Industry Revenue (Million) Forecast, by Application 2019 & 2032
- Table 9: Germany Aircraft Interface Device Industry Revenue (Million) Forecast, by Application 2019 & 2032
- Table 10: France Aircraft Interface Device Industry Revenue (Million) Forecast, by Application 2019 & 2032
- Table 11: Italy Aircraft Interface Device Industry Revenue (Million) Forecast, by Application 2019 & 2032
- Table 12: Rest of Europe Aircraft Interface Device Industry Revenue (Million) Forecast, by Application 2019 & 2032
- Table 13: Global Aircraft Interface Device Industry Revenue Million Forecast, by Country 2019 & 2032
- Table 14: China Aircraft Interface Device Industry Revenue (Million) Forecast, by Application 2019 & 2032
- Table 15: Japan Aircraft Interface Device Industry Revenue (Million) Forecast, by Application 2019 & 2032
- Table 16: India Aircraft Interface Device Industry Revenue (Million) Forecast, by Application 2019 & 2032
- Table 17: South Korea Aircraft Interface Device Industry Revenue (Million) Forecast, by Application 2019 & 2032
- Table 18: Rest of Asia Pacific Aircraft Interface Device Industry Revenue (Million) Forecast, by Application 2019 & 2032
- Table 19: Global Aircraft Interface Device Industry Revenue Million Forecast, by Country 2019 & 2032
- Table 20: Brazil Aircraft Interface Device Industry Revenue (Million) Forecast, by Application 2019 & 2032
- Table 21: Mexico Aircraft Interface Device Industry Revenue (Million) Forecast, by Application 2019 & 2032
- Table 22: Rest of Latin America Aircraft Interface Device Industry Revenue (Million) Forecast, by Application 2019 & 2032
- Table 23: Global Aircraft Interface Device Industry Revenue Million Forecast, by Country 2019 & 2032
- Table 24: United Arab Emirates Aircraft Interface Device Industry Revenue (Million) Forecast, by Application 2019 & 2032
- Table 25: Saudi Arabia Aircraft Interface Device Industry Revenue (Million) Forecast, by Application 2019 & 2032
- Table 26: Egypt Aircraft Interface Device Industry Revenue (Million) Forecast, by Application 2019 & 2032
- Table 27: Qatar Aircraft Interface Device Industry Revenue (Million) Forecast, by Application 2019 & 2032
- Table 28: Rest of Middle East and Africa Aircraft Interface Device Industry Revenue (Million) Forecast, by Application 2019 & 2032
- Table 29: Global Aircraft Interface Device Industry Revenue Million Forecast, by Application 2019 & 2032
- Table 30: Global Aircraft Interface Device Industry Revenue Million Forecast, by Country 2019 & 2032
- Table 31: United States Aircraft Interface Device Industry Revenue (Million) Forecast, by Application 2019 & 2032
- Table 32: Canada Aircraft Interface Device Industry Revenue (Million) Forecast, by Application 2019 & 2032
- Table 33: Global Aircraft Interface Device Industry Revenue Million Forecast, by Application 2019 & 2032
- Table 34: Global Aircraft Interface Device Industry Revenue Million Forecast, by Country 2019 & 2032
- Table 35: United Kingdom Aircraft Interface Device Industry Revenue (Million) Forecast, by Application 2019 & 2032
- Table 36: Germany Aircraft Interface Device Industry Revenue (Million) Forecast, by Application 2019 & 2032
- Table 37: France Aircraft Interface Device Industry Revenue (Million) Forecast, by Application 2019 & 2032
- Table 38: Italy Aircraft Interface Device Industry Revenue (Million) Forecast, by Application 2019 & 2032
- Table 39: Rest of Europe Aircraft Interface Device Industry Revenue (Million) Forecast, by Application 2019 & 2032
- Table 40: Global Aircraft Interface Device Industry Revenue Million Forecast, by Application 2019 & 2032
- Table 41: Global Aircraft Interface Device Industry Revenue Million Forecast, by Country 2019 & 2032
- Table 42: China Aircraft Interface Device Industry Revenue (Million) Forecast, by Application 2019 & 2032
- Table 43: Japan Aircraft Interface Device Industry Revenue (Million) Forecast, by Application 2019 & 2032
- Table 44: India Aircraft Interface Device Industry Revenue (Million) Forecast, by Application 2019 & 2032
- Table 45: South Korea Aircraft Interface Device Industry Revenue (Million) Forecast, by Application 2019 & 2032
- Table 46: Rest of Asia Pacific Aircraft Interface Device Industry Revenue (Million) Forecast, by Application 2019 & 2032
- Table 47: Global Aircraft Interface Device Industry Revenue Million Forecast, by Application 2019 & 2032
- Table 48: Global Aircraft Interface Device Industry Revenue Million Forecast, by Country 2019 & 2032
- Table 49: Brazil Aircraft Interface Device Industry Revenue (Million) Forecast, by Application 2019 & 2032
- Table 50: Mexico Aircraft Interface Device Industry Revenue (Million) Forecast, by Application 2019 & 2032
- Table 51: Rest of Latin America Aircraft Interface Device Industry Revenue (Million) Forecast, by Application 2019 & 2032
- Table 52: Global Aircraft Interface Device Industry Revenue Million Forecast, by Application 2019 & 2032
- Table 53: Global Aircraft Interface Device Industry Revenue Million Forecast, by Country 2019 & 2032
- Table 54: United Arab Emirates Aircraft Interface Device Industry Revenue (Million) Forecast, by Application 2019 & 2032
- Table 55: Saudi Arabia Aircraft Interface Device Industry Revenue (Million) Forecast, by Application 2019 & 2032
- Table 56: Egypt Aircraft Interface Device Industry Revenue (Million) Forecast, by Application 2019 & 2032
- Table 57: Qatar Aircraft Interface Device Industry Revenue (Million) Forecast, by Application 2019 & 2032
- Table 58: Rest of Middle East and Africa Aircraft Interface Device Industry Revenue (Million) Forecast, by Application 2019 & 2032
Frequently Asked Questions
1. What is the projected Compound Annual Growth Rate (CAGR) of the Aircraft Interface Device Industry?
The projected CAGR is approximately 8.38%.
2. Which companies are prominent players in the Aircraft Interface Device Industry?
Key companies in the market include Astronics Corporation, Honeywell International Inc, THALES, Collins Aerospace (RTX Corporation), Elbit Systems Ltd, SCI Technology Inc, Teledyne Technologies Incorporated, Anuvu, SKYTRAC Systems Ltd, ViaSat Inc, Avionics Interface Technologies.
3. What are the main segments of the Aircraft Interface Device Industry?
The market segments include Application.
4. Can you provide details about the market size?
The market size is estimated to be USD 184.60 Million as of 2022.
5. What are some drivers contributing to market growth?
N/A
6. What are the notable trends driving market growth?
Commercial Aircraft Segment to have the Largest Market Share During the Forecast Period.
7. Are there any restraints impacting market growth?
N/A
8. Can you provide examples of recent developments in the market?
August 2023: FLYHT Aerospace Solutions LLC announced that it had signed a five-year contract extension with one of its long-term aircraft lease customers to provide ongoing software services for its entire Boeing B777 and B767 fleets
9. What pricing options are available for accessing the report?
Pricing options include single-user, multi-user, and enterprise licenses priced at USD 4750, USD 5250, and USD 8750 respectively.
10. Is the market size provided in terms of value or volume?
The market size is provided in terms of value, measured in Million.
11. Are there any specific market keywords associated with the report?
Yes, the market keyword associated with the report is "Aircraft Interface Device Industry," which aids in identifying and referencing the specific market segment covered.
12. How do I determine which pricing option suits my needs best?
The pricing options vary based on user requirements and access needs. Individual users may opt for single-user licenses, while businesses requiring broader access may choose multi-user or enterprise licenses for cost-effective access to the report.
13. Are there any additional resources or data provided in the Aircraft Interface Device Industry report?
While the report offers comprehensive insights, it's advisable to review the specific contents or supplementary materials provided to ascertain if additional resources or data are available.
14. How can I stay updated on further developments or reports in the Aircraft Interface Device Industry?
To stay informed about further developments, trends, and reports in the Aircraft Interface Device Industry, consider subscribing to industry newsletters, following relevant companies and organizations, or regularly checking reputable industry news sources and publications.
Methodology
Step 1 - Identification of Relevant Samples Size from Population Database


Step 2 - Approaches for Defining Global Market Size (Value, Volume* & Price*)

Note*: In applicable scenarios
Step 3 - Data Sources
Primary Research
- Web Analytics
- Survey Reports
- Research Institute
- Latest Research Reports
- Opinion Leaders
Secondary Research
- Annual Reports
- White Paper
- Latest Press Release
- Industry Association
- Paid Database
- Investor Presentations

Step 4 - Data Triangulation
Involves using different sources of information in order to increase the validity of a study
These sources are likely to be stakeholders in a program - participants, other researchers, program staff, other community members, and so on.
Then we put all data in single framework & apply various statistical tools to find out the dynamic on the market.
During the analysis stage, feedback from the stakeholder groups would be compared to determine areas of agreement as well as areas of divergence


