

Key Insights
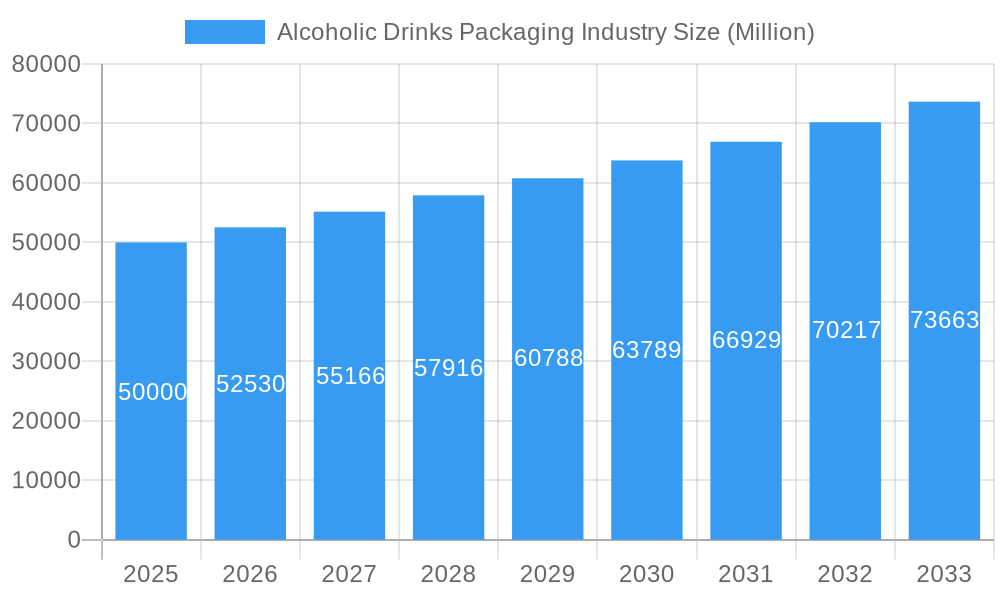
The global alcoholic beverage packaging market is poised for significant expansion, projected to reach $168.08 billion by 2033. This growth is underpinned by a robust Compound Annual Growth Rate (CAGR) of 5.05% from 2025 (base year) to 2033. Key market drivers include the rising consumer demand for convenient and sustainable packaging solutions, prompting manufacturers to adopt innovative materials such as lightweight plastics and eco-friendly paper-based alternatives. Shifting consumer preferences, especially among younger demographics, towards premium and craft alcoholic beverages are also fueling demand for aesthetically appealing and functional packaging designs. The expansion of e-commerce channels for alcohol sales further necessitates specialized packaging for secure and efficient delivery. While North America and Europe currently lead the market, the Asia Pacific region is anticipated to witness substantial growth driven by increasing disposable incomes and evolving consumption patterns. However, regulatory pressures concerning material composition and recyclability, coupled with volatile raw material prices, present challenges to sustained market growth. Analysis of market segmentation reveals that bottles and cans remain the dominant package types, with glass and metal materials favored for their perceived quality and product integrity preservation. Beer represents the largest product segment, followed by spirits and wine.
Alcoholic Drinks Packaging Industry Market Size (In Billion)
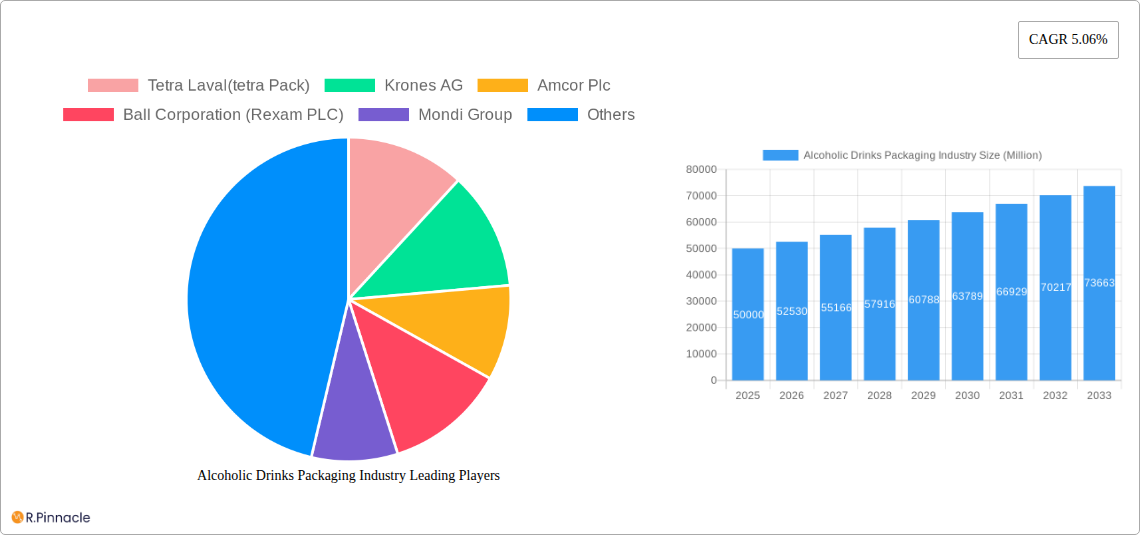
The competitive landscape of the alcoholic beverage packaging market is characterized by intense rivalry. Leading companies, including Tetra Laval, Krones AG, Amcor Plc, Ball Corporation, Mondi Group, Saint Gobain SA, and Sidel Inc., are continuously innovating to meet evolving consumer needs and stringent regulatory standards. Their strategic focus lies in developing sustainable and efficient packaging solutions, often incorporating tamper-evident seals and enhanced barrier properties to improve product safety and extend shelf life. Future market growth will depend on effectively addressing environmental concerns, leveraging technological advancements in packaging materials and design, and adapting to the dynamic regulatory environment. The industry is expected to see further consolidation through strategic partnerships and mergers & acquisitions. The forecast period from 2025 to 2033 presents considerable opportunities for companies adept at responding to these evolving trends and challenges.
Alcoholic Drinks Packaging Industry Company Market Share
This comprehensive report offers an in-depth analysis of the Alcoholic Drinks Packaging Industry, providing crucial insights for industry professionals, investors, and strategic planners. The study examines market structure, dynamics, key players, and future trends, projecting growth from 2019 to 2033. The analysis utilizes historical data from 2019-2024, with 2025 serving as the base year for projections spanning the 2025-2033 forecast period. The estimated global market size for 2025 is $168.08 billion.
Alcoholic Drinks Packaging Industry Market Structure & Innovation Trends
The alcoholic drinks packaging market exhibits moderate concentration, with several large players dominating alongside numerous smaller regional competitors. Key players include Tetra Laval (Tetra Pak), Krones AG, Amcor Plc, Ball Corporation (Rexam PLC), Mondi Group, Saint Gobain SA, Sidel Inc, and Crown Holdings Incorporated. Market share is dynamic, with ongoing M&A activity shaping the competitive landscape. In 2024, estimated M&A deal values totalled $XX Million, driven by the pursuit of economies of scale and expansion into new segments. Innovation is fueled by consumer demand for sustainable and convenient packaging, alongside stringent regulatory frameworks concerning material recyclability and waste reduction. Product substitutes, such as alternative closures and dispensing systems, are continually emerging, pushing companies to innovate. End-user demographics, particularly the growth of younger, environmentally conscious consumers, significantly impact packaging choices.
- Market Concentration: Moderate
- M&A Deal Value (2024): $XX Million
- Key Innovation Drivers: Sustainability, Convenience, Regulation
- Major Product Substitutes: Alternative Closures, Dispensing Systems
Alcoholic Drinks Packaging Industry Market Dynamics & Trends
The alcoholic drinks packaging market is experiencing robust growth, driven by increasing alcoholic beverage consumption globally, particularly in emerging economies. The Compound Annual Growth Rate (CAGR) during the forecast period (2025-2033) is projected at XX%. Technological disruptions, such as advancements in lightweighting materials, smart packaging, and improved printing technologies, are reshaping the industry. Consumer preferences for eco-friendly and aesthetically appealing packaging are further influencing market trends. Competitive dynamics are intense, with companies focusing on differentiation through innovation, cost-effectiveness, and sustainability initiatives. Market penetration of sustainable packaging materials like recycled plastic and plant-based alternatives is expected to increase significantly by XX% by 2033.
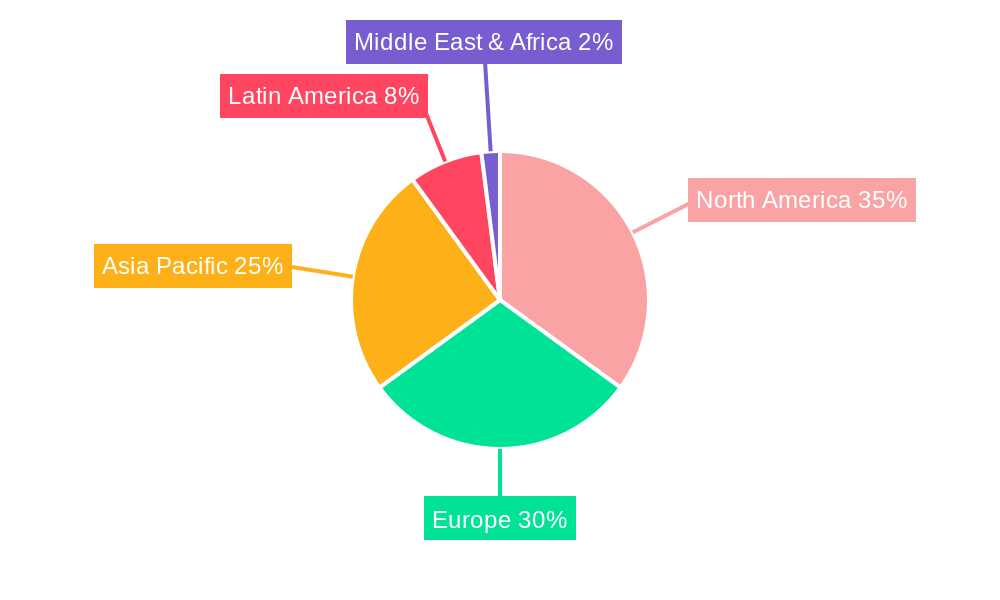
Dominant Regions & Segments in Alcoholic Drinks Packaging Industry
North America and Europe currently hold significant market share, driven by established alcoholic beverage industries and high per capita consumption. However, Asia-Pacific is poised for rapid growth, fueled by rising disposable incomes and changing consumer preferences.
By Package Type: Bottles maintain the largest market share, followed by metal cans and cartons.
By Product: Beer dominates the market, followed by wine and spirits.
By Material: Glass and metal remain dominant, although plastic and paper-based solutions are gaining traction due to sustainability concerns.
- Key Drivers (North America): Strong established beverage industry, high consumer spending.
- Key Drivers (Asia-Pacific): Rising disposable income, increasing urbanization.
- Key Drivers (Europe): Stringent environmental regulations, consumer focus on sustainability.
Alcoholic Drinks Packaging Industry Product Innovations
Recent innovations include lightweighting of bottles and cans to reduce transportation costs and environmental impact. Advances in printing technology enhance packaging aesthetics and brand communication. The introduction of smart packaging, incorporating features like tamper-evidence and product tracking, is gaining momentum. These innovations improve product shelf-life, enhance brand loyalty, and address growing consumer demands for traceability and authenticity.
Report Scope & Segmentation Analysis
This report provides a comprehensive segmentation analysis of the alcoholic drinks packaging market across package type (bottles, metal cans, cartons, jars, pouches, other), product type (beer, spirits, wine, other), and material type (plastic, paper, metal, glass, other). Each segment's growth projections, market size, and competitive dynamics are analyzed in detail. Growth projections vary significantly across segments, with sustainable packaging materials experiencing the highest anticipated growth rates.
Key Drivers of Alcoholic Drinks Packaging Industry Growth
Several factors drive market growth. Increasing alcoholic beverage consumption, particularly in emerging economies, fuels demand for packaging solutions. Technological advancements in material science, printing, and automation improve production efficiency and reduce costs. Stringent environmental regulations promoting sustainable packaging materials are also pushing market expansion. The growing popularity of e-commerce channels necessitates robust and protective packaging designs.
Challenges in the Alcoholic Drinks Packaging Industry Sector
The industry faces challenges like fluctuating raw material prices, particularly for plastics and metals, impacting production costs. Meeting increasingly stringent environmental regulations requires significant investment in sustainable packaging solutions. Intense competition among packaging providers requires continuous innovation and cost optimization to maintain market share. Supply chain disruptions, especially exacerbated in recent years, can severely impact production and delivery timelines.
Emerging Opportunities in Alcoholic Drinks Packaging Industry
The industry is witnessing significant opportunities in sustainable packaging materials such as biodegradable plastics and recycled content. Innovations in smart packaging technologies, such as tamper-evident seals and RFID tagging, enhance product security and traceability. Growth in e-commerce presents opportunities for customized packaging solutions for home delivery. Expanding into emerging markets offers significant untapped potential.
Leading Players in the Alcoholic Drinks Packaging Industry Market
- Tetra Laval (Tetra Pak)
- Krones AG
- Amcor Plc
- Ball Corporation (Rexam PLC)
- Mondi Group
- Saint Gobain SA
- Sidel Inc
- Crown Holdings Incorporated
Key Developments in Alcoholic Drinks Packaging Industry
- 2022 Q4: Amcor Plc launched a new range of sustainable packaging solutions for spirits.
- 2023 Q1: Tetra Pak partnered with a leading beverage company to develop a recyclable paper-based bottle.
- 2024 Q2: Ball Corporation acquired a smaller packaging company, expanding its market reach. (Further developments to be added)
Future Outlook for Alcoholic Drinks Packaging Industry Market
The alcoholic drinks packaging market is expected to witness continued growth, driven by increasing beverage consumption, the adoption of sustainable packaging, and the emergence of innovative packaging technologies. Strategic collaborations and mergers & acquisitions will further shape the competitive landscape. Companies focusing on sustainability, innovation, and operational efficiency are best positioned to capitalize on future growth opportunities.
Alcoholic Drinks Packaging Industry Segmentation
-
1. Material
- 1.1. Plastic
- 1.2. Paper
- 1.3. Metal
- 1.4. Glass
- 1.5. Other Materials
-
2. Package Type
- 2.1. Bottles
- 2.2. Metal Cans
- 2.3. Cartons
- 2.4. Jars
- 2.5. Pouches
- 2.6. Other Package Types
-
3. Product
- 3.1. Beer
- 3.2. Spirit
- 3.3. Wine
- 3.4. Other Products
Alcoholic Drinks Packaging Industry Segmentation By Geography
-
1. North America
- 1.1. United States
- 1.2. Canada
-
2. Europe
- 2.1. Germany
- 2.2. United Kingdom
- 2.3. France
- 2.4. Rest of Europe
-
3. Asia Pacific
- 3.1. China
- 3.2. Japan
- 3.3. India
- 3.4. Rest of Asia Pacific
-
4. Latin America
- 4.1. Brazil
- 4.2. Argentina
- 4.3. Mexico
- 4.4. Rest of Latin America
- 5. Middle East
-
6. UAE
- 6.1. South Africa
- 6.2. Rest of Middle East
Alcoholic Drinks Packaging Industry Regional Market Share
Geographic Coverage of Alcoholic Drinks Packaging Industry
Alcoholic Drinks Packaging Industry REPORT HIGHLIGHTS
| Aspects | Details |
|---|---|
| Study Period | 2020-2034 |
| Base Year | 2025 |
| Estimated Year | 2026 |
| Forecast Period | 2026-2034 |
| Historical Period | 2020-2025 |
| Growth Rate | CAGR of 5.05% from 2020-2034 |
| Segmentation |
|
Table of Contents
- 1. Introduction
- 1.1. Research Scope
- 1.2. Market Segmentation
- 1.3. Research Objective
- 1.4. Definitions and Assumptions
- 2. Executive Summary
- 2.1. Market Snapshot
- 3. Market Dynamics
- 3.1. Market Drivers
- 3.2. Market Restrains
- 3.3. Market Trends
- 3.4. Market Opportunities
- 4. Market Factor Analysis
- 4.1. Porters Five Forces
- 4.1.1. Bargaining Power of Suppliers
- 4.1.2. Bargaining Power of Buyers
- 4.1.3. Threat of New Entrants
- 4.1.4. Threat of Substitutes
- 4.1.5. Competitive Rivalry
- 4.2. PESTEL analysis
- 4.3. BCG Analysis
- 4.3.1. Stars (High Growth, High Market Share)
- 4.3.2. Cash Cows (Low Growth, High Market Share)
- 4.3.3. Question Mark (High Growth, Low Market Share)
- 4.3.4. Dogs (Low Growth, Low Market Share)
- 4.4. Ansoff Matrix Analysis
- 4.5. Supply Chain Analysis
- 4.6. Regulatory Landscape
- 4.7. Current Market Potential and Opportunity Assessment (TAM–SAM–SOM Framework)
- 4.8. PRI Analyst Note
- 4.1. Porters Five Forces
- 5. Market Analysis, Insights and Forecast 2021-2033
- 5.1. Market Analysis, Insights and Forecast - by Material
- 5.1.1. Plastic
- 5.1.2. Paper
- 5.1.3. Metal
- 5.1.4. Glass
- 5.1.5. Other Materials
- 5.2. Market Analysis, Insights and Forecast - by Package Type
- 5.2.1. Bottles
- 5.2.2. Metal Cans
- 5.2.3. Cartons
- 5.2.4. Jars
- 5.2.5. Pouches
- 5.2.6. Other Package Types
- 5.3. Market Analysis, Insights and Forecast - by Product
- 5.3.1. Beer
- 5.3.2. Spirit
- 5.3.3. Wine
- 5.3.4. Other Products
- 5.4. Market Analysis, Insights and Forecast - by Region
- 5.4.1. North America
- 5.4.2. Europe
- 5.4.3. Asia Pacific
- 5.4.4. Latin America
- 5.4.5. Middle East
- 5.4.6. UAE
- 5.1. Market Analysis, Insights and Forecast - by Material
- 6. Global Alcoholic Drinks Packaging Industry Analysis, Insights and Forecast, 2021-2033
- 6.1. Market Analysis, Insights and Forecast - by Material
- 6.1.1. Plastic
- 6.1.2. Paper
- 6.1.3. Metal
- 6.1.4. Glass
- 6.1.5. Other Materials
- 6.2. Market Analysis, Insights and Forecast - by Package Type
- 6.2.1. Bottles
- 6.2.2. Metal Cans
- 6.2.3. Cartons
- 6.2.4. Jars
- 6.2.5. Pouches
- 6.2.6. Other Package Types
- 6.3. Market Analysis, Insights and Forecast - by Product
- 6.3.1. Beer
- 6.3.2. Spirit
- 6.3.3. Wine
- 6.3.4. Other Products
- 6.1. Market Analysis, Insights and Forecast - by Material
- 7. North America Alcoholic Drinks Packaging Industry Analysis, Insights and Forecast, 2020-2032
- 7.1. Market Analysis, Insights and Forecast - by Material
- 7.1.1. Plastic
- 7.1.2. Paper
- 7.1.3. Metal
- 7.1.4. Glass
- 7.1.5. Other Materials
- 7.2. Market Analysis, Insights and Forecast - by Package Type
- 7.2.1. Bottles
- 7.2.2. Metal Cans
- 7.2.3. Cartons
- 7.2.4. Jars
- 7.2.5. Pouches
- 7.2.6. Other Package Types
- 7.3. Market Analysis, Insights and Forecast - by Product
- 7.3.1. Beer
- 7.3.2. Spirit
- 7.3.3. Wine
- 7.3.4. Other Products
- 7.1. Market Analysis, Insights and Forecast - by Material
- 8. Europe Alcoholic Drinks Packaging Industry Analysis, Insights and Forecast, 2020-2032
- 8.1. Market Analysis, Insights and Forecast - by Material
- 8.1.1. Plastic
- 8.1.2. Paper
- 8.1.3. Metal
- 8.1.4. Glass
- 8.1.5. Other Materials
- 8.2. Market Analysis, Insights and Forecast - by Package Type
- 8.2.1. Bottles
- 8.2.2. Metal Cans
- 8.2.3. Cartons
- 8.2.4. Jars
- 8.2.5. Pouches
- 8.2.6. Other Package Types
- 8.3. Market Analysis, Insights and Forecast - by Product
- 8.3.1. Beer
- 8.3.2. Spirit
- 8.3.3. Wine
- 8.3.4. Other Products
- 8.1. Market Analysis, Insights and Forecast - by Material
- 9. Asia Pacific Alcoholic Drinks Packaging Industry Analysis, Insights and Forecast, 2020-2032
- 9.1. Market Analysis, Insights and Forecast - by Material
- 9.1.1. Plastic
- 9.1.2. Paper
- 9.1.3. Metal
- 9.1.4. Glass
- 9.1.5. Other Materials
- 9.2. Market Analysis, Insights and Forecast - by Package Type
- 9.2.1. Bottles
- 9.2.2. Metal Cans
- 9.2.3. Cartons
- 9.2.4. Jars
- 9.2.5. Pouches
- 9.2.6. Other Package Types
- 9.3. Market Analysis, Insights and Forecast - by Product
- 9.3.1. Beer
- 9.3.2. Spirit
- 9.3.3. Wine
- 9.3.4. Other Products
- 9.1. Market Analysis, Insights and Forecast - by Material
- 10. Latin America Alcoholic Drinks Packaging Industry Analysis, Insights and Forecast, 2020-2032
- 10.1. Market Analysis, Insights and Forecast - by Material
- 10.1.1. Plastic
- 10.1.2. Paper
- 10.1.3. Metal
- 10.1.4. Glass
- 10.1.5. Other Materials
- 10.2. Market Analysis, Insights and Forecast - by Package Type
- 10.2.1. Bottles
- 10.2.2. Metal Cans
- 10.2.3. Cartons
- 10.2.4. Jars
- 10.2.5. Pouches
- 10.2.6. Other Package Types
- 10.3. Market Analysis, Insights and Forecast - by Product
- 10.3.1. Beer
- 10.3.2. Spirit
- 10.3.3. Wine
- 10.3.4. Other Products
- 10.1. Market Analysis, Insights and Forecast - by Material
- 11. Middle East Alcoholic Drinks Packaging Industry Analysis, Insights and Forecast, 2020-2032
- 11.1. Market Analysis, Insights and Forecast - by Material
- 11.1.1. Plastic
- 11.1.2. Paper
- 11.1.3. Metal
- 11.1.4. Glass
- 11.1.5. Other Materials
- 11.2. Market Analysis, Insights and Forecast - by Package Type
- 11.2.1. Bottles
- 11.2.2. Metal Cans
- 11.2.3. Cartons
- 11.2.4. Jars
- 11.2.5. Pouches
- 11.2.6. Other Package Types
- 11.3. Market Analysis, Insights and Forecast - by Product
- 11.3.1. Beer
- 11.3.2. Spirit
- 11.3.3. Wine
- 11.3.4. Other Products
- 11.1. Market Analysis, Insights and Forecast - by Material
- 12. UAE Alcoholic Drinks Packaging Industry Analysis, Insights and Forecast, 2020-2032
- 12.1. Market Analysis, Insights and Forecast - by Material
- 12.1.1. Plastic
- 12.1.2. Paper
- 12.1.3. Metal
- 12.1.4. Glass
- 12.1.5. Other Materials
- 12.2. Market Analysis, Insights and Forecast - by Package Type
- 12.2.1. Bottles
- 12.2.2. Metal Cans
- 12.2.3. Cartons
- 12.2.4. Jars
- 12.2.5. Pouches
- 12.2.6. Other Package Types
- 12.3. Market Analysis, Insights and Forecast - by Product
- 12.3.1. Beer
- 12.3.2. Spirit
- 12.3.3. Wine
- 12.3.4. Other Products
- 12.1. Market Analysis, Insights and Forecast - by Material
- 13. Competitive Analysis
- 13.1. Company Profiles
- 13.1.1 Tetra Laval(tetra Pack)
- 13.1.1.1. Company Overview
- 13.1.1.2. Products
- 13.1.1.3. Company Financials
- 13.1.1.4. SWOT Analysis
- 13.1.2 Krones AG
- 13.1.2.1. Company Overview
- 13.1.2.2. Products
- 13.1.2.3. Company Financials
- 13.1.2.4. SWOT Analysis
- 13.1.3 Amcor Plc
- 13.1.3.1. Company Overview
- 13.1.3.2. Products
- 13.1.3.3. Company Financials
- 13.1.3.4. SWOT Analysis
- 13.1.4 Ball Corporation (Rexam PLC)
- 13.1.4.1. Company Overview
- 13.1.4.2. Products
- 13.1.4.3. Company Financials
- 13.1.4.4. SWOT Analysis
- 13.1.5 Mondi Group
- 13.1.5.1. Company Overview
- 13.1.5.2. Products
- 13.1.5.3. Company Financials
- 13.1.5.4. SWOT Analysis
- 13.1.6 Saint Gobain SA
- 13.1.6.1. Company Overview
- 13.1.6.2. Products
- 13.1.6.3. Company Financials
- 13.1.6.4. SWOT Analysis
- 13.1.7 Sidel Inc *List Not Exhaustive
- 13.1.7.1. Company Overview
- 13.1.7.2. Products
- 13.1.7.3. Company Financials
- 13.1.7.4. SWOT Analysis
- 13.1.8 Crown Holdings Incorporated
- 13.1.8.1. Company Overview
- 13.1.8.2. Products
- 13.1.8.3. Company Financials
- 13.1.8.4. SWOT Analysis
- 13.1.1 Tetra Laval(tetra Pack)
- 13.2. Market Entropy
- 13.2.1 Company's Key Areas Served
- 13.2.2 Recent Developments
- 13.3. Company Market Share Analysis 2025
- 13.3.1 Top 5 Companies Market Share Analysis
- 13.3.2 Top 3 Companies Market Share Analysis
- 13.4. List of Potential Customers
- 14. Research Methodology
List of Figures
- Figure 1: Global Alcoholic Drinks Packaging Industry Revenue Breakdown (billion, %) by Region 2025 & 2033
- Figure 2: North America Alcoholic Drinks Packaging Industry Revenue (billion), by Material 2025 & 2033
- Figure 3: North America Alcoholic Drinks Packaging Industry Revenue Share (%), by Material 2025 & 2033
- Figure 4: North America Alcoholic Drinks Packaging Industry Revenue (billion), by Package Type 2025 & 2033
- Figure 5: North America Alcoholic Drinks Packaging Industry Revenue Share (%), by Package Type 2025 & 2033
- Figure 6: North America Alcoholic Drinks Packaging Industry Revenue (billion), by Product 2025 & 2033
- Figure 7: North America Alcoholic Drinks Packaging Industry Revenue Share (%), by Product 2025 & 2033
- Figure 8: North America Alcoholic Drinks Packaging Industry Revenue (billion), by Country 2025 & 2033
- Figure 9: North America Alcoholic Drinks Packaging Industry Revenue Share (%), by Country 2025 & 2033
- Figure 10: Europe Alcoholic Drinks Packaging Industry Revenue (billion), by Material 2025 & 2033
- Figure 11: Europe Alcoholic Drinks Packaging Industry Revenue Share (%), by Material 2025 & 2033
- Figure 12: Europe Alcoholic Drinks Packaging Industry Revenue (billion), by Package Type 2025 & 2033
- Figure 13: Europe Alcoholic Drinks Packaging Industry Revenue Share (%), by Package Type 2025 & 2033
- Figure 14: Europe Alcoholic Drinks Packaging Industry Revenue (billion), by Product 2025 & 2033
- Figure 15: Europe Alcoholic Drinks Packaging Industry Revenue Share (%), by Product 2025 & 2033
- Figure 16: Europe Alcoholic Drinks Packaging Industry Revenue (billion), by Country 2025 & 2033
- Figure 17: Europe Alcoholic Drinks Packaging Industry Revenue Share (%), by Country 2025 & 2033
- Figure 18: Asia Pacific Alcoholic Drinks Packaging Industry Revenue (billion), by Material 2025 & 2033
- Figure 19: Asia Pacific Alcoholic Drinks Packaging Industry Revenue Share (%), by Material 2025 & 2033
- Figure 20: Asia Pacific Alcoholic Drinks Packaging Industry Revenue (billion), by Package Type 2025 & 2033
- Figure 21: Asia Pacific Alcoholic Drinks Packaging Industry Revenue Share (%), by Package Type 2025 & 2033
- Figure 22: Asia Pacific Alcoholic Drinks Packaging Industry Revenue (billion), by Product 2025 & 2033
- Figure 23: Asia Pacific Alcoholic Drinks Packaging Industry Revenue Share (%), by Product 2025 & 2033
- Figure 24: Asia Pacific Alcoholic Drinks Packaging Industry Revenue (billion), by Country 2025 & 2033
- Figure 25: Asia Pacific Alcoholic Drinks Packaging Industry Revenue Share (%), by Country 2025 & 2033
- Figure 26: Latin America Alcoholic Drinks Packaging Industry Revenue (billion), by Material 2025 & 2033
- Figure 27: Latin America Alcoholic Drinks Packaging Industry Revenue Share (%), by Material 2025 & 2033
- Figure 28: Latin America Alcoholic Drinks Packaging Industry Revenue (billion), by Package Type 2025 & 2033
- Figure 29: Latin America Alcoholic Drinks Packaging Industry Revenue Share (%), by Package Type 2025 & 2033
- Figure 30: Latin America Alcoholic Drinks Packaging Industry Revenue (billion), by Product 2025 & 2033
- Figure 31: Latin America Alcoholic Drinks Packaging Industry Revenue Share (%), by Product 2025 & 2033
- Figure 32: Latin America Alcoholic Drinks Packaging Industry Revenue (billion), by Country 2025 & 2033
- Figure 33: Latin America Alcoholic Drinks Packaging Industry Revenue Share (%), by Country 2025 & 2033
- Figure 34: Middle East Alcoholic Drinks Packaging Industry Revenue (billion), by Material 2025 & 2033
- Figure 35: Middle East Alcoholic Drinks Packaging Industry Revenue Share (%), by Material 2025 & 2033
- Figure 36: Middle East Alcoholic Drinks Packaging Industry Revenue (billion), by Package Type 2025 & 2033
- Figure 37: Middle East Alcoholic Drinks Packaging Industry Revenue Share (%), by Package Type 2025 & 2033
- Figure 38: Middle East Alcoholic Drinks Packaging Industry Revenue (billion), by Product 2025 & 2033
- Figure 39: Middle East Alcoholic Drinks Packaging Industry Revenue Share (%), by Product 2025 & 2033
- Figure 40: Middle East Alcoholic Drinks Packaging Industry Revenue (billion), by Country 2025 & 2033
- Figure 41: Middle East Alcoholic Drinks Packaging Industry Revenue Share (%), by Country 2025 & 2033
- Figure 42: UAE Alcoholic Drinks Packaging Industry Revenue (billion), by Material 2025 & 2033
- Figure 43: UAE Alcoholic Drinks Packaging Industry Revenue Share (%), by Material 2025 & 2033
- Figure 44: UAE Alcoholic Drinks Packaging Industry Revenue (billion), by Package Type 2025 & 2033
- Figure 45: UAE Alcoholic Drinks Packaging Industry Revenue Share (%), by Package Type 2025 & 2033
- Figure 46: UAE Alcoholic Drinks Packaging Industry Revenue (billion), by Product 2025 & 2033
- Figure 47: UAE Alcoholic Drinks Packaging Industry Revenue Share (%), by Product 2025 & 2033
- Figure 48: UAE Alcoholic Drinks Packaging Industry Revenue (billion), by Country 2025 & 2033
- Figure 49: UAE Alcoholic Drinks Packaging Industry Revenue Share (%), by Country 2025 & 2033
List of Tables
- Table 1: Global Alcoholic Drinks Packaging Industry Revenue billion Forecast, by Material 2020 & 2033
- Table 2: Global Alcoholic Drinks Packaging Industry Revenue billion Forecast, by Package Type 2020 & 2033
- Table 3: Global Alcoholic Drinks Packaging Industry Revenue billion Forecast, by Product 2020 & 2033
- Table 4: Global Alcoholic Drinks Packaging Industry Revenue billion Forecast, by Region 2020 & 2033
- Table 5: Global Alcoholic Drinks Packaging Industry Revenue billion Forecast, by Material 2020 & 2033
- Table 6: Global Alcoholic Drinks Packaging Industry Revenue billion Forecast, by Package Type 2020 & 2033
- Table 7: Global Alcoholic Drinks Packaging Industry Revenue billion Forecast, by Product 2020 & 2033
- Table 8: Global Alcoholic Drinks Packaging Industry Revenue billion Forecast, by Country 2020 & 2033
- Table 9: United States Alcoholic Drinks Packaging Industry Revenue (billion) Forecast, by Application 2020 & 2033
- Table 10: Canada Alcoholic Drinks Packaging Industry Revenue (billion) Forecast, by Application 2020 & 2033
- Table 11: Global Alcoholic Drinks Packaging Industry Revenue billion Forecast, by Material 2020 & 2033
- Table 12: Global Alcoholic Drinks Packaging Industry Revenue billion Forecast, by Package Type 2020 & 2033
- Table 13: Global Alcoholic Drinks Packaging Industry Revenue billion Forecast, by Product 2020 & 2033
- Table 14: Global Alcoholic Drinks Packaging Industry Revenue billion Forecast, by Country 2020 & 2033
- Table 15: Germany Alcoholic Drinks Packaging Industry Revenue (billion) Forecast, by Application 2020 & 2033
- Table 16: United Kingdom Alcoholic Drinks Packaging Industry Revenue (billion) Forecast, by Application 2020 & 2033
- Table 17: France Alcoholic Drinks Packaging Industry Revenue (billion) Forecast, by Application 2020 & 2033
- Table 18: Rest of Europe Alcoholic Drinks Packaging Industry Revenue (billion) Forecast, by Application 2020 & 2033
- Table 19: Global Alcoholic Drinks Packaging Industry Revenue billion Forecast, by Material 2020 & 2033
- Table 20: Global Alcoholic Drinks Packaging Industry Revenue billion Forecast, by Package Type 2020 & 2033
- Table 21: Global Alcoholic Drinks Packaging Industry Revenue billion Forecast, by Product 2020 & 2033
- Table 22: Global Alcoholic Drinks Packaging Industry Revenue billion Forecast, by Country 2020 & 2033
- Table 23: China Alcoholic Drinks Packaging Industry Revenue (billion) Forecast, by Application 2020 & 2033
- Table 24: Japan Alcoholic Drinks Packaging Industry Revenue (billion) Forecast, by Application 2020 & 2033
- Table 25: India Alcoholic Drinks Packaging Industry Revenue (billion) Forecast, by Application 2020 & 2033
- Table 26: Rest of Asia Pacific Alcoholic Drinks Packaging Industry Revenue (billion) Forecast, by Application 2020 & 2033
- Table 27: Global Alcoholic Drinks Packaging Industry Revenue billion Forecast, by Material 2020 & 2033
- Table 28: Global Alcoholic Drinks Packaging Industry Revenue billion Forecast, by Package Type 2020 & 2033
- Table 29: Global Alcoholic Drinks Packaging Industry Revenue billion Forecast, by Product 2020 & 2033
- Table 30: Global Alcoholic Drinks Packaging Industry Revenue billion Forecast, by Country 2020 & 2033
- Table 31: Brazil Alcoholic Drinks Packaging Industry Revenue (billion) Forecast, by Application 2020 & 2033
- Table 32: Argentina Alcoholic Drinks Packaging Industry Revenue (billion) Forecast, by Application 2020 & 2033
- Table 33: Mexico Alcoholic Drinks Packaging Industry Revenue (billion) Forecast, by Application 2020 & 2033
- Table 34: Rest of Latin America Alcoholic Drinks Packaging Industry Revenue (billion) Forecast, by Application 2020 & 2033
- Table 35: Global Alcoholic Drinks Packaging Industry Revenue billion Forecast, by Material 2020 & 2033
- Table 36: Global Alcoholic Drinks Packaging Industry Revenue billion Forecast, by Package Type 2020 & 2033
- Table 37: Global Alcoholic Drinks Packaging Industry Revenue billion Forecast, by Product 2020 & 2033
- Table 38: Global Alcoholic Drinks Packaging Industry Revenue billion Forecast, by Country 2020 & 2033
- Table 39: Global Alcoholic Drinks Packaging Industry Revenue billion Forecast, by Material 2020 & 2033
- Table 40: Global Alcoholic Drinks Packaging Industry Revenue billion Forecast, by Package Type 2020 & 2033
- Table 41: Global Alcoholic Drinks Packaging Industry Revenue billion Forecast, by Product 2020 & 2033
- Table 42: Global Alcoholic Drinks Packaging Industry Revenue billion Forecast, by Country 2020 & 2033
- Table 43: South Africa Alcoholic Drinks Packaging Industry Revenue (billion) Forecast, by Application 2020 & 2033
- Table 44: Rest of Middle East Alcoholic Drinks Packaging Industry Revenue (billion) Forecast, by Application 2020 & 2033
Frequently Asked Questions
1. What is the projected Compound Annual Growth Rate (CAGR) of the Alcoholic Drinks Packaging Industry?
The projected CAGR is approximately 5.05%.
2. Which companies are prominent players in the Alcoholic Drinks Packaging Industry?
Key companies in the market include Tetra Laval(tetra Pack), Krones AG, Amcor Plc, Ball Corporation (Rexam PLC), Mondi Group, Saint Gobain SA, Sidel Inc *List Not Exhaustive, Crown Holdings Incorporated.
3. What are the main segments of the Alcoholic Drinks Packaging Industry?
The market segments include Material, Package Type, Product.
4. Can you provide details about the market size?
The market size is estimated to be USD 168.08 billion as of 2022.
5. What are some drivers contributing to market growth?
; Increasing Prosperity and Urbanization; Rising Innovations in the Packaging Industry.
6. What are the notable trends driving market growth?
Glass Packing Accounts for the Largest Share in the Market.
7. Are there any restraints impacting market growth?
; Fluctuating Raw Material Prices.
8. Can you provide examples of recent developments in the market?
N/A
9. What pricing options are available for accessing the report?
Pricing options include single-user, multi-user, and enterprise licenses priced at USD 4750, USD 5250, and USD 8750 respectively.
10. Is the market size provided in terms of value or volume?
The market size is provided in terms of value, measured in billion.
11. Are there any specific market keywords associated with the report?
Yes, the market keyword associated with the report is "Alcoholic Drinks Packaging Industry," which aids in identifying and referencing the specific market segment covered.
12. How do I determine which pricing option suits my needs best?
The pricing options vary based on user requirements and access needs. Individual users may opt for single-user licenses, while businesses requiring broader access may choose multi-user or enterprise licenses for cost-effective access to the report.
13. Are there any additional resources or data provided in the Alcoholic Drinks Packaging Industry report?
While the report offers comprehensive insights, it's advisable to review the specific contents or supplementary materials provided to ascertain if additional resources or data are available.
14. How can I stay updated on further developments or reports in the Alcoholic Drinks Packaging Industry?
To stay informed about further developments, trends, and reports in the Alcoholic Drinks Packaging Industry, consider subscribing to industry newsletters, following relevant companies and organizations, or regularly checking reputable industry news sources and publications.
Methodology
Step 1 - Identification of Relevant Samples Size from Population Database


Step 2 - Approaches for Defining Global Market Size (Value, Volume* & Price*)

Note*: In applicable scenarios
Step 3 - Data Sources
Primary Research
- Web Analytics
- Survey Reports
- Research Institute
- Latest Research Reports
- Opinion Leaders
Secondary Research
- Annual Reports
- White Paper
- Latest Press Release
- Industry Association
- Paid Database
- Investor Presentations

Step 4 - Data Triangulation
Involves using different sources of information in order to increase the validity of a study
These sources are likely to be stakeholders in a program - participants, other researchers, program staff, other community members, and so on.
Then we put all data in single framework & apply various statistical tools to find out the dynamic on the market.
During the analysis stage, feedback from the stakeholder groups would be compared to determine areas of agreement as well as areas of divergence