


Key Insights
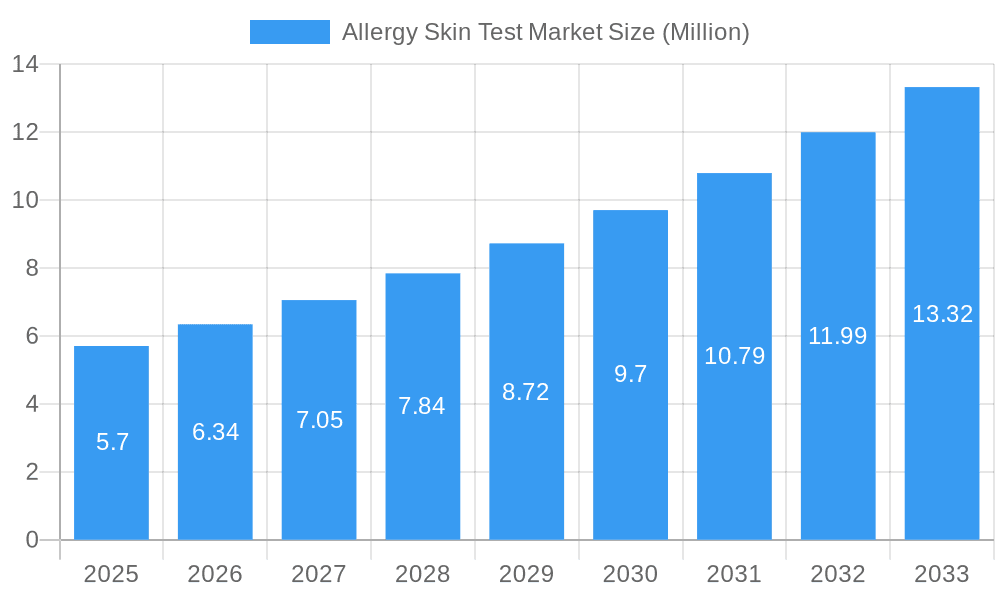
The global Allergy Skin Test Market is poised for substantial growth, projected to reach \$5.70 million in 2025 and expand at a Compound Annual Growth Rate (CAGR) of 11.20% through 2033. This robust expansion is fueled by several key drivers, including the increasing prevalence of allergic diseases worldwide, a growing awareness among the public and healthcare professionals about the diagnostic importance of skin testing, and advancements in testing methodologies and product innovation. The market is segmented into inhaled allergens, food allergens, and other allergens, with inhaled allergens likely dominating due to the widespread nature of conditions like allergic rhinitis and asthma. In terms of products, both instruments and consumables are critical, with a particular emphasis on luminometers for their precision and speed in diagnostic assays. Diagnostic laboratories and hospitals are the primary end-users, benefiting from the accuracy and efficiency these tests offer in identifying allergens and guiding treatment strategies. The rising demand for early and accurate diagnosis of allergies, coupled with a growing disposable income in emerging economies, further propels market expansion.

Allergy Skin Test Market Market Size (In Million)

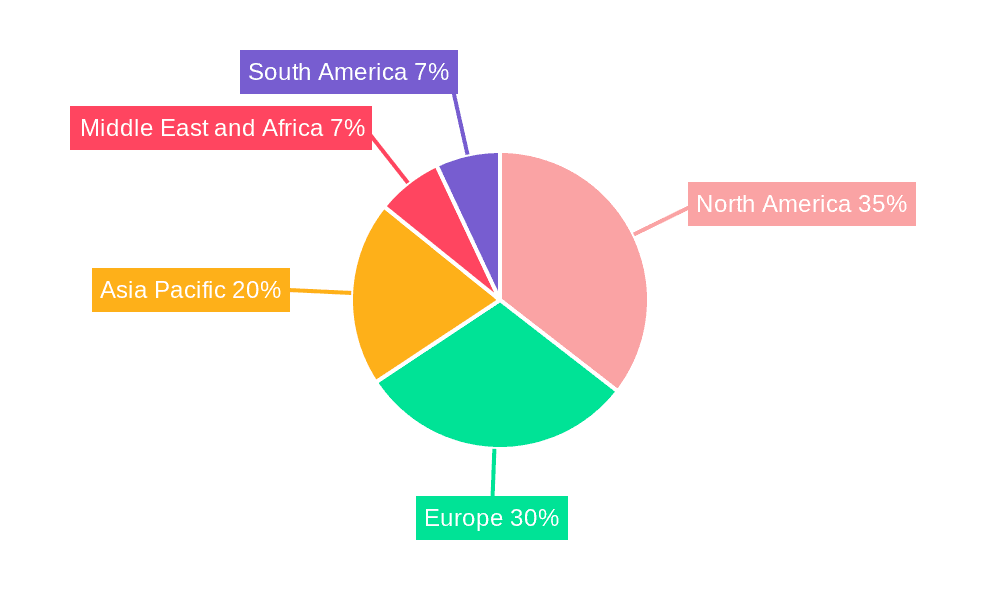
The competitive landscape is characterized by the presence of several key players, including Revvity Inc., Siemens Healthineers AG, and Thermo Fisher Scientific Inc., who are actively engaged in research and development to introduce innovative solutions and expand their market reach. Geographically, North America is anticipated to lead the market, driven by high healthcare expenditure, advanced diagnostic infrastructure, and a high incidence of allergic conditions. Europe also represents a significant market due to its well-established healthcare systems and increasing focus on personalized medicine. The Asia Pacific region is expected to witness the fastest growth, propelled by a burgeoning patient population, improving healthcare accessibility, and increasing adoption of advanced diagnostic technologies. Addressing the rising burden of allergic diseases necessitates sophisticated diagnostic tools, and the allergy skin test market is well-positioned to meet this demand, offering significant opportunities for stakeholders.
Allergy Skin Test Market Company Market Share
Gain unparalleled insights into the burgeoning Allergy Skin Test Market, a critical sector within diagnostics, poised for significant expansion. This in-depth report, covering 2019-2033 with a base year of 2025, provides actionable intelligence for stakeholders seeking to capitalize on rising allergy prevalence and advancements in diagnostic technologies. Explore market dynamics, dominant regions, key players like Revvity Inc (PerkinElmer Inc), Thermo Fischer Scientific Inc, and Siemens Healthineers AG, and innovative product developments driving growth. Uncover crucial CAGR projections, market penetration strategies, and the impact of emerging trends in inhaled, food, and other allergens. This report is your definitive guide to navigating the complexities and opportunities within the global allergy diagnostics landscape.
Allergy Skin Test Market Market Structure & Innovation Trends
The Allergy Skin Test Market exhibits a moderately concentrated structure, characterized by a blend of established diagnostic giants and agile innovators. Key players like Revvity Inc (PerkinElmer Inc), Thermo Fischer Scientific Inc, and Siemens Healthineers AG hold substantial market share through their comprehensive portfolios of instruments and consumables. Innovation is a primary driver, fueled by the relentless pursuit of enhanced sensitivity, specificity, and multiplexing capabilities in allergen detection. Regulatory frameworks, particularly those governing in vitro diagnostics (IVDs), play a pivotal role, influencing product approvals and market entry. Product substitutes, such as component-resolved diagnostics (CRD) and immunoassay-based testing, are present but skin testing remains a cost-effective and widely adopted primary diagnostic modality. End-user demographics are expanding beyond traditional diagnostic laboratories and hospitals to include specialized allergy clinics and direct-to-consumer testing avenues. Mergers and acquisitions (M&A) are anticipated to continue shaping the market landscape, with significant M&A deal values driving consolidation and expanding geographical reach.
- Market Concentration: Moderate, with a few dominant global players and a significant number of specialized companies.
- Innovation Drivers: Increased allergy prevalence, demand for rapid and accurate diagnostics, technological advancements in assay development, and the need for comprehensive allergen panels.
- Regulatory Frameworks: Stringent regulations from bodies like the FDA (USA), EMA (Europe), and regional authorities ensuring product safety and efficacy.
- Product Substitutes: Immunoassays (IgE testing), component-resolved diagnostics (CRD), and molecular diagnostics.
- End-User Demographics: Diagnostic laboratories, hospitals, allergy clinics, research institutions, and a growing interest in home-use or patient-centric testing.
- M&A Activities: Strategic acquisitions to gain market access, expand product portfolios, and acquire innovative technologies.
Allergy Skin Test Market Market Dynamics & Trends
The Allergy Skin Test Market is experiencing robust growth, propelled by an escalating global burden of allergic diseases and a heightened awareness among both patients and healthcare providers. The increasing prevalence of food allergies, respiratory allergies, and other hypersensitivities directly translates into a higher demand for accurate and efficient diagnostic tools, including skin prick tests and intradermal tests. Technological advancements are at the forefront of market dynamics, with manufacturers continually innovating to improve the accuracy, speed, and comprehensiveness of allergy testing solutions. This includes the development of more sophisticated instruments for automated testing, the creation of highly specific allergen extracts, and the integration of digital platforms for data management and analysis. Consumer preferences are leaning towards minimally invasive, cost-effective, and readily accessible diagnostic options, further bolstering the appeal of skin-based allergy testing. The competitive landscape is dynamic, characterized by intense R&D investments, strategic partnerships, and a race to capture market share through superior product offerings and expanding distribution networks. Key market penetration strategies involve educating healthcare professionals about the benefits of updated testing methodologies and highlighting the cost-effectiveness of skin testing in primary allergy diagnosis. The market penetration of advanced allergy skin testing solutions is expected to increase significantly as awareness grows and reimbursement policies evolve.
Dominant Regions & Segments in Allergy Skin Test Market
North America currently dominates the Allergy Skin Test Market, driven by a high prevalence of allergic diseases, well-established healthcare infrastructure, significant healthcare expenditure, and advanced diagnostic technology adoption. The United States, in particular, contributes substantially to this regional dominance due to its large population, increasing awareness of allergy management, and robust reimbursement policies for diagnostic procedures.
- Dominant Region: North America, with Europe as a significant secondary market.
- Key Drivers of Regional Dominance:
- High Allergy Prevalence: A large and growing population suffering from various allergic conditions.
- Advanced Healthcare Infrastructure: Well-equipped diagnostic laboratories and hospitals with a strong focus on patient care.
- Significant Healthcare Expenditure: Increased investment in diagnostics and treatments for allergic diseases.
- Technological Adoption: Early and widespread adoption of advanced diagnostic instruments and techniques.
- Awareness and Education: Strong public and professional awareness regarding allergy diagnosis and management.
Within the segment analysis, Inhaled Allergens represent a significant market share due to the widespread nature of conditions like allergic rhinitis and asthma, which are commonly diagnosed through skin testing. The demand for testing against pollens, dust mites, and pet dander remains consistently high.
- Dominant Allergen Segment: Inhaled Allergens
- Key Drivers: Pervasiveness of allergic rhinitis, asthma, and other respiratory allergies; year-round exposure to environmental allergens; increasing urban pollution exacerbating respiratory sensitivities.
In terms of products, Consumables are a major revenue generator. This includes the allergen extracts, skin prick devices, and other disposable items necessary for performing skin tests. The recurring nature of these purchases, coupled with the need for a wide variety of allergen options, contributes to their significant market presence.
- Dominant Product Segment: Consumables
- Key Drivers: High volume of skin tests performed; need for a diverse range of standardized allergen extracts; recurring purchase cycles; disposable nature of testing materials.
Diagnostic Laboratories emerge as the leading end-user segment. These facilities are equipped to handle the technical requirements of skin testing and cater to a large patient volume referred by physicians. Their role in providing accurate and reliable allergy diagnostics is paramount.
- Dominant End-User Segment: Diagnostic Laboratories
- Key Drivers: Specialized infrastructure and trained personnel for conducting skin tests; high throughput testing capabilities; comprehensive diagnostic service offerings; established referral networks from physicians.
Allergy Skin Test Market Product Innovations
Product innovations in the Allergy Skin Test Market are focused on enhancing diagnostic precision and patient experience. Advancements in allergen standardization and the development of multiplex testing platforms are key trends. Manufacturers are introducing kits capable of simultaneously screening for a broader range of allergens, reducing testing time and increasing diagnostic yield. These innovations offer competitive advantages by providing more comprehensive results, improving diagnostic accuracy for complex cases, and streamlining the testing workflow for healthcare professionals. The market fit for these innovations is strong, directly addressing the growing need for efficient and thorough allergy diagnosis in an era of increasing allergy prevalence.
Report Scope & Segmentation Analysis
This report comprehensively analyzes the global Allergy Skin Test Market, segmented by allergen type, product, and end-user.
- Allergen Segmentation: The market is segmented into Inhaled Allergens, Food Allergens, and Other Allergens. Inhaled allergens, including pollens and dust mites, are expected to witness substantial growth due to rising respiratory allergies. Food allergens are also a key focus with increasing awareness of food intolerances.
- Product Segmentation: Key product categories include Instruments, Consumables, and Luminometers. Consumables are projected to hold a significant market share due to their repetitive purchase nature. Instruments, including automated readers, are expected to grow with technological advancements.
- End-User Segmentation: The primary end-users are Diagnostic Laboratories, Hospitals, and Other End-Users (e.g., allergy clinics, research institutions). Diagnostic laboratories are anticipated to lead the market owing to their specialized infrastructure and patient volume.
Key Drivers of Allergy Skin Test Market Growth
The Allergy Skin Test Market is propelled by several critical growth drivers. The escalating global prevalence of allergic diseases, including respiratory and food allergies, is a primary catalyst, creating a sustained demand for diagnostic solutions. Technological advancements in assay development and instrumentation, leading to enhanced accuracy, speed, and multiplexing capabilities, are further fueling market expansion. Increasing awareness among healthcare professionals and the general public regarding the importance of timely and accurate allergy diagnosis is another significant factor. Favorable reimbursement policies in many developed nations for allergy testing procedures also contribute to market growth. Furthermore, the cost-effectiveness and efficiency of skin testing compared to some alternative diagnostic methods make it a preferred choice for primary diagnosis.
Challenges in the Allergy Skin Test Market Sector
Despite its growth trajectory, the Allergy Skin Test Market faces several challenges. Stringent regulatory approvals for new allergen extracts and diagnostic devices can lead to prolonged market entry timelines and increased development costs. The availability of alternative diagnostic methods, such as immunoassays and component-resolved diagnostics, presents a competitive pressure, particularly for complex cases or when skin testing is contraindicated. Supply chain disruptions for raw materials, including high-quality allergen extracts, can impact manufacturing and product availability. Furthermore, variations in reimbursement policies across different regions can affect market access and adoption rates. Ensuring consistent standardization and quality control across a wide array of allergen extracts globally remains a continuous challenge.
Emerging Opportunities in Allergy Skin Test Market
Emerging opportunities in the Allergy Skin Test Market lie in several key areas. The growing demand for comprehensive testing panels that can simultaneously screen for a wide spectrum of allergens, including both common and rare allergens, presents a significant opportunity for innovation. The development and adoption of point-of-care allergy testing solutions, enabling faster diagnosis and treatment initiation, are also gaining traction. Expansion into emerging economies with rising disposable incomes and increasing healthcare access offers untapped market potential. The integration of digital health technologies, such as AI-powered data analysis and remote monitoring for allergy management, presents further avenues for growth and improved patient care. Furthermore, research into novel allergen sources and the development of more stable and sensitive diagnostic reagents will continue to drive market evolution.
Leading Players in the Allergy Skin Test Market Market
- Revvity Inc (PerkinElmer Inc)
- HYCOR Biomedical
- BioMerieux SA
- Stallergenes Greer Ltd
- HOB Biotech Group Corp Ltd
- R-Biopharm AG
- Biomeric Inc
- Siemens Healthineers AG
- Danaher Corporation
- Immunodiagnostic Systems Holdings PLC (IDS)
- Thermo Fischer Scientific Inc
- Abionic SA
- Lincoln Diagnostics Inc
- Omega Diagnostics Group Plc
Key Developments in Allergy Skin Test Market Industry
- December 2022: Proteomtech secured approval from South Korea's Ministry of Food and Drug Safety for their innovative diagnostic tool, 'Protea Allergy-Q 128M'. This kit, with 128 test lines on a single panel, allows simultaneous screening for 118 types of allergens, covering a broad spectrum of allergy-causing substances. Notably, it assesses atopy, respiratory issues, and food allergies concurrently, enhancing diagnostic efficiency and scope.
- June 2022: Oncologica, a prominent healthcare testing laboratory in Cambridge, introduced the allergy focus test. This test aids individuals in identifying their body's reactions to common global allergens, offering insights into potential allergen triggers and promoting personalized allergy management strategies.
Future Outlook for Allergy Skin Test Market Market
The future outlook for the Allergy Skin Test Market is highly promising, characterized by sustained growth and innovation. The increasing global incidence of allergic diseases, coupled with a growing emphasis on early and accurate diagnosis, will continue to drive market expansion. Technological advancements, such as the development of highly multiplexed diagnostic platforms and user-friendly instruments, will enhance efficiency and accessibility. The expanding healthcare infrastructure in emerging economies presents significant untapped potential. Furthermore, the integration of digital health solutions and the ongoing pursuit of novel allergen detection technologies will shape the market landscape, offering advanced diagnostic capabilities and improved patient outcomes. Strategic collaborations and potential mergers and acquisitions are expected to further consolidate the market, fostering innovation and expanding global reach.
Allergy Skin Test Market Segmentation
-
1. Allergen
- 1.1. Inhaled Allergens
- 1.2. Food Allergens
- 1.3. Other Allergens
-
2. Product
- 2.1. Instruments
- 2.2. Consumables
- 2.3. Luminometers
-
3. End-User
- 3.1. Diagnostic Laboratories
- 3.2. Hospitals
- 3.3. Other End-Users
Allergy Skin Test Market Segmentation By Geography
-
1. North America
- 1.1. United States
- 1.2. Canada
- 1.3. Mexico
-
2. Europe
- 2.1. Germany
- 2.2. United Kingdom
- 2.3. France
- 2.4. Italy
- 2.5. Spain
- 2.6. Rest of Europe
-
3. Asia Pacific
- 3.1. China
- 3.2. Japan
- 3.3. India
- 3.4. Australia
- 3.5. South Korea
- 3.6. Rest of Asia Pacific
-
4. Middle East and Africa
- 4.1. GCC
- 4.2. South Africa
- 4.3. Rest of Middle East and Africa
-
5. South America
- 5.1. Brazil
- 5.2. Argentina
- 5.3. Rest of South America
Allergy Skin Test Market Regional Market Share
Geographic Coverage of Allergy Skin Test Market
Allergy Skin Test Market REPORT HIGHLIGHTS
| Aspects | Details |
|---|---|
| Study Period | 2020-2034 |
| Base Year | 2025 |
| Estimated Year | 2026 |
| Forecast Period | 2026-2034 |
| Historical Period | 2020-2025 |
| Growth Rate | CAGR of 11.20% from 2020-2034 |
| Segmentation |
|
Table of Contents
- 1. Introduction
- 1.1. Research Scope
- 1.2. Market Segmentation
- 1.3. Research Methodology
- 1.4. Definitions and Assumptions
- 2. Executive Summary
- 2.1. Introduction
- 3. Market Dynamics
- 3.1. Introduction
- 3.2. Market Drivers
- 3.2.1. Increasing Incidences of Allergic Diseases; Environmental Pollution
- 3.3. Market Restrains
- 3.3.1. Lack of Awareness About Allergic Diseases; Affordability of Allergy Diagnostics
- 3.4. Market Trends
- 3.4.1. Inhaled Allergens Segment Expects to Register a High CAGR in the Allergy Diagnostics Market Over the Forecast Period
- 4. Market Factor Analysis
- 4.1. Porters Five Forces
- 4.2. Supply/Value Chain
- 4.3. PESTEL analysis
- 4.4. Market Entropy
- 4.5. Patent/Trademark Analysis
- 5. Global Allergy Skin Test Market Analysis, Insights and Forecast, 2020-2032
- 5.1. Market Analysis, Insights and Forecast - by Allergen
- 5.1.1. Inhaled Allergens
- 5.1.2. Food Allergens
- 5.1.3. Other Allergens
- 5.2. Market Analysis, Insights and Forecast - by Product
- 5.2.1. Instruments
- 5.2.2. Consumables
- 5.2.3. Luminometers
- 5.3. Market Analysis, Insights and Forecast - by End-User
- 5.3.1. Diagnostic Laboratories
- 5.3.2. Hospitals
- 5.3.3. Other End-Users
- 5.4. Market Analysis, Insights and Forecast - by Region
- 5.4.1. North America
- 5.4.2. Europe
- 5.4.3. Asia Pacific
- 5.4.4. Middle East and Africa
- 5.4.5. South America
- 5.1. Market Analysis, Insights and Forecast - by Allergen
- 6. North America Allergy Skin Test Market Analysis, Insights and Forecast, 2020-2032
- 6.1. Market Analysis, Insights and Forecast - by Allergen
- 6.1.1. Inhaled Allergens
- 6.1.2. Food Allergens
- 6.1.3. Other Allergens
- 6.2. Market Analysis, Insights and Forecast - by Product
- 6.2.1. Instruments
- 6.2.2. Consumables
- 6.2.3. Luminometers
- 6.3. Market Analysis, Insights and Forecast - by End-User
- 6.3.1. Diagnostic Laboratories
- 6.3.2. Hospitals
- 6.3.3. Other End-Users
- 6.1. Market Analysis, Insights and Forecast - by Allergen
- 7. Europe Allergy Skin Test Market Analysis, Insights and Forecast, 2020-2032
- 7.1. Market Analysis, Insights and Forecast - by Allergen
- 7.1.1. Inhaled Allergens
- 7.1.2. Food Allergens
- 7.1.3. Other Allergens
- 7.2. Market Analysis, Insights and Forecast - by Product
- 7.2.1. Instruments
- 7.2.2. Consumables
- 7.2.3. Luminometers
- 7.3. Market Analysis, Insights and Forecast - by End-User
- 7.3.1. Diagnostic Laboratories
- 7.3.2. Hospitals
- 7.3.3. Other End-Users
- 7.1. Market Analysis, Insights and Forecast - by Allergen
- 8. Asia Pacific Allergy Skin Test Market Analysis, Insights and Forecast, 2020-2032
- 8.1. Market Analysis, Insights and Forecast - by Allergen
- 8.1.1. Inhaled Allergens
- 8.1.2. Food Allergens
- 8.1.3. Other Allergens
- 8.2. Market Analysis, Insights and Forecast - by Product
- 8.2.1. Instruments
- 8.2.2. Consumables
- 8.2.3. Luminometers
- 8.3. Market Analysis, Insights and Forecast - by End-User
- 8.3.1. Diagnostic Laboratories
- 8.3.2. Hospitals
- 8.3.3. Other End-Users
- 8.1. Market Analysis, Insights and Forecast - by Allergen
- 9. Middle East and Africa Allergy Skin Test Market Analysis, Insights and Forecast, 2020-2032
- 9.1. Market Analysis, Insights and Forecast - by Allergen
- 9.1.1. Inhaled Allergens
- 9.1.2. Food Allergens
- 9.1.3. Other Allergens
- 9.2. Market Analysis, Insights and Forecast - by Product
- 9.2.1. Instruments
- 9.2.2. Consumables
- 9.2.3. Luminometers
- 9.3. Market Analysis, Insights and Forecast - by End-User
- 9.3.1. Diagnostic Laboratories
- 9.3.2. Hospitals
- 9.3.3. Other End-Users
- 9.1. Market Analysis, Insights and Forecast - by Allergen
- 10. South America Allergy Skin Test Market Analysis, Insights and Forecast, 2020-2032
- 10.1. Market Analysis, Insights and Forecast - by Allergen
- 10.1.1. Inhaled Allergens
- 10.1.2. Food Allergens
- 10.1.3. Other Allergens
- 10.2. Market Analysis, Insights and Forecast - by Product
- 10.2.1. Instruments
- 10.2.2. Consumables
- 10.2.3. Luminometers
- 10.3. Market Analysis, Insights and Forecast - by End-User
- 10.3.1. Diagnostic Laboratories
- 10.3.2. Hospitals
- 10.3.3. Other End-Users
- 10.1. Market Analysis, Insights and Forecast - by Allergen
- 11. Competitive Analysis
- 11.1. Global Market Share Analysis 2025
- 11.2. Company Profiles
- 11.2.1 Revvity Inc (PerkinElmer Inc )
- 11.2.1.1. Overview
- 11.2.1.2. Products
- 11.2.1.3. SWOT Analysis
- 11.2.1.4. Recent Developments
- 11.2.1.5. Financials (Based on Availability)
- 11.2.2 HYCOR Biomedical
- 11.2.2.1. Overview
- 11.2.2.2. Products
- 11.2.2.3. SWOT Analysis
- 11.2.2.4. Recent Developments
- 11.2.2.5. Financials (Based on Availability)
- 11.2.3 BioMerieux SA
- 11.2.3.1. Overview
- 11.2.3.2. Products
- 11.2.3.3. SWOT Analysis
- 11.2.3.4. Recent Developments
- 11.2.3.5. Financials (Based on Availability)
- 11.2.4 Stallergenes Greer Ltd
- 11.2.4.1. Overview
- 11.2.4.2. Products
- 11.2.4.3. SWOT Analysis
- 11.2.4.4. Recent Developments
- 11.2.4.5. Financials (Based on Availability)
- 11.2.5 HOB Biotech Group Corp Ltd
- 11.2.5.1. Overview
- 11.2.5.2. Products
- 11.2.5.3. SWOT Analysis
- 11.2.5.4. Recent Developments
- 11.2.5.5. Financials (Based on Availability)
- 11.2.6 R-Biopharm AG
- 11.2.6.1. Overview
- 11.2.6.2. Products
- 11.2.6.3. SWOT Analysis
- 11.2.6.4. Recent Developments
- 11.2.6.5. Financials (Based on Availability)
- 11.2.7 Biomeric Inc
- 11.2.7.1. Overview
- 11.2.7.2. Products
- 11.2.7.3. SWOT Analysis
- 11.2.7.4. Recent Developments
- 11.2.7.5. Financials (Based on Availability)
- 11.2.8 Siemens Healthineers AG
- 11.2.8.1. Overview
- 11.2.8.2. Products
- 11.2.8.3. SWOT Analysis
- 11.2.8.4. Recent Developments
- 11.2.8.5. Financials (Based on Availability)
- 11.2.9 Danaher Corporation
- 11.2.9.1. Overview
- 11.2.9.2. Products
- 11.2.9.3. SWOT Analysis
- 11.2.9.4. Recent Developments
- 11.2.9.5. Financials (Based on Availability)
- 11.2.10 Immunodiagnostic Systems Holdings PLC (IDS)
- 11.2.10.1. Overview
- 11.2.10.2. Products
- 11.2.10.3. SWOT Analysis
- 11.2.10.4. Recent Developments
- 11.2.10.5. Financials (Based on Availability)
- 11.2.11 Thermo Fischer Scientific Inc
- 11.2.11.1. Overview
- 11.2.11.2. Products
- 11.2.11.3. SWOT Analysis
- 11.2.11.4. Recent Developments
- 11.2.11.5. Financials (Based on Availability)
- 11.2.12 Abionic SA
- 11.2.12.1. Overview
- 11.2.12.2. Products
- 11.2.12.3. SWOT Analysis
- 11.2.12.4. Recent Developments
- 11.2.12.5. Financials (Based on Availability)
- 11.2.13 Lincoln Diagnostics Inc
- 11.2.13.1. Overview
- 11.2.13.2. Products
- 11.2.13.3. SWOT Analysis
- 11.2.13.4. Recent Developments
- 11.2.13.5. Financials (Based on Availability)
- 11.2.14 Omega Diagnostics Group Plc
- 11.2.14.1. Overview
- 11.2.14.2. Products
- 11.2.14.3. SWOT Analysis
- 11.2.14.4. Recent Developments
- 11.2.14.5. Financials (Based on Availability)
- 11.2.1 Revvity Inc (PerkinElmer Inc )
List of Figures
- Figure 1: Global Allergy Skin Test Market Revenue Breakdown (Million, %) by Region 2025 & 2033
- Figure 2: Global Allergy Skin Test Market Volume Breakdown (K Unit, %) by Region 2025 & 2033
- Figure 3: North America Allergy Skin Test Market Revenue (Million), by Allergen 2025 & 2033
- Figure 4: North America Allergy Skin Test Market Volume (K Unit), by Allergen 2025 & 2033
- Figure 5: North America Allergy Skin Test Market Revenue Share (%), by Allergen 2025 & 2033
- Figure 6: North America Allergy Skin Test Market Volume Share (%), by Allergen 2025 & 2033
- Figure 7: North America Allergy Skin Test Market Revenue (Million), by Product 2025 & 2033
- Figure 8: North America Allergy Skin Test Market Volume (K Unit), by Product 2025 & 2033
- Figure 9: North America Allergy Skin Test Market Revenue Share (%), by Product 2025 & 2033
- Figure 10: North America Allergy Skin Test Market Volume Share (%), by Product 2025 & 2033
- Figure 11: North America Allergy Skin Test Market Revenue (Million), by End-User 2025 & 2033
- Figure 12: North America Allergy Skin Test Market Volume (K Unit), by End-User 2025 & 2033
- Figure 13: North America Allergy Skin Test Market Revenue Share (%), by End-User 2025 & 2033
- Figure 14: North America Allergy Skin Test Market Volume Share (%), by End-User 2025 & 2033
- Figure 15: North America Allergy Skin Test Market Revenue (Million), by Country 2025 & 2033
- Figure 16: North America Allergy Skin Test Market Volume (K Unit), by Country 2025 & 2033
- Figure 17: North America Allergy Skin Test Market Revenue Share (%), by Country 2025 & 2033
- Figure 18: North America Allergy Skin Test Market Volume Share (%), by Country 2025 & 2033
- Figure 19: Europe Allergy Skin Test Market Revenue (Million), by Allergen 2025 & 2033
- Figure 20: Europe Allergy Skin Test Market Volume (K Unit), by Allergen 2025 & 2033
- Figure 21: Europe Allergy Skin Test Market Revenue Share (%), by Allergen 2025 & 2033
- Figure 22: Europe Allergy Skin Test Market Volume Share (%), by Allergen 2025 & 2033
- Figure 23: Europe Allergy Skin Test Market Revenue (Million), by Product 2025 & 2033
- Figure 24: Europe Allergy Skin Test Market Volume (K Unit), by Product 2025 & 2033
- Figure 25: Europe Allergy Skin Test Market Revenue Share (%), by Product 2025 & 2033
- Figure 26: Europe Allergy Skin Test Market Volume Share (%), by Product 2025 & 2033
- Figure 27: Europe Allergy Skin Test Market Revenue (Million), by End-User 2025 & 2033
- Figure 28: Europe Allergy Skin Test Market Volume (K Unit), by End-User 2025 & 2033
- Figure 29: Europe Allergy Skin Test Market Revenue Share (%), by End-User 2025 & 2033
- Figure 30: Europe Allergy Skin Test Market Volume Share (%), by End-User 2025 & 2033
- Figure 31: Europe Allergy Skin Test Market Revenue (Million), by Country 2025 & 2033
- Figure 32: Europe Allergy Skin Test Market Volume (K Unit), by Country 2025 & 2033
- Figure 33: Europe Allergy Skin Test Market Revenue Share (%), by Country 2025 & 2033
- Figure 34: Europe Allergy Skin Test Market Volume Share (%), by Country 2025 & 2033
- Figure 35: Asia Pacific Allergy Skin Test Market Revenue (Million), by Allergen 2025 & 2033
- Figure 36: Asia Pacific Allergy Skin Test Market Volume (K Unit), by Allergen 2025 & 2033
- Figure 37: Asia Pacific Allergy Skin Test Market Revenue Share (%), by Allergen 2025 & 2033
- Figure 38: Asia Pacific Allergy Skin Test Market Volume Share (%), by Allergen 2025 & 2033
- Figure 39: Asia Pacific Allergy Skin Test Market Revenue (Million), by Product 2025 & 2033
- Figure 40: Asia Pacific Allergy Skin Test Market Volume (K Unit), by Product 2025 & 2033
- Figure 41: Asia Pacific Allergy Skin Test Market Revenue Share (%), by Product 2025 & 2033
- Figure 42: Asia Pacific Allergy Skin Test Market Volume Share (%), by Product 2025 & 2033
- Figure 43: Asia Pacific Allergy Skin Test Market Revenue (Million), by End-User 2025 & 2033
- Figure 44: Asia Pacific Allergy Skin Test Market Volume (K Unit), by End-User 2025 & 2033
- Figure 45: Asia Pacific Allergy Skin Test Market Revenue Share (%), by End-User 2025 & 2033
- Figure 46: Asia Pacific Allergy Skin Test Market Volume Share (%), by End-User 2025 & 2033
- Figure 47: Asia Pacific Allergy Skin Test Market Revenue (Million), by Country 2025 & 2033
- Figure 48: Asia Pacific Allergy Skin Test Market Volume (K Unit), by Country 2025 & 2033
- Figure 49: Asia Pacific Allergy Skin Test Market Revenue Share (%), by Country 2025 & 2033
- Figure 50: Asia Pacific Allergy Skin Test Market Volume Share (%), by Country 2025 & 2033
- Figure 51: Middle East and Africa Allergy Skin Test Market Revenue (Million), by Allergen 2025 & 2033
- Figure 52: Middle East and Africa Allergy Skin Test Market Volume (K Unit), by Allergen 2025 & 2033
- Figure 53: Middle East and Africa Allergy Skin Test Market Revenue Share (%), by Allergen 2025 & 2033
- Figure 54: Middle East and Africa Allergy Skin Test Market Volume Share (%), by Allergen 2025 & 2033
- Figure 55: Middle East and Africa Allergy Skin Test Market Revenue (Million), by Product 2025 & 2033
- Figure 56: Middle East and Africa Allergy Skin Test Market Volume (K Unit), by Product 2025 & 2033
- Figure 57: Middle East and Africa Allergy Skin Test Market Revenue Share (%), by Product 2025 & 2033
- Figure 58: Middle East and Africa Allergy Skin Test Market Volume Share (%), by Product 2025 & 2033
- Figure 59: Middle East and Africa Allergy Skin Test Market Revenue (Million), by End-User 2025 & 2033
- Figure 60: Middle East and Africa Allergy Skin Test Market Volume (K Unit), by End-User 2025 & 2033
- Figure 61: Middle East and Africa Allergy Skin Test Market Revenue Share (%), by End-User 2025 & 2033
- Figure 62: Middle East and Africa Allergy Skin Test Market Volume Share (%), by End-User 2025 & 2033
- Figure 63: Middle East and Africa Allergy Skin Test Market Revenue (Million), by Country 2025 & 2033
- Figure 64: Middle East and Africa Allergy Skin Test Market Volume (K Unit), by Country 2025 & 2033
- Figure 65: Middle East and Africa Allergy Skin Test Market Revenue Share (%), by Country 2025 & 2033
- Figure 66: Middle East and Africa Allergy Skin Test Market Volume Share (%), by Country 2025 & 2033
- Figure 67: South America Allergy Skin Test Market Revenue (Million), by Allergen 2025 & 2033
- Figure 68: South America Allergy Skin Test Market Volume (K Unit), by Allergen 2025 & 2033
- Figure 69: South America Allergy Skin Test Market Revenue Share (%), by Allergen 2025 & 2033
- Figure 70: South America Allergy Skin Test Market Volume Share (%), by Allergen 2025 & 2033
- Figure 71: South America Allergy Skin Test Market Revenue (Million), by Product 2025 & 2033
- Figure 72: South America Allergy Skin Test Market Volume (K Unit), by Product 2025 & 2033
- Figure 73: South America Allergy Skin Test Market Revenue Share (%), by Product 2025 & 2033
- Figure 74: South America Allergy Skin Test Market Volume Share (%), by Product 2025 & 2033
- Figure 75: South America Allergy Skin Test Market Revenue (Million), by End-User 2025 & 2033
- Figure 76: South America Allergy Skin Test Market Volume (K Unit), by End-User 2025 & 2033
- Figure 77: South America Allergy Skin Test Market Revenue Share (%), by End-User 2025 & 2033
- Figure 78: South America Allergy Skin Test Market Volume Share (%), by End-User 2025 & 2033
- Figure 79: South America Allergy Skin Test Market Revenue (Million), by Country 2025 & 2033
- Figure 80: South America Allergy Skin Test Market Volume (K Unit), by Country 2025 & 2033
- Figure 81: South America Allergy Skin Test Market Revenue Share (%), by Country 2025 & 2033
- Figure 82: South America Allergy Skin Test Market Volume Share (%), by Country 2025 & 2033
List of Tables
- Table 1: Global Allergy Skin Test Market Revenue Million Forecast, by Allergen 2020 & 2033
- Table 2: Global Allergy Skin Test Market Volume K Unit Forecast, by Allergen 2020 & 2033
- Table 3: Global Allergy Skin Test Market Revenue Million Forecast, by Product 2020 & 2033
- Table 4: Global Allergy Skin Test Market Volume K Unit Forecast, by Product 2020 & 2033
- Table 5: Global Allergy Skin Test Market Revenue Million Forecast, by End-User 2020 & 2033
- Table 6: Global Allergy Skin Test Market Volume K Unit Forecast, by End-User 2020 & 2033
- Table 7: Global Allergy Skin Test Market Revenue Million Forecast, by Region 2020 & 2033
- Table 8: Global Allergy Skin Test Market Volume K Unit Forecast, by Region 2020 & 2033
- Table 9: Global Allergy Skin Test Market Revenue Million Forecast, by Allergen 2020 & 2033
- Table 10: Global Allergy Skin Test Market Volume K Unit Forecast, by Allergen 2020 & 2033
- Table 11: Global Allergy Skin Test Market Revenue Million Forecast, by Product 2020 & 2033
- Table 12: Global Allergy Skin Test Market Volume K Unit Forecast, by Product 2020 & 2033
- Table 13: Global Allergy Skin Test Market Revenue Million Forecast, by End-User 2020 & 2033
- Table 14: Global Allergy Skin Test Market Volume K Unit Forecast, by End-User 2020 & 2033
- Table 15: Global Allergy Skin Test Market Revenue Million Forecast, by Country 2020 & 2033
- Table 16: Global Allergy Skin Test Market Volume K Unit Forecast, by Country 2020 & 2033
- Table 17: United States Allergy Skin Test Market Revenue (Million) Forecast, by Application 2020 & 2033
- Table 18: United States Allergy Skin Test Market Volume (K Unit) Forecast, by Application 2020 & 2033
- Table 19: Canada Allergy Skin Test Market Revenue (Million) Forecast, by Application 2020 & 2033
- Table 20: Canada Allergy Skin Test Market Volume (K Unit) Forecast, by Application 2020 & 2033
- Table 21: Mexico Allergy Skin Test Market Revenue (Million) Forecast, by Application 2020 & 2033
- Table 22: Mexico Allergy Skin Test Market Volume (K Unit) Forecast, by Application 2020 & 2033
- Table 23: Global Allergy Skin Test Market Revenue Million Forecast, by Allergen 2020 & 2033
- Table 24: Global Allergy Skin Test Market Volume K Unit Forecast, by Allergen 2020 & 2033
- Table 25: Global Allergy Skin Test Market Revenue Million Forecast, by Product 2020 & 2033
- Table 26: Global Allergy Skin Test Market Volume K Unit Forecast, by Product 2020 & 2033
- Table 27: Global Allergy Skin Test Market Revenue Million Forecast, by End-User 2020 & 2033
- Table 28: Global Allergy Skin Test Market Volume K Unit Forecast, by End-User 2020 & 2033
- Table 29: Global Allergy Skin Test Market Revenue Million Forecast, by Country 2020 & 2033
- Table 30: Global Allergy Skin Test Market Volume K Unit Forecast, by Country 2020 & 2033
- Table 31: Germany Allergy Skin Test Market Revenue (Million) Forecast, by Application 2020 & 2033
- Table 32: Germany Allergy Skin Test Market Volume (K Unit) Forecast, by Application 2020 & 2033
- Table 33: United Kingdom Allergy Skin Test Market Revenue (Million) Forecast, by Application 2020 & 2033
- Table 34: United Kingdom Allergy Skin Test Market Volume (K Unit) Forecast, by Application 2020 & 2033
- Table 35: France Allergy Skin Test Market Revenue (Million) Forecast, by Application 2020 & 2033
- Table 36: France Allergy Skin Test Market Volume (K Unit) Forecast, by Application 2020 & 2033
- Table 37: Italy Allergy Skin Test Market Revenue (Million) Forecast, by Application 2020 & 2033
- Table 38: Italy Allergy Skin Test Market Volume (K Unit) Forecast, by Application 2020 & 2033
- Table 39: Spain Allergy Skin Test Market Revenue (Million) Forecast, by Application 2020 & 2033
- Table 40: Spain Allergy Skin Test Market Volume (K Unit) Forecast, by Application 2020 & 2033
- Table 41: Rest of Europe Allergy Skin Test Market Revenue (Million) Forecast, by Application 2020 & 2033
- Table 42: Rest of Europe Allergy Skin Test Market Volume (K Unit) Forecast, by Application 2020 & 2033
- Table 43: Global Allergy Skin Test Market Revenue Million Forecast, by Allergen 2020 & 2033
- Table 44: Global Allergy Skin Test Market Volume K Unit Forecast, by Allergen 2020 & 2033
- Table 45: Global Allergy Skin Test Market Revenue Million Forecast, by Product 2020 & 2033
- Table 46: Global Allergy Skin Test Market Volume K Unit Forecast, by Product 2020 & 2033
- Table 47: Global Allergy Skin Test Market Revenue Million Forecast, by End-User 2020 & 2033
- Table 48: Global Allergy Skin Test Market Volume K Unit Forecast, by End-User 2020 & 2033
- Table 49: Global Allergy Skin Test Market Revenue Million Forecast, by Country 2020 & 2033
- Table 50: Global Allergy Skin Test Market Volume K Unit Forecast, by Country 2020 & 2033
- Table 51: China Allergy Skin Test Market Revenue (Million) Forecast, by Application 2020 & 2033
- Table 52: China Allergy Skin Test Market Volume (K Unit) Forecast, by Application 2020 & 2033
- Table 53: Japan Allergy Skin Test Market Revenue (Million) Forecast, by Application 2020 & 2033
- Table 54: Japan Allergy Skin Test Market Volume (K Unit) Forecast, by Application 2020 & 2033
- Table 55: India Allergy Skin Test Market Revenue (Million) Forecast, by Application 2020 & 2033
- Table 56: India Allergy Skin Test Market Volume (K Unit) Forecast, by Application 2020 & 2033
- Table 57: Australia Allergy Skin Test Market Revenue (Million) Forecast, by Application 2020 & 2033
- Table 58: Australia Allergy Skin Test Market Volume (K Unit) Forecast, by Application 2020 & 2033
- Table 59: South Korea Allergy Skin Test Market Revenue (Million) Forecast, by Application 2020 & 2033
- Table 60: South Korea Allergy Skin Test Market Volume (K Unit) Forecast, by Application 2020 & 2033
- Table 61: Rest of Asia Pacific Allergy Skin Test Market Revenue (Million) Forecast, by Application 2020 & 2033
- Table 62: Rest of Asia Pacific Allergy Skin Test Market Volume (K Unit) Forecast, by Application 2020 & 2033
- Table 63: Global Allergy Skin Test Market Revenue Million Forecast, by Allergen 2020 & 2033
- Table 64: Global Allergy Skin Test Market Volume K Unit Forecast, by Allergen 2020 & 2033
- Table 65: Global Allergy Skin Test Market Revenue Million Forecast, by Product 2020 & 2033
- Table 66: Global Allergy Skin Test Market Volume K Unit Forecast, by Product 2020 & 2033
- Table 67: Global Allergy Skin Test Market Revenue Million Forecast, by End-User 2020 & 2033
- Table 68: Global Allergy Skin Test Market Volume K Unit Forecast, by End-User 2020 & 2033
- Table 69: Global Allergy Skin Test Market Revenue Million Forecast, by Country 2020 & 2033
- Table 70: Global Allergy Skin Test Market Volume K Unit Forecast, by Country 2020 & 2033
- Table 71: GCC Allergy Skin Test Market Revenue (Million) Forecast, by Application 2020 & 2033
- Table 72: GCC Allergy Skin Test Market Volume (K Unit) Forecast, by Application 2020 & 2033
- Table 73: South Africa Allergy Skin Test Market Revenue (Million) Forecast, by Application 2020 & 2033
- Table 74: South Africa Allergy Skin Test Market Volume (K Unit) Forecast, by Application 2020 & 2033
- Table 75: Rest of Middle East and Africa Allergy Skin Test Market Revenue (Million) Forecast, by Application 2020 & 2033
- Table 76: Rest of Middle East and Africa Allergy Skin Test Market Volume (K Unit) Forecast, by Application 2020 & 2033
- Table 77: Global Allergy Skin Test Market Revenue Million Forecast, by Allergen 2020 & 2033
- Table 78: Global Allergy Skin Test Market Volume K Unit Forecast, by Allergen 2020 & 2033
- Table 79: Global Allergy Skin Test Market Revenue Million Forecast, by Product 2020 & 2033
- Table 80: Global Allergy Skin Test Market Volume K Unit Forecast, by Product 2020 & 2033
- Table 81: Global Allergy Skin Test Market Revenue Million Forecast, by End-User 2020 & 2033
- Table 82: Global Allergy Skin Test Market Volume K Unit Forecast, by End-User 2020 & 2033
- Table 83: Global Allergy Skin Test Market Revenue Million Forecast, by Country 2020 & 2033
- Table 84: Global Allergy Skin Test Market Volume K Unit Forecast, by Country 2020 & 2033
- Table 85: Brazil Allergy Skin Test Market Revenue (Million) Forecast, by Application 2020 & 2033
- Table 86: Brazil Allergy Skin Test Market Volume (K Unit) Forecast, by Application 2020 & 2033
- Table 87: Argentina Allergy Skin Test Market Revenue (Million) Forecast, by Application 2020 & 2033
- Table 88: Argentina Allergy Skin Test Market Volume (K Unit) Forecast, by Application 2020 & 2033
- Table 89: Rest of South America Allergy Skin Test Market Revenue (Million) Forecast, by Application 2020 & 2033
- Table 90: Rest of South America Allergy Skin Test Market Volume (K Unit) Forecast, by Application 2020 & 2033
Frequently Asked Questions
1. What is the projected Compound Annual Growth Rate (CAGR) of the Allergy Skin Test Market?
The projected CAGR is approximately 11.20%.
2. Which companies are prominent players in the Allergy Skin Test Market?
Key companies in the market include Revvity Inc (PerkinElmer Inc ), HYCOR Biomedical, BioMerieux SA, Stallergenes Greer Ltd, HOB Biotech Group Corp Ltd, R-Biopharm AG, Biomeric Inc , Siemens Healthineers AG, Danaher Corporation, Immunodiagnostic Systems Holdings PLC (IDS), Thermo Fischer Scientific Inc, Abionic SA, Lincoln Diagnostics Inc, Omega Diagnostics Group Plc.
3. What are the main segments of the Allergy Skin Test Market?
The market segments include Allergen, Product, End-User.
4. Can you provide details about the market size?
The market size is estimated to be USD 5.70 Million as of 2022.
5. What are some drivers contributing to market growth?
Increasing Incidences of Allergic Diseases; Environmental Pollution.
6. What are the notable trends driving market growth?
Inhaled Allergens Segment Expects to Register a High CAGR in the Allergy Diagnostics Market Over the Forecast Period.
7. Are there any restraints impacting market growth?
Lack of Awareness About Allergic Diseases; Affordability of Allergy Diagnostics.
8. Can you provide examples of recent developments in the market?
December 2022: Proteomtech secured approval from South Korea's Ministry of Food and Drug Safety for their innovative diagnostic tool, 'Protea Allergy-Q 128M'. This kit, with 128 test lines on a single panel, allows simultaneous screening for 118 types of allergens, covering a broad spectrum of allergy-causing substances. Notably, it assesses atopy, respiratory issues, and food allergies concurrently.
9. What pricing options are available for accessing the report?
Pricing options include single-user, multi-user, and enterprise licenses priced at USD 4750, USD 5250, and USD 8750 respectively.
10. Is the market size provided in terms of value or volume?
The market size is provided in terms of value, measured in Million and volume, measured in K Unit.
11. Are there any specific market keywords associated with the report?
Yes, the market keyword associated with the report is "Allergy Skin Test Market," which aids in identifying and referencing the specific market segment covered.
12. How do I determine which pricing option suits my needs best?
The pricing options vary based on user requirements and access needs. Individual users may opt for single-user licenses, while businesses requiring broader access may choose multi-user or enterprise licenses for cost-effective access to the report.
13. Are there any additional resources or data provided in the Allergy Skin Test Market report?
While the report offers comprehensive insights, it's advisable to review the specific contents or supplementary materials provided to ascertain if additional resources or data are available.
14. How can I stay updated on further developments or reports in the Allergy Skin Test Market?
To stay informed about further developments, trends, and reports in the Allergy Skin Test Market, consider subscribing to industry newsletters, following relevant companies and organizations, or regularly checking reputable industry news sources and publications.
Methodology
Step 1 - Identification of Relevant Samples Size from Population Database


Step 2 - Approaches for Defining Global Market Size (Value, Volume* & Price*)

Note*: In applicable scenarios
Step 3 - Data Sources
Primary Research
- Web Analytics
- Survey Reports
- Research Institute
- Latest Research Reports
- Opinion Leaders
Secondary Research
- Annual Reports
- White Paper
- Latest Press Release
- Industry Association
- Paid Database
- Investor Presentations

Step 4 - Data Triangulation
Involves using different sources of information in order to increase the validity of a study
These sources are likely to be stakeholders in a program - participants, other researchers, program staff, other community members, and so on.
Then we put all data in single framework & apply various statistical tools to find out the dynamic on the market.
During the analysis stage, feedback from the stakeholder groups would be compared to determine areas of agreement as well as areas of divergence