

Key Insights
The global animal DR (Digital Radiography) imaging system market is experiencing robust growth, driven by increasing veterinary care spending, technological advancements in imaging technology, and a rising demand for improved diagnostic accuracy in animal healthcare. The market, currently valued at approximately $250 million in 2025, is projected to witness a Compound Annual Growth Rate (CAGR) of 8% from 2025 to 2033, reaching an estimated market size of $450 million by 2033. This growth is fueled by several key factors: the increasing adoption of digital imaging systems over traditional film-based methods, due to their superior image quality, faster processing times, and enhanced diagnostic capabilities; the expanding veterinary services market, driven by a growing pet owner population and increased pet humanization; and continuous technological improvements leading to smaller, more portable, and cost-effective DR systems, making them accessible to even smaller veterinary practices. Furthermore, the development of advanced software solutions for image analysis and storage contributes to market expansion.
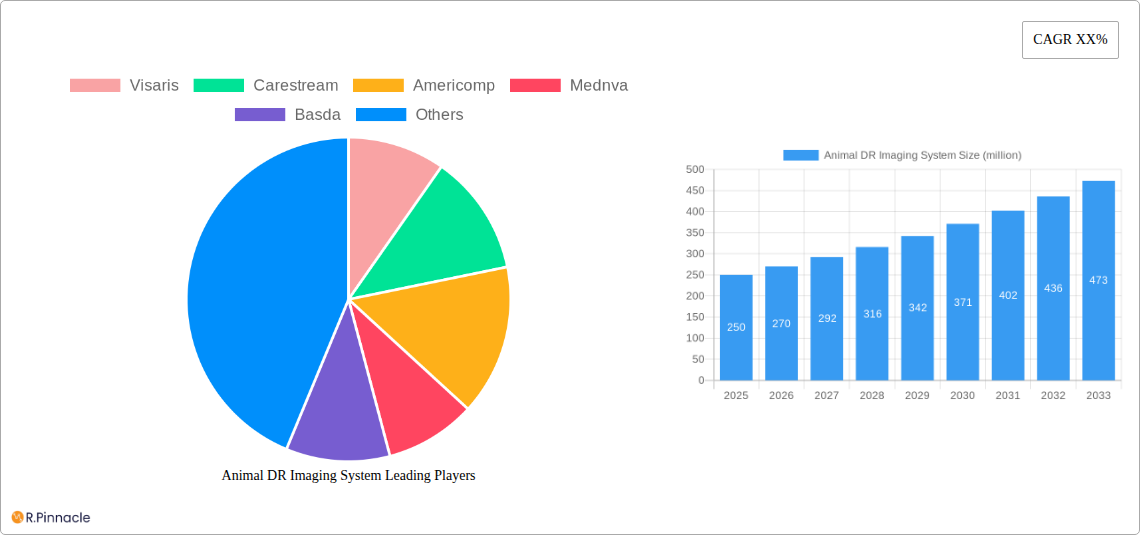
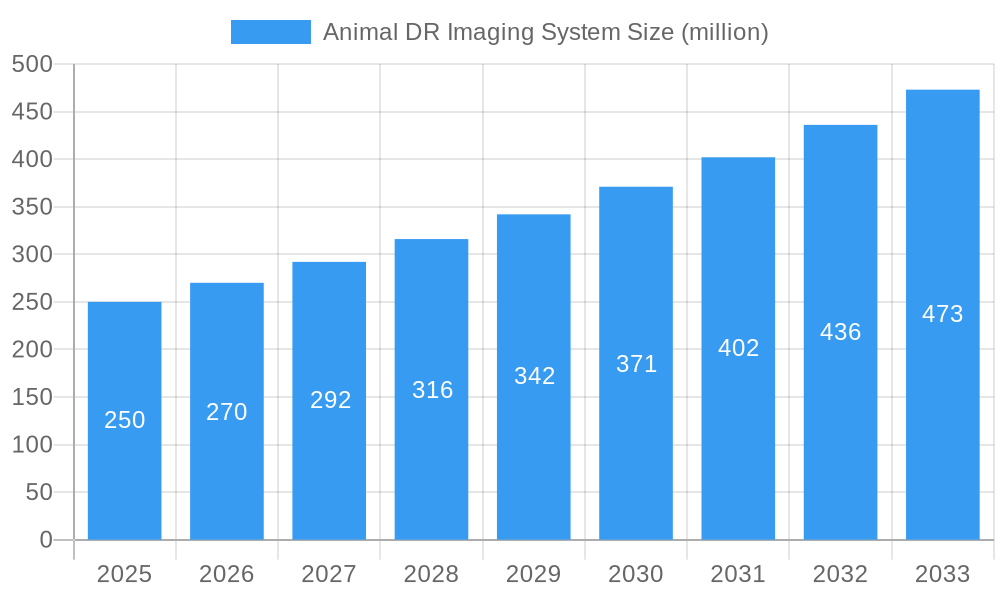
Animal DR Imaging System Market Size (In Million)
However, certain market restraints exist, including the high initial investment cost associated with acquiring and implementing DR systems, which may limit adoption among smaller veterinary clinics. Additionally, the need for specialized training and maintenance can pose a challenge. Nevertheless, the overall market trajectory remains positive, driven by a growing preference for advanced diagnostic technologies and the increasing focus on improving animal healthcare outcomes. Market segmentation suggests strong growth across all segments, with portable systems showing significant adoption rates. Leading companies like Visaris, Carestream, and others are strategically investing in research and development, aiming to introduce innovative and affordable systems to cater to the growing demand. The market shows promising opportunities in emerging economies where animal healthcare infrastructure is rapidly developing.
Animal DR Imaging System Company Market Share
Animal DR Imaging System Market Report: 2019-2033
This comprehensive report provides an in-depth analysis of the global Animal DR Imaging System market, offering actionable insights for industry professionals, investors, and stakeholders. The study period covers 2019-2033, with a base year of 2025 and a forecast period of 2025-2033. The report leverages extensive market research and data analysis to deliver a clear understanding of market dynamics, growth drivers, and future opportunities. The market value is expected to reach xx million by 2033.
Animal DR Imaging System Market Structure & Innovation Trends
The Animal DR Imaging System market is characterized by a moderately concentrated landscape, with key players including Visaris, Carestream, Americomp, Mednva, Basda, Examion, IBIS X Ray Systems, Heska, Air Techniques, Dawei Veterinary Medical, VetiX, Hallmarq, Veterinary X-rays, IMV Imaging, Celtic SMR, and Photon Surgical Systems Ltd. Market share data for 2025 reveals that Carestream holds approximately xx% of the market, followed by Visaris with xx%, and other players holding the remaining share.
Innovation is a key driver, spurred by advancements in digital imaging technology, the need for higher resolution images, and increasing demand for portable and wireless systems. Regulatory frameworks, varying by region, play a significant role in product development and market access. The primary product substitute is traditional film-based X-ray systems, although their market share is declining rapidly. The end-user demographic comprises veterinary clinics, animal hospitals, research institutions, and mobile veterinary services. M&A activity has been moderate in the past five years, with a total estimated deal value of approximately $xx million. Significant deals include (specific details unavailable).
Animal DR Imaging System Market Dynamics & Trends
The Animal DR Imaging System market exhibits robust growth, with a projected CAGR of xx% during the forecast period (2025-2033). This growth is driven by factors such as the increasing prevalence of pet ownership, rising veterinary healthcare spending, technological advancements leading to improved image quality and efficiency, and increasing adoption of digital imaging systems in developing economies.
Technological disruptions, particularly the development of AI-powered image analysis tools and portable, wireless DR systems, are reshaping the market landscape. Consumer preferences are shifting towards higher-resolution, faster imaging systems with improved ease of use and integration with veterinary practice management software. Competitive dynamics are characterized by both organic growth through product innovation and inorganic growth through mergers and acquisitions. Market penetration remains relatively high in developed regions but has significant potential in emerging markets with increasing veterinary infrastructure and healthcare spending.
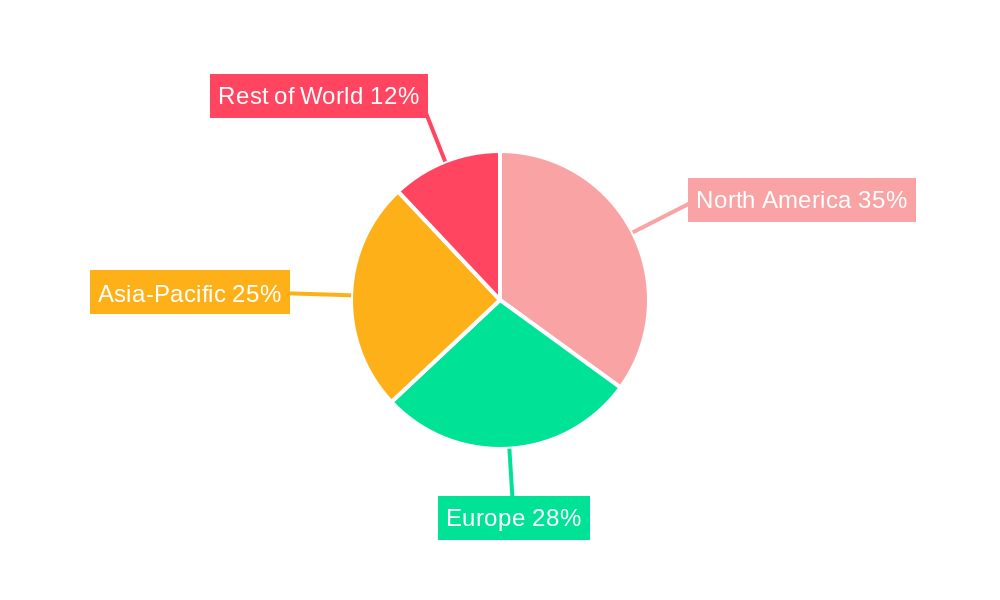
Dominant Regions & Segments in Animal DR Imaging System
North America currently dominates the Animal DR Imaging System market, driven by high veterinary healthcare expenditure, advanced veterinary infrastructure, and a high density of veterinary clinics and hospitals.
- Key Drivers in North America: High disposable incomes, advanced healthcare infrastructure, strong regulatory support, high pet ownership rates, and early adoption of new technologies.
Europe holds the second-largest market share, followed by Asia-Pacific, which is anticipated to experience the fastest growth during the forecast period. The large and growing pet population in this region combined with increasing investment in veterinary infrastructure are significant contributing factors.
Further regional analysis indicates that within the North American market, the United States holds the largest share, followed by Canada. Market segmentation by animal type reveals that the canine and feline segments hold the majority of market share, driven by their higher prevalence and greater healthcare spending.
Animal DR Imaging System Product Innovations
Recent product innovations include the development of portable and wireless DR systems, allowing for greater flexibility and convenience in various veterinary settings. Improved image processing algorithms and AI-powered image analysis tools enhance diagnostic accuracy and efficiency. Manufacturers are focusing on systems with improved radiation dose management to minimize the risk to both animals and veterinary staff. These innovations are driving market growth by improving the accessibility, speed, and quality of animal diagnostic imaging.
Report Scope & Segmentation Analysis
This report segments the Animal DR Imaging System market by region (North America, Europe, Asia-Pacific, Rest of the World), animal type (canine, feline, equine, bovine, other), system type (portable, fixed), and end-user (veterinary clinics, animal hospitals, research institutions, mobile veterinary services). Each segment's market size, growth projections, and competitive dynamics are thoroughly analyzed. For instance, the portable DR system segment is expected to demonstrate the highest CAGR due to its convenience and ease of use.
Key Drivers of Animal DR Imaging System Growth
Several factors are driving the growth of the Animal DR Imaging System market. Technological advancements leading to improved image quality, portability, and ease of use are key. Rising pet ownership rates and increasing veterinary healthcare spending globally are significant economic factors. Favorable regulatory environments in many regions are supporting market expansion. Furthermore, the increasing integration of DR systems into veterinary practice management software is enhancing efficiency and workflows.
Challenges in the Animal DR Imaging System Sector
The market faces challenges, including high initial investment costs for DR systems, which can be a barrier for smaller veterinary clinics. Supply chain disruptions, particularly the availability of specific components, can impact production and availability. Intense competition among established players and new entrants exerts pressure on pricing and profit margins. Regulatory hurdles and variations in regulatory standards across different regions also pose a challenge.
Emerging Opportunities in Animal DR Imaging System
Emerging opportunities lie in the development of AI-powered diagnostic tools that can automate image analysis and improve diagnostic accuracy. The expansion into underserved markets in developing countries holds significant potential. The integration of DR systems with other veterinary technologies, such as ultrasound and MRI, offers opportunities for comprehensive diagnostic solutions. Growth in the mobile veterinary services sector will also fuel demand for portable DR systems.
Leading Players in the Animal DR Imaging System Market
- Visaris
- Carestream
- Americomp
- Mednva
- Basda
- Examion
- IBIS X Ray Systems
- Heska
- Air Techniques
- Dawei Veterinary Medical
- VetiX
- Hallmarq
- Veterinary X-rays
- IMV Imaging
- Celtic SMR
- Photon Surgical Systems Ltd
Key Developments in Animal DR Imaging System Industry
- 2022 Q4: Carestream launched a new portable DR system with enhanced image quality.
- 2023 Q1: Visaris acquired a smaller competitor, expanding its market share.
- 2023 Q3: Mednva introduced AI-powered image analysis software for improved diagnostic accuracy. (Further details unavailable for other years).
Future Outlook for Animal DR Imaging System Market
The Animal DR Imaging System market is poised for continued growth, driven by technological advancements, increasing pet ownership, and rising veterinary healthcare spending. Strategic partnerships and collaborations among manufacturers and veterinary service providers will accelerate market adoption. The integration of AI and machine learning will improve diagnostic capabilities and efficiency. The market is expected to witness significant expansion across emerging economies in the coming years, creating further opportunities for growth and market consolidation.
Animal DR Imaging System Segmentation
-
1. Application
- 1.1. Pet Hospital
- 1.2. Pet Clinic
-
2. Types
- 2.1. Fixed
- 2.2. Mobile
Animal DR Imaging System Segmentation By Geography
-
1. North America
- 1.1. United States
- 1.2. Canada
- 1.3. Mexico
-
2. South America
- 2.1. Brazil
- 2.2. Argentina
- 2.3. Rest of South America
-
3. Europe
- 3.1. United Kingdom
- 3.2. Germany
- 3.3. France
- 3.4. Italy
- 3.5. Spain
- 3.6. Russia
- 3.7. Benelux
- 3.8. Nordics
- 3.9. Rest of Europe
-
4. Middle East & Africa
- 4.1. Turkey
- 4.2. Israel
- 4.3. GCC
- 4.4. North Africa
- 4.5. South Africa
- 4.6. Rest of Middle East & Africa
-
5. Asia Pacific
- 5.1. China
- 5.2. India
- 5.3. Japan
- 5.4. South Korea
- 5.5. ASEAN
- 5.6. Oceania
- 5.7. Rest of Asia Pacific
Animal DR Imaging System Regional Market Share
Geographic Coverage of Animal DR Imaging System
Animal DR Imaging System REPORT HIGHLIGHTS
| Aspects | Details |
|---|---|
| Study Period | 2020-2034 |
| Base Year | 2025 |
| Estimated Year | 2026 |
| Forecast Period | 2026-2034 |
| Historical Period | 2020-2025 |
| Growth Rate | CAGR of 7.84% from 2020-2034 |
| Segmentation |
|
Table of Contents
- 1. Introduction
- 1.1. Research Scope
- 1.2. Market Segmentation
- 1.3. Research Objective
- 1.4. Definitions and Assumptions
- 2. Executive Summary
- 2.1. Market Snapshot
- 3. Market Dynamics
- 3.1. Market Drivers
- 3.2. Market Restrains
- 3.3. Market Trends
- 3.4. Market Opportunities
- 4. Market Factor Analysis
- 4.1. Porters Five Forces
- 4.1.1. Bargaining Power of Suppliers
- 4.1.2. Bargaining Power of Buyers
- 4.1.3. Threat of New Entrants
- 4.1.4. Threat of Substitutes
- 4.1.5. Competitive Rivalry
- 4.2. PESTEL analysis
- 4.3. BCG Analysis
- 4.3.1. Stars (High Growth, High Market Share)
- 4.3.2. Cash Cows (Low Growth, High Market Share)
- 4.3.3. Question Mark (High Growth, Low Market Share)
- 4.3.4. Dogs (Low Growth, Low Market Share)
- 4.4. Ansoff Matrix Analysis
- 4.5. Supply Chain Analysis
- 4.6. Regulatory Landscape
- 4.7. Current Market Potential and Opportunity Assessment (TAM–SAM–SOM Framework)
- 4.8. PRI Analyst Note
- 4.1. Porters Five Forces
- 5. Market Analysis, Insights and Forecast 2021-2033
- 5.1. Market Analysis, Insights and Forecast - by Application
- 5.1.1. Pet Hospital
- 5.1.2. Pet Clinic
- 5.2. Market Analysis, Insights and Forecast - by Types
- 5.2.1. Fixed
- 5.2.2. Mobile
- 5.3. Market Analysis, Insights and Forecast - by Region
- 5.3.1. North America
- 5.3.2. South America
- 5.3.3. Europe
- 5.3.4. Middle East & Africa
- 5.3.5. Asia Pacific
- 5.1. Market Analysis, Insights and Forecast - by Application
- 6. Global Animal DR Imaging System Analysis, Insights and Forecast, 2021-2033
- 6.1. Market Analysis, Insights and Forecast - by Application
- 6.1.1. Pet Hospital
- 6.1.2. Pet Clinic
- 6.2. Market Analysis, Insights and Forecast - by Types
- 6.2.1. Fixed
- 6.2.2. Mobile
- 6.1. Market Analysis, Insights and Forecast - by Application
- 7. North America Animal DR Imaging System Analysis, Insights and Forecast, 2020-2032
- 7.1. Market Analysis, Insights and Forecast - by Application
- 7.1.1. Pet Hospital
- 7.1.2. Pet Clinic
- 7.2. Market Analysis, Insights and Forecast - by Types
- 7.2.1. Fixed
- 7.2.2. Mobile
- 7.1. Market Analysis, Insights and Forecast - by Application
- 8. South America Animal DR Imaging System Analysis, Insights and Forecast, 2020-2032
- 8.1. Market Analysis, Insights and Forecast - by Application
- 8.1.1. Pet Hospital
- 8.1.2. Pet Clinic
- 8.2. Market Analysis, Insights and Forecast - by Types
- 8.2.1. Fixed
- 8.2.2. Mobile
- 8.1. Market Analysis, Insights and Forecast - by Application
- 9. Europe Animal DR Imaging System Analysis, Insights and Forecast, 2020-2032
- 9.1. Market Analysis, Insights and Forecast - by Application
- 9.1.1. Pet Hospital
- 9.1.2. Pet Clinic
- 9.2. Market Analysis, Insights and Forecast - by Types
- 9.2.1. Fixed
- 9.2.2. Mobile
- 9.1. Market Analysis, Insights and Forecast - by Application
- 10. Middle East & Africa Animal DR Imaging System Analysis, Insights and Forecast, 2020-2032
- 10.1. Market Analysis, Insights and Forecast - by Application
- 10.1.1. Pet Hospital
- 10.1.2. Pet Clinic
- 10.2. Market Analysis, Insights and Forecast - by Types
- 10.2.1. Fixed
- 10.2.2. Mobile
- 10.1. Market Analysis, Insights and Forecast - by Application
- 11. Asia Pacific Animal DR Imaging System Analysis, Insights and Forecast, 2020-2032
- 11.1. Market Analysis, Insights and Forecast - by Application
- 11.1.1. Pet Hospital
- 11.1.2. Pet Clinic
- 11.2. Market Analysis, Insights and Forecast - by Types
- 11.2.1. Fixed
- 11.2.2. Mobile
- 11.1. Market Analysis, Insights and Forecast - by Application
- 12. Competitive Analysis
- 12.1. Company Profiles
- 12.1.1 Visaris
- 12.1.1.1. Company Overview
- 12.1.1.2. Products
- 12.1.1.3. Company Financials
- 12.1.1.4. SWOT Analysis
- 12.1.2 Carestream
- 12.1.2.1. Company Overview
- 12.1.2.2. Products
- 12.1.2.3. Company Financials
- 12.1.2.4. SWOT Analysis
- 12.1.3 Americomp
- 12.1.3.1. Company Overview
- 12.1.3.2. Products
- 12.1.3.3. Company Financials
- 12.1.3.4. SWOT Analysis
- 12.1.4 Mednva
- 12.1.4.1. Company Overview
- 12.1.4.2. Products
- 12.1.4.3. Company Financials
- 12.1.4.4. SWOT Analysis
- 12.1.5 Basda
- 12.1.5.1. Company Overview
- 12.1.5.2. Products
- 12.1.5.3. Company Financials
- 12.1.5.4. SWOT Analysis
- 12.1.6 Examion
- 12.1.6.1. Company Overview
- 12.1.6.2. Products
- 12.1.6.3. Company Financials
- 12.1.6.4. SWOT Analysis
- 12.1.7 IBIS X Ray Systems
- 12.1.7.1. Company Overview
- 12.1.7.2. Products
- 12.1.7.3. Company Financials
- 12.1.7.4. SWOT Analysis
- 12.1.8 Heska
- 12.1.8.1. Company Overview
- 12.1.8.2. Products
- 12.1.8.3. Company Financials
- 12.1.8.4. SWOT Analysis
- 12.1.9 Air Techniques
- 12.1.9.1. Company Overview
- 12.1.9.2. Products
- 12.1.9.3. Company Financials
- 12.1.9.4. SWOT Analysis
- 12.1.10 Dawei Veterinary Medical
- 12.1.10.1. Company Overview
- 12.1.10.2. Products
- 12.1.10.3. Company Financials
- 12.1.10.4. SWOT Analysis
- 12.1.11 VetiX
- 12.1.11.1. Company Overview
- 12.1.11.2. Products
- 12.1.11.3. Company Financials
- 12.1.11.4. SWOT Analysis
- 12.1.12 Hallmarq
- 12.1.12.1. Company Overview
- 12.1.12.2. Products
- 12.1.12.3. Company Financials
- 12.1.12.4. SWOT Analysis
- 12.1.13 Veterinary X-rays
- 12.1.13.1. Company Overview
- 12.1.13.2. Products
- 12.1.13.3. Company Financials
- 12.1.13.4. SWOT Analysis
- 12.1.14 IMV Imaging
- 12.1.14.1. Company Overview
- 12.1.14.2. Products
- 12.1.14.3. Company Financials
- 12.1.14.4. SWOT Analysis
- 12.1.15 Celtic SMR
- 12.1.15.1. Company Overview
- 12.1.15.2. Products
- 12.1.15.3. Company Financials
- 12.1.15.4. SWOT Analysis
- 12.1.16 Photon Surgical Systems Ltd
- 12.1.16.1. Company Overview
- 12.1.16.2. Products
- 12.1.16.3. Company Financials
- 12.1.16.4. SWOT Analysis
- 12.1.1 Visaris
- 12.2. Market Entropy
- 12.2.1 Company's Key Areas Served
- 12.2.2 Recent Developments
- 12.3. Company Market Share Analysis 2025
- 12.3.1 Top 5 Companies Market Share Analysis
- 12.3.2 Top 3 Companies Market Share Analysis
- 12.4. List of Potential Customers
- 13. Research Methodology
List of Figures
- Figure 1: Global Animal DR Imaging System Revenue Breakdown (undefined, %) by Region 2025 & 2033
- Figure 2: Global Animal DR Imaging System Volume Breakdown (K, %) by Region 2025 & 2033
- Figure 3: North America Animal DR Imaging System Revenue (undefined), by Application 2025 & 2033
- Figure 4: North America Animal DR Imaging System Volume (K), by Application 2025 & 2033
- Figure 5: North America Animal DR Imaging System Revenue Share (%), by Application 2025 & 2033
- Figure 6: North America Animal DR Imaging System Volume Share (%), by Application 2025 & 2033
- Figure 7: North America Animal DR Imaging System Revenue (undefined), by Types 2025 & 2033
- Figure 8: North America Animal DR Imaging System Volume (K), by Types 2025 & 2033
- Figure 9: North America Animal DR Imaging System Revenue Share (%), by Types 2025 & 2033
- Figure 10: North America Animal DR Imaging System Volume Share (%), by Types 2025 & 2033
- Figure 11: North America Animal DR Imaging System Revenue (undefined), by Country 2025 & 2033
- Figure 12: North America Animal DR Imaging System Volume (K), by Country 2025 & 2033
- Figure 13: North America Animal DR Imaging System Revenue Share (%), by Country 2025 & 2033
- Figure 14: North America Animal DR Imaging System Volume Share (%), by Country 2025 & 2033
- Figure 15: South America Animal DR Imaging System Revenue (undefined), by Application 2025 & 2033
- Figure 16: South America Animal DR Imaging System Volume (K), by Application 2025 & 2033
- Figure 17: South America Animal DR Imaging System Revenue Share (%), by Application 2025 & 2033
- Figure 18: South America Animal DR Imaging System Volume Share (%), by Application 2025 & 2033
- Figure 19: South America Animal DR Imaging System Revenue (undefined), by Types 2025 & 2033
- Figure 20: South America Animal DR Imaging System Volume (K), by Types 2025 & 2033
- Figure 21: South America Animal DR Imaging System Revenue Share (%), by Types 2025 & 2033
- Figure 22: South America Animal DR Imaging System Volume Share (%), by Types 2025 & 2033
- Figure 23: South America Animal DR Imaging System Revenue (undefined), by Country 2025 & 2033
- Figure 24: South America Animal DR Imaging System Volume (K), by Country 2025 & 2033
- Figure 25: South America Animal DR Imaging System Revenue Share (%), by Country 2025 & 2033
- Figure 26: South America Animal DR Imaging System Volume Share (%), by Country 2025 & 2033
- Figure 27: Europe Animal DR Imaging System Revenue (undefined), by Application 2025 & 2033
- Figure 28: Europe Animal DR Imaging System Volume (K), by Application 2025 & 2033
- Figure 29: Europe Animal DR Imaging System Revenue Share (%), by Application 2025 & 2033
- Figure 30: Europe Animal DR Imaging System Volume Share (%), by Application 2025 & 2033
- Figure 31: Europe Animal DR Imaging System Revenue (undefined), by Types 2025 & 2033
- Figure 32: Europe Animal DR Imaging System Volume (K), by Types 2025 & 2033
- Figure 33: Europe Animal DR Imaging System Revenue Share (%), by Types 2025 & 2033
- Figure 34: Europe Animal DR Imaging System Volume Share (%), by Types 2025 & 2033
- Figure 35: Europe Animal DR Imaging System Revenue (undefined), by Country 2025 & 2033
- Figure 36: Europe Animal DR Imaging System Volume (K), by Country 2025 & 2033
- Figure 37: Europe Animal DR Imaging System Revenue Share (%), by Country 2025 & 2033
- Figure 38: Europe Animal DR Imaging System Volume Share (%), by Country 2025 & 2033
- Figure 39: Middle East & Africa Animal DR Imaging System Revenue (undefined), by Application 2025 & 2033
- Figure 40: Middle East & Africa Animal DR Imaging System Volume (K), by Application 2025 & 2033
- Figure 41: Middle East & Africa Animal DR Imaging System Revenue Share (%), by Application 2025 & 2033
- Figure 42: Middle East & Africa Animal DR Imaging System Volume Share (%), by Application 2025 & 2033
- Figure 43: Middle East & Africa Animal DR Imaging System Revenue (undefined), by Types 2025 & 2033
- Figure 44: Middle East & Africa Animal DR Imaging System Volume (K), by Types 2025 & 2033
- Figure 45: Middle East & Africa Animal DR Imaging System Revenue Share (%), by Types 2025 & 2033
- Figure 46: Middle East & Africa Animal DR Imaging System Volume Share (%), by Types 2025 & 2033
- Figure 47: Middle East & Africa Animal DR Imaging System Revenue (undefined), by Country 2025 & 2033
- Figure 48: Middle East & Africa Animal DR Imaging System Volume (K), by Country 2025 & 2033
- Figure 49: Middle East & Africa Animal DR Imaging System Revenue Share (%), by Country 2025 & 2033
- Figure 50: Middle East & Africa Animal DR Imaging System Volume Share (%), by Country 2025 & 2033
- Figure 51: Asia Pacific Animal DR Imaging System Revenue (undefined), by Application 2025 & 2033
- Figure 52: Asia Pacific Animal DR Imaging System Volume (K), by Application 2025 & 2033
- Figure 53: Asia Pacific Animal DR Imaging System Revenue Share (%), by Application 2025 & 2033
- Figure 54: Asia Pacific Animal DR Imaging System Volume Share (%), by Application 2025 & 2033
- Figure 55: Asia Pacific Animal DR Imaging System Revenue (undefined), by Types 2025 & 2033
- Figure 56: Asia Pacific Animal DR Imaging System Volume (K), by Types 2025 & 2033
- Figure 57: Asia Pacific Animal DR Imaging System Revenue Share (%), by Types 2025 & 2033
- Figure 58: Asia Pacific Animal DR Imaging System Volume Share (%), by Types 2025 & 2033
- Figure 59: Asia Pacific Animal DR Imaging System Revenue (undefined), by Country 2025 & 2033
- Figure 60: Asia Pacific Animal DR Imaging System Volume (K), by Country 2025 & 2033
- Figure 61: Asia Pacific Animal DR Imaging System Revenue Share (%), by Country 2025 & 2033
- Figure 62: Asia Pacific Animal DR Imaging System Volume Share (%), by Country 2025 & 2033
List of Tables
- Table 1: Global Animal DR Imaging System Revenue undefined Forecast, by Application 2020 & 2033
- Table 2: Global Animal DR Imaging System Volume K Forecast, by Application 2020 & 2033
- Table 3: Global Animal DR Imaging System Revenue undefined Forecast, by Types 2020 & 2033
- Table 4: Global Animal DR Imaging System Volume K Forecast, by Types 2020 & 2033
- Table 5: Global Animal DR Imaging System Revenue undefined Forecast, by Region 2020 & 2033
- Table 6: Global Animal DR Imaging System Volume K Forecast, by Region 2020 & 2033
- Table 7: Global Animal DR Imaging System Revenue undefined Forecast, by Application 2020 & 2033
- Table 8: Global Animal DR Imaging System Volume K Forecast, by Application 2020 & 2033
- Table 9: Global Animal DR Imaging System Revenue undefined Forecast, by Types 2020 & 2033
- Table 10: Global Animal DR Imaging System Volume K Forecast, by Types 2020 & 2033
- Table 11: Global Animal DR Imaging System Revenue undefined Forecast, by Country 2020 & 2033
- Table 12: Global Animal DR Imaging System Volume K Forecast, by Country 2020 & 2033
- Table 13: United States Animal DR Imaging System Revenue (undefined) Forecast, by Application 2020 & 2033
- Table 14: United States Animal DR Imaging System Volume (K) Forecast, by Application 2020 & 2033
- Table 15: Canada Animal DR Imaging System Revenue (undefined) Forecast, by Application 2020 & 2033
- Table 16: Canada Animal DR Imaging System Volume (K) Forecast, by Application 2020 & 2033
- Table 17: Mexico Animal DR Imaging System Revenue (undefined) Forecast, by Application 2020 & 2033
- Table 18: Mexico Animal DR Imaging System Volume (K) Forecast, by Application 2020 & 2033
- Table 19: Global Animal DR Imaging System Revenue undefined Forecast, by Application 2020 & 2033
- Table 20: Global Animal DR Imaging System Volume K Forecast, by Application 2020 & 2033
- Table 21: Global Animal DR Imaging System Revenue undefined Forecast, by Types 2020 & 2033
- Table 22: Global Animal DR Imaging System Volume K Forecast, by Types 2020 & 2033
- Table 23: Global Animal DR Imaging System Revenue undefined Forecast, by Country 2020 & 2033
- Table 24: Global Animal DR Imaging System Volume K Forecast, by Country 2020 & 2033
- Table 25: Brazil Animal DR Imaging System Revenue (undefined) Forecast, by Application 2020 & 2033
- Table 26: Brazil Animal DR Imaging System Volume (K) Forecast, by Application 2020 & 2033
- Table 27: Argentina Animal DR Imaging System Revenue (undefined) Forecast, by Application 2020 & 2033
- Table 28: Argentina Animal DR Imaging System Volume (K) Forecast, by Application 2020 & 2033
- Table 29: Rest of South America Animal DR Imaging System Revenue (undefined) Forecast, by Application 2020 & 2033
- Table 30: Rest of South America Animal DR Imaging System Volume (K) Forecast, by Application 2020 & 2033
- Table 31: Global Animal DR Imaging System Revenue undefined Forecast, by Application 2020 & 2033
- Table 32: Global Animal DR Imaging System Volume K Forecast, by Application 2020 & 2033
- Table 33: Global Animal DR Imaging System Revenue undefined Forecast, by Types 2020 & 2033
- Table 34: Global Animal DR Imaging System Volume K Forecast, by Types 2020 & 2033
- Table 35: Global Animal DR Imaging System Revenue undefined Forecast, by Country 2020 & 2033
- Table 36: Global Animal DR Imaging System Volume K Forecast, by Country 2020 & 2033
- Table 37: United Kingdom Animal DR Imaging System Revenue (undefined) Forecast, by Application 2020 & 2033
- Table 38: United Kingdom Animal DR Imaging System Volume (K) Forecast, by Application 2020 & 2033
- Table 39: Germany Animal DR Imaging System Revenue (undefined) Forecast, by Application 2020 & 2033
- Table 40: Germany Animal DR Imaging System Volume (K) Forecast, by Application 2020 & 2033
- Table 41: France Animal DR Imaging System Revenue (undefined) Forecast, by Application 2020 & 2033
- Table 42: France Animal DR Imaging System Volume (K) Forecast, by Application 2020 & 2033
- Table 43: Italy Animal DR Imaging System Revenue (undefined) Forecast, by Application 2020 & 2033
- Table 44: Italy Animal DR Imaging System Volume (K) Forecast, by Application 2020 & 2033
- Table 45: Spain Animal DR Imaging System Revenue (undefined) Forecast, by Application 2020 & 2033
- Table 46: Spain Animal DR Imaging System Volume (K) Forecast, by Application 2020 & 2033
- Table 47: Russia Animal DR Imaging System Revenue (undefined) Forecast, by Application 2020 & 2033
- Table 48: Russia Animal DR Imaging System Volume (K) Forecast, by Application 2020 & 2033
- Table 49: Benelux Animal DR Imaging System Revenue (undefined) Forecast, by Application 2020 & 2033
- Table 50: Benelux Animal DR Imaging System Volume (K) Forecast, by Application 2020 & 2033
- Table 51: Nordics Animal DR Imaging System Revenue (undefined) Forecast, by Application 2020 & 2033
- Table 52: Nordics Animal DR Imaging System Volume (K) Forecast, by Application 2020 & 2033
- Table 53: Rest of Europe Animal DR Imaging System Revenue (undefined) Forecast, by Application 2020 & 2033
- Table 54: Rest of Europe Animal DR Imaging System Volume (K) Forecast, by Application 2020 & 2033
- Table 55: Global Animal DR Imaging System Revenue undefined Forecast, by Application 2020 & 2033
- Table 56: Global Animal DR Imaging System Volume K Forecast, by Application 2020 & 2033
- Table 57: Global Animal DR Imaging System Revenue undefined Forecast, by Types 2020 & 2033
- Table 58: Global Animal DR Imaging System Volume K Forecast, by Types 2020 & 2033
- Table 59: Global Animal DR Imaging System Revenue undefined Forecast, by Country 2020 & 2033
- Table 60: Global Animal DR Imaging System Volume K Forecast, by Country 2020 & 2033
- Table 61: Turkey Animal DR Imaging System Revenue (undefined) Forecast, by Application 2020 & 2033
- Table 62: Turkey Animal DR Imaging System Volume (K) Forecast, by Application 2020 & 2033
- Table 63: Israel Animal DR Imaging System Revenue (undefined) Forecast, by Application 2020 & 2033
- Table 64: Israel Animal DR Imaging System Volume (K) Forecast, by Application 2020 & 2033
- Table 65: GCC Animal DR Imaging System Revenue (undefined) Forecast, by Application 2020 & 2033
- Table 66: GCC Animal DR Imaging System Volume (K) Forecast, by Application 2020 & 2033
- Table 67: North Africa Animal DR Imaging System Revenue (undefined) Forecast, by Application 2020 & 2033
- Table 68: North Africa Animal DR Imaging System Volume (K) Forecast, by Application 2020 & 2033
- Table 69: South Africa Animal DR Imaging System Revenue (undefined) Forecast, by Application 2020 & 2033
- Table 70: South Africa Animal DR Imaging System Volume (K) Forecast, by Application 2020 & 2033
- Table 71: Rest of Middle East & Africa Animal DR Imaging System Revenue (undefined) Forecast, by Application 2020 & 2033
- Table 72: Rest of Middle East & Africa Animal DR Imaging System Volume (K) Forecast, by Application 2020 & 2033
- Table 73: Global Animal DR Imaging System Revenue undefined Forecast, by Application 2020 & 2033
- Table 74: Global Animal DR Imaging System Volume K Forecast, by Application 2020 & 2033
- Table 75: Global Animal DR Imaging System Revenue undefined Forecast, by Types 2020 & 2033
- Table 76: Global Animal DR Imaging System Volume K Forecast, by Types 2020 & 2033
- Table 77: Global Animal DR Imaging System Revenue undefined Forecast, by Country 2020 & 2033
- Table 78: Global Animal DR Imaging System Volume K Forecast, by Country 2020 & 2033
- Table 79: China Animal DR Imaging System Revenue (undefined) Forecast, by Application 2020 & 2033
- Table 80: China Animal DR Imaging System Volume (K) Forecast, by Application 2020 & 2033
- Table 81: India Animal DR Imaging System Revenue (undefined) Forecast, by Application 2020 & 2033
- Table 82: India Animal DR Imaging System Volume (K) Forecast, by Application 2020 & 2033
- Table 83: Japan Animal DR Imaging System Revenue (undefined) Forecast, by Application 2020 & 2033
- Table 84: Japan Animal DR Imaging System Volume (K) Forecast, by Application 2020 & 2033
- Table 85: South Korea Animal DR Imaging System Revenue (undefined) Forecast, by Application 2020 & 2033
- Table 86: South Korea Animal DR Imaging System Volume (K) Forecast, by Application 2020 & 2033
- Table 87: ASEAN Animal DR Imaging System Revenue (undefined) Forecast, by Application 2020 & 2033
- Table 88: ASEAN Animal DR Imaging System Volume (K) Forecast, by Application 2020 & 2033
- Table 89: Oceania Animal DR Imaging System Revenue (undefined) Forecast, by Application 2020 & 2033
- Table 90: Oceania Animal DR Imaging System Volume (K) Forecast, by Application 2020 & 2033
- Table 91: Rest of Asia Pacific Animal DR Imaging System Revenue (undefined) Forecast, by Application 2020 & 2033
- Table 92: Rest of Asia Pacific Animal DR Imaging System Volume (K) Forecast, by Application 2020 & 2033
Frequently Asked Questions
1. What is the projected Compound Annual Growth Rate (CAGR) of the Animal DR Imaging System?
The projected CAGR is approximately 7.84%.
2. Which companies are prominent players in the Animal DR Imaging System?
Key companies in the market include Visaris, Carestream, Americomp, Mednva, Basda, Examion, IBIS X Ray Systems, Heska, Air Techniques, Dawei Veterinary Medical, VetiX, Hallmarq, Veterinary X-rays, IMV Imaging, Celtic SMR, Photon Surgical Systems Ltd.
3. What are the main segments of the Animal DR Imaging System?
The market segments include Application, Types.
4. Can you provide details about the market size?
The market size is estimated to be USD XXX N/A as of 2022.
5. What are some drivers contributing to market growth?
N/A
6. What are the notable trends driving market growth?
N/A
7. Are there any restraints impacting market growth?
N/A
8. Can you provide examples of recent developments in the market?
N/A
9. What pricing options are available for accessing the report?
Pricing options include single-user, multi-user, and enterprise licenses priced at USD 3950.00, USD 5925.00, and USD 7900.00 respectively.
10. Is the market size provided in terms of value or volume?
The market size is provided in terms of value, measured in N/A and volume, measured in K.
11. Are there any specific market keywords associated with the report?
Yes, the market keyword associated with the report is "Animal DR Imaging System," which aids in identifying and referencing the specific market segment covered.
12. How do I determine which pricing option suits my needs best?
The pricing options vary based on user requirements and access needs. Individual users may opt for single-user licenses, while businesses requiring broader access may choose multi-user or enterprise licenses for cost-effective access to the report.
13. Are there any additional resources or data provided in the Animal DR Imaging System report?
While the report offers comprehensive insights, it's advisable to review the specific contents or supplementary materials provided to ascertain if additional resources or data are available.
14. How can I stay updated on further developments or reports in the Animal DR Imaging System?
To stay informed about further developments, trends, and reports in the Animal DR Imaging System, consider subscribing to industry newsletters, following relevant companies and organizations, or regularly checking reputable industry news sources and publications.
Methodology
Step 1 - Identification of Relevant Samples Size from Population Database


Step 2 - Approaches for Defining Global Market Size (Value, Volume* & Price*)

Note*: In applicable scenarios
Step 3 - Data Sources
Primary Research
- Web Analytics
- Survey Reports
- Research Institute
- Latest Research Reports
- Opinion Leaders
Secondary Research
- Annual Reports
- White Paper
- Latest Press Release
- Industry Association
- Paid Database
- Investor Presentations

Step 4 - Data Triangulation
Involves using different sources of information in order to increase the validity of a study
These sources are likely to be stakeholders in a program - participants, other researchers, program staff, other community members, and so on.
Then we put all data in single framework & apply various statistical tools to find out the dynamic on the market.
During the analysis stage, feedback from the stakeholder groups would be compared to determine areas of agreement as well as areas of divergence