

Key Insights
The global anti-counterfeit packaging market is poised for substantial expansion, driven by escalating concerns over product authenticity and brand integrity across numerous industries. The market, valued at $204.08 billion in the base year 2025, is projected to grow at a compound annual growth rate (CAGR) of 9.4%. Key growth catalysts include the rising prevalence of counterfeiting, particularly within the food & beverage, pharmaceutical, and consumer electronics sectors, necessitating advanced security solutions. Innovations in traceability, track-and-trace systems, tamper-evident packaging, and covert markers are key drivers. The availability of diverse technologies, such as RFID, QR codes, holograms, and DNA tagging, addresses varying security requirements and budgets. While North America and Europe currently lead market share, the Asia Pacific region is anticipated to experience significant growth due to increasing consumer awareness and stricter regulatory environments.
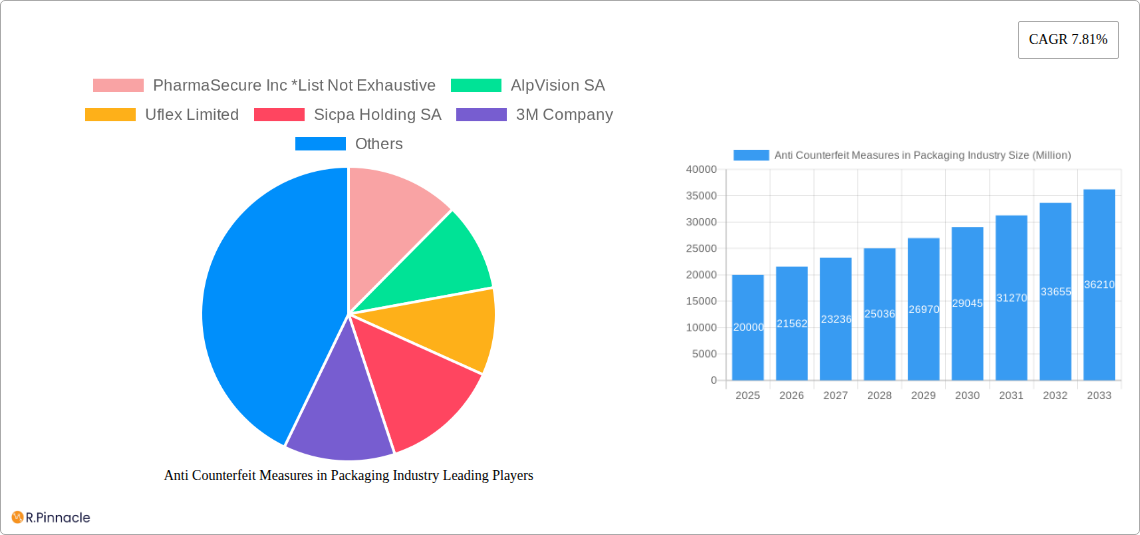
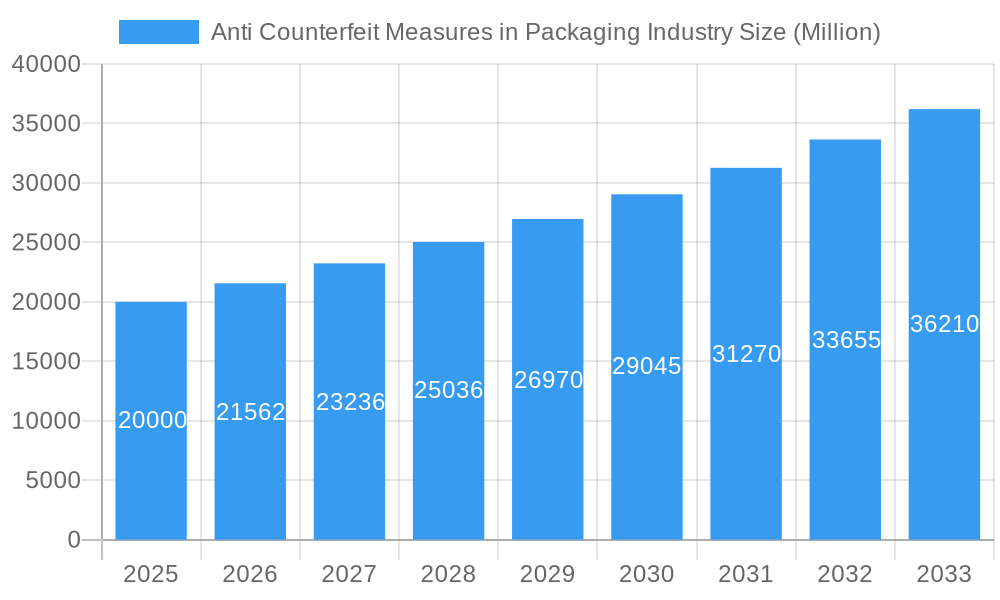
Anti Counterfeit Measures in Packaging Industry Market Size (In Billion)
Market segmentation highlights a strong emphasis on technology types, with track-and-trace and tamper-evident solutions currently dominating. However, demand for sophisticated covert and forensic markers is on the rise, indicating a strategic shift towards proactive anti-counterfeiting measures. The end-user landscape is diverse, with the food & beverage and healthcare & pharmaceuticals sectors leading demand for secure packaging solutions. The industry features prominent players like PharmaSecure Inc., AlpVision SA, and Uflex Limited, actively innovating and expanding their offerings. Despite promising growth, challenges such as high initial investment costs for advanced technologies and supply chain integration complexities persist. Future expansion hinges on continued technological innovation, enhanced regulatory oversight, and increased consumer awareness of product counterfeiting.
Anti Counterfeit Measures in Packaging Industry Company Market Share
This comprehensive analysis of the Anti-Counterfeit Packaging market offers critical insights for industry professionals, investors, and stakeholders. It provides a detailed examination of market dynamics, technological advancements, and key players, essential for navigating this dynamic sector. The report covers the historical period 2019-2024, with 2025 designated as the base and estimated year. The forecast period extends from 2025 to 2033.
Anti-Counterfeit Measures in Packaging Industry Market Structure & Innovation Trends
This section analyzes the market's competitive landscape, innovation drivers, regulatory influences, and market dynamics. The market is characterized by a mix of large multinational corporations and specialized smaller firms. Market concentration is moderate, with the top five players holding an estimated xx% market share in 2025. Significant M&A activity, exemplified by Avery Dennison Corporation's USD 1.45 Billion acquisition of Vestcom in August 2021, demonstrates the industry's consolidation trend and pursuit of broader market reach.
- Market Concentration: Moderate, top 5 players holding approximately xx% market share (2025).
- Innovation Drivers: Growing consumer awareness of counterfeits, stringent government regulations, and technological advancements in track-and-trace systems.
- Regulatory Frameworks: Vary widely across regions, influencing adoption rates and technological choices. Stringent regulations in the pharmaceutical sector drive higher adoption of sophisticated anti-counterfeiting technologies.
- Product Substitutes: Limited direct substitutes; however, the effectiveness and cost-efficiency of different technologies influence adoption choices.
- End-User Demographics: The healthcare and pharmaceutical sector is a major driver, followed by the food and beverage and consumer electronics industries.
- M&A Activity: Significant consolidation, with deals valued at USD xx Billion in the last five years. Strategic acquisitions aim to expand product portfolios, geographic reach, and technological capabilities. Examples include Avery Dennison Corporation's acquisition of Vestcom.
Anti-Counterfeit Measures in Packaging Industry Market Dynamics & Trends
The anti-counterfeit measures market is experiencing robust growth, driven by a rising incidence of counterfeiting across various industries. Technological advancements, increasing consumer demand for authenticity, and supportive government regulations are key growth catalysts. The market is projected to experience a CAGR of xx% during the forecast period (2025-2033). Market penetration for advanced technologies like blockchain-based track-and-trace solutions is still relatively low but shows significant growth potential. Competitive dynamics are characterized by both intense competition among established players and the emergence of innovative start-ups.
Dominant Regions & Segments in Anti-Counterfeit Measures in Packaging Industry
North America currently holds the largest market share, driven by stringent regulatory frameworks and high consumer awareness. However, Asia-Pacific is projected to experience the fastest growth due to increasing economic development and rising consumer spending.
By Technology:
- Trace and Track: Dominant segment due to increasing demand for supply chain transparency and product authentication.
- Tamper-evident: High adoption across various sectors due to its cost-effectiveness and ease of implementation.
- Covert: Growing adoption driven by its ability to deter counterfeiting attempts through hidden security features.
- Overt: Widely adopted, providing visible security features to consumers.
- Forensic Markers: Niche segment with growing application in high-value products and investigations.
By End User:
- Healthcare and Pharmaceuticals: Largest segment due to strict regulations and the high value of products.
- Food and Beverage: Significant segment driven by rising consumer concerns regarding food safety and authenticity.
- Industrial and Automotive: Growing segment as manufacturers seek to protect their brand reputation and prevent counterfeit parts from entering the supply chain.
- Consumer Electronics: Growing adoption due to the prevalence of counterfeit electronics in the market.
Key Drivers (vary by region and segment):
- Strong regulatory frameworks and enforcement
- High consumer awareness and demand for authenticity
- Increasing e-commerce and cross-border trade
- Technological advancements in anti-counterfeiting technologies
Anti-Counterfeit Measures in Packaging Industry Product Innovations
Recent innovations include the integration of advanced technologies such as blockchain, AI, and RFID into anti-counterfeit solutions. These technologies offer enhanced traceability, security, and consumer engagement. The market is witnessing a shift towards more sophisticated and integrated solutions that provide a holistic approach to combating counterfeiting, moving beyond simple tamper-evident seals. This trend reflects the increasing sophistication of counterfeiting techniques.
Report Scope & Segmentation Analysis
This report segments the anti-counterfeit measures market by technology (Trace and Track, Tamper-evident, Covert, Overt, Forensic Markers) and end-user (Food and Beverage, Healthcare and Pharmaceuticals, Industrial and Automotive, Consumer Electronics, Other End Users). Each segment is analyzed in detail, including market size, growth projections, and competitive dynamics. Growth projections vary significantly across segments and are influenced by factors such as technological advancements, regulatory changes, and consumer preferences. Competitive dynamics are shaped by technological innovation, pricing strategies, and brand reputation.
Key Drivers of Anti-Counterfeit Measures in Packaging Industry Growth
The market's growth is fueled by a confluence of factors: rising consumer awareness of counterfeit products, stringent government regulations aimed at curbing counterfeiting, technological advancements offering more sophisticated solutions, and increasing e-commerce activities, which expand the scope for counterfeiting. The pharmaceutical and healthcare industries, in particular, drive significant demand for advanced anti-counterfeiting technologies.
Challenges in the Anti Counterfeit Measures in Packaging Industry Sector
Significant challenges include the high cost of implementation for advanced technologies, the continuous evolution of counterfeiting techniques, regulatory inconsistencies across different regions, and the complexity of integrating anti-counterfeiting measures into existing supply chains. The need for robust and reliable authentication methods that are easily accessible to consumers is also a key challenge.
Emerging Opportunities in Anti-Counterfeit Measures in Packaging Industry
Emerging opportunities include the application of AI and machine learning for improved detection of counterfeit products, the integration of blockchain technology for enhanced traceability and transparency, the development of user-friendly authentication methods for consumers, and expansion into new and developing markets with growing consumer awareness.
Leading Players in the Anti-Counterfeit Measures in Packaging Industry Market
- PharmaSecure Inc
- AlpVision SA
- Uflex Limited
- Sicpa Holding SA
- 3M Company
- CCL Industries Inc
- Avery Dennison Corporation
- Applied DNA Sciences Inc
- Authentix Inc
- Zebra Technologies Corporation
- E I Du Pont De Nemours and Company
- Ampacet Corporation
Key Developments in Anti-Counterfeit Measures in Packaging Industry Industry
- August 2021: Avery Dennison Corporation acquired Vestcom for USD 1.45 Billion, expanding its branded labeling offerings. This acquisition significantly impacted the market by increasing Avery Dennison's market share and strengthening its position in the retail and consumer packaged goods sectors.
Future Outlook for Anti-Counterfeit Measures in Packaging Industry Market
The future of the anti-counterfeit measures market is bright, driven by continuous technological advancements, increasing regulatory pressures, and rising consumer demand for authentic products. The market is expected to witness significant growth, driven by the adoption of innovative technologies and expanding applications across diverse industries. Strategic partnerships and collaborations among technology providers and industry players will be crucial in shaping the future of the market.
Anti Counterfeit Measures in Packaging Industry Segmentation
-
1. Technology
- 1.1. Trace and Track
- 1.2. Tamper-evident
- 1.3. Covert
- 1.4. Overt
- 1.5. Forensic Markers
-
2. End User
- 2.1. Food and Beverage
- 2.2. Healthcare and Pharmaceuticals
- 2.3. Industrial and Automotive
- 2.4. Consumer Electronics
- 2.5. Other End Users
Anti Counterfeit Measures in Packaging Industry Segmentation By Geography
-
1. North America
- 1.1. United States
- 1.2. Canada
-
2. Europe
- 2.1. United Kingdom
- 2.2. Germany
- 2.3. France
- 2.4. Italy
- 2.5. Spain
- 2.6. Rest of Europe
-
3. Asia Pacific
- 3.1. China
- 3.2. India
- 3.3. Japan
- 3.4. Australia
- 3.5. Rest of Asia Pacific
-
4. Latin America
- 4.1. Brazil
- 4.2. Argentina
- 4.3. Rest of Latin America
- 5. Middle East
-
6. South Africa
- 6.1. United Arab Emirates
- 6.2. Rest of Middle East
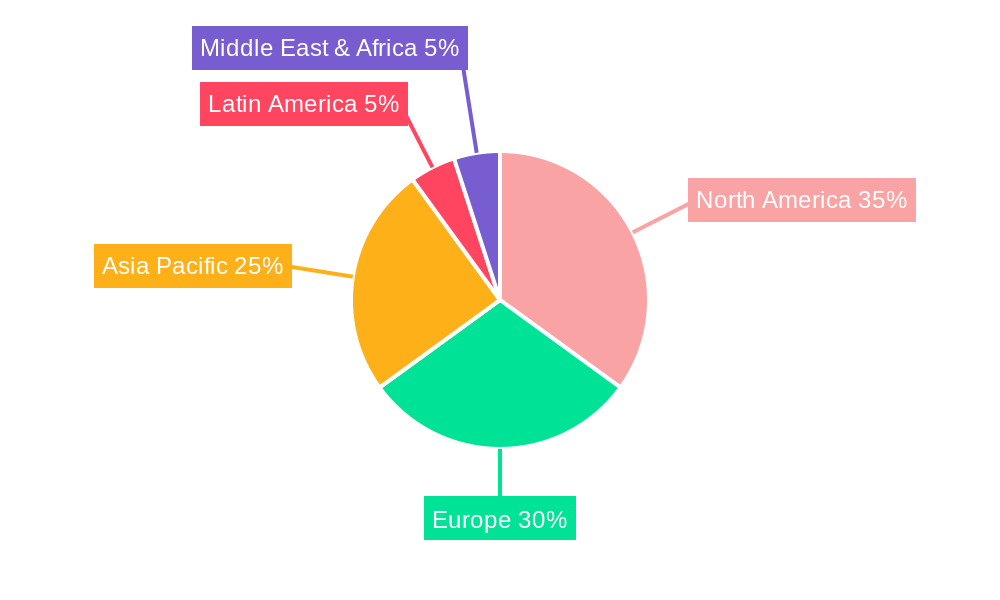
Anti Counterfeit Measures in Packaging Industry Regional Market Share
Geographic Coverage of Anti Counterfeit Measures in Packaging Industry
Anti Counterfeit Measures in Packaging Industry REPORT HIGHLIGHTS
| Aspects | Details |
|---|---|
| Study Period | 2020-2034 |
| Base Year | 2025 |
| Estimated Year | 2026 |
| Forecast Period | 2026-2034 |
| Historical Period | 2020-2025 |
| Growth Rate | CAGR of 9.4% from 2020-2034 |
| Segmentation |
|
Table of Contents
- 1. Introduction
- 1.1. Research Scope
- 1.2. Market Segmentation
- 1.3. Research Objective
- 1.4. Definitions and Assumptions
- 2. Executive Summary
- 2.1. Market Snapshot
- 3. Market Dynamics
- 3.1. Market Drivers
- 3.2. Market Restrains
- 3.3. Market Trends
- 3.4. Market Opportunities
- 4. Market Factor Analysis
- 4.1. Porters Five Forces
- 4.1.1. Bargaining Power of Suppliers
- 4.1.2. Bargaining Power of Buyers
- 4.1.3. Threat of New Entrants
- 4.1.4. Threat of Substitutes
- 4.1.5. Competitive Rivalry
- 4.2. PESTEL analysis
- 4.3. BCG Analysis
- 4.3.1. Stars (High Growth, High Market Share)
- 4.3.2. Cash Cows (Low Growth, High Market Share)
- 4.3.3. Question Mark (High Growth, Low Market Share)
- 4.3.4. Dogs (Low Growth, Low Market Share)
- 4.4. Ansoff Matrix Analysis
- 4.5. Supply Chain Analysis
- 4.6. Regulatory Landscape
- 4.7. Current Market Potential and Opportunity Assessment (TAM–SAM–SOM Framework)
- 4.8. PRI Analyst Note
- 4.1. Porters Five Forces
- 5. Market Analysis, Insights and Forecast 2021-2033
- 5.1. Market Analysis, Insights and Forecast - by Technology
- 5.1.1. Trace and Track
- 5.1.2. Tamper-evident
- 5.1.3. Covert
- 5.1.4. Overt
- 5.1.5. Forensic Markers
- 5.2. Market Analysis, Insights and Forecast - by End User
- 5.2.1. Food and Beverage
- 5.2.2. Healthcare and Pharmaceuticals
- 5.2.3. Industrial and Automotive
- 5.2.4. Consumer Electronics
- 5.2.5. Other End Users
- 5.3. Market Analysis, Insights and Forecast - by Region
- 5.3.1. North America
- 5.3.2. Europe
- 5.3.3. Asia Pacific
- 5.3.4. Latin America
- 5.3.5. Middle East
- 5.3.6. South Africa
- 5.1. Market Analysis, Insights and Forecast - by Technology
- 6. Global Anti Counterfeit Measures in Packaging Industry Analysis, Insights and Forecast, 2021-2033
- 6.1. Market Analysis, Insights and Forecast - by Technology
- 6.1.1. Trace and Track
- 6.1.2. Tamper-evident
- 6.1.3. Covert
- 6.1.4. Overt
- 6.1.5. Forensic Markers
- 6.2. Market Analysis, Insights and Forecast - by End User
- 6.2.1. Food and Beverage
- 6.2.2. Healthcare and Pharmaceuticals
- 6.2.3. Industrial and Automotive
- 6.2.4. Consumer Electronics
- 6.2.5. Other End Users
- 6.1. Market Analysis, Insights and Forecast - by Technology
- 7. North America Anti Counterfeit Measures in Packaging Industry Analysis, Insights and Forecast, 2020-2032
- 7.1. Market Analysis, Insights and Forecast - by Technology
- 7.1.1. Trace and Track
- 7.1.2. Tamper-evident
- 7.1.3. Covert
- 7.1.4. Overt
- 7.1.5. Forensic Markers
- 7.2. Market Analysis, Insights and Forecast - by End User
- 7.2.1. Food and Beverage
- 7.2.2. Healthcare and Pharmaceuticals
- 7.2.3. Industrial and Automotive
- 7.2.4. Consumer Electronics
- 7.2.5. Other End Users
- 7.1. Market Analysis, Insights and Forecast - by Technology
- 8. Europe Anti Counterfeit Measures in Packaging Industry Analysis, Insights and Forecast, 2020-2032
- 8.1. Market Analysis, Insights and Forecast - by Technology
- 8.1.1. Trace and Track
- 8.1.2. Tamper-evident
- 8.1.3. Covert
- 8.1.4. Overt
- 8.1.5. Forensic Markers
- 8.2. Market Analysis, Insights and Forecast - by End User
- 8.2.1. Food and Beverage
- 8.2.2. Healthcare and Pharmaceuticals
- 8.2.3. Industrial and Automotive
- 8.2.4. Consumer Electronics
- 8.2.5. Other End Users
- 8.1. Market Analysis, Insights and Forecast - by Technology
- 9. Asia Pacific Anti Counterfeit Measures in Packaging Industry Analysis, Insights and Forecast, 2020-2032
- 9.1. Market Analysis, Insights and Forecast - by Technology
- 9.1.1. Trace and Track
- 9.1.2. Tamper-evident
- 9.1.3. Covert
- 9.1.4. Overt
- 9.1.5. Forensic Markers
- 9.2. Market Analysis, Insights and Forecast - by End User
- 9.2.1. Food and Beverage
- 9.2.2. Healthcare and Pharmaceuticals
- 9.2.3. Industrial and Automotive
- 9.2.4. Consumer Electronics
- 9.2.5. Other End Users
- 9.1. Market Analysis, Insights and Forecast - by Technology
- 10. Latin America Anti Counterfeit Measures in Packaging Industry Analysis, Insights and Forecast, 2020-2032
- 10.1. Market Analysis, Insights and Forecast - by Technology
- 10.1.1. Trace and Track
- 10.1.2. Tamper-evident
- 10.1.3. Covert
- 10.1.4. Overt
- 10.1.5. Forensic Markers
- 10.2. Market Analysis, Insights and Forecast - by End User
- 10.2.1. Food and Beverage
- 10.2.2. Healthcare and Pharmaceuticals
- 10.2.3. Industrial and Automotive
- 10.2.4. Consumer Electronics
- 10.2.5. Other End Users
- 10.1. Market Analysis, Insights and Forecast - by Technology
- 11. Middle East Anti Counterfeit Measures in Packaging Industry Analysis, Insights and Forecast, 2020-2032
- 11.1. Market Analysis, Insights and Forecast - by Technology
- 11.1.1. Trace and Track
- 11.1.2. Tamper-evident
- 11.1.3. Covert
- 11.1.4. Overt
- 11.1.5. Forensic Markers
- 11.2. Market Analysis, Insights and Forecast - by End User
- 11.2.1. Food and Beverage
- 11.2.2. Healthcare and Pharmaceuticals
- 11.2.3. Industrial and Automotive
- 11.2.4. Consumer Electronics
- 11.2.5. Other End Users
- 11.1. Market Analysis, Insights and Forecast - by Technology
- 12. South Africa Anti Counterfeit Measures in Packaging Industry Analysis, Insights and Forecast, 2020-2032
- 12.1. Market Analysis, Insights and Forecast - by Technology
- 12.1.1. Trace and Track
- 12.1.2. Tamper-evident
- 12.1.3. Covert
- 12.1.4. Overt
- 12.1.5. Forensic Markers
- 12.2. Market Analysis, Insights and Forecast - by End User
- 12.2.1. Food and Beverage
- 12.2.2. Healthcare and Pharmaceuticals
- 12.2.3. Industrial and Automotive
- 12.2.4. Consumer Electronics
- 12.2.5. Other End Users
- 12.1. Market Analysis, Insights and Forecast - by Technology
- 13. Competitive Analysis
- 13.1. Company Profiles
- 13.1.1 PharmaSecure Inc *List Not Exhaustive
- 13.1.1.1. Company Overview
- 13.1.1.2. Products
- 13.1.1.3. Company Financials
- 13.1.1.4. SWOT Analysis
- 13.1.2 AlpVision SA
- 13.1.2.1. Company Overview
- 13.1.2.2. Products
- 13.1.2.3. Company Financials
- 13.1.2.4. SWOT Analysis
- 13.1.3 Uflex Limited
- 13.1.3.1. Company Overview
- 13.1.3.2. Products
- 13.1.3.3. Company Financials
- 13.1.3.4. SWOT Analysis
- 13.1.4 Sicpa Holding SA
- 13.1.4.1. Company Overview
- 13.1.4.2. Products
- 13.1.4.3. Company Financials
- 13.1.4.4. SWOT Analysis
- 13.1.5 3M Company
- 13.1.5.1. Company Overview
- 13.1.5.2. Products
- 13.1.5.3. Company Financials
- 13.1.5.4. SWOT Analysis
- 13.1.6 CCL Industries Inc
- 13.1.6.1. Company Overview
- 13.1.6.2. Products
- 13.1.6.3. Company Financials
- 13.1.6.4. SWOT Analysis
- 13.1.7 Avery Dennison Corporation
- 13.1.7.1. Company Overview
- 13.1.7.2. Products
- 13.1.7.3. Company Financials
- 13.1.7.4. SWOT Analysis
- 13.1.8 Applied Dna Sciences Inc
- 13.1.8.1. Company Overview
- 13.1.8.2. Products
- 13.1.8.3. Company Financials
- 13.1.8.4. SWOT Analysis
- 13.1.9 Authentix Inc
- 13.1.9.1. Company Overview
- 13.1.9.2. Products
- 13.1.9.3. Company Financials
- 13.1.9.4. SWOT Analysis
- 13.1.10 Zebra Technologies Corporation
- 13.1.10.1. Company Overview
- 13.1.10.2. Products
- 13.1.10.3. Company Financials
- 13.1.10.4. SWOT Analysis
- 13.1.11 E I Du Pont De Nemours and Company
- 13.1.11.1. Company Overview
- 13.1.11.2. Products
- 13.1.11.3. Company Financials
- 13.1.11.4. SWOT Analysis
- 13.1.12 Ampacet Corporation
- 13.1.12.1. Company Overview
- 13.1.12.2. Products
- 13.1.12.3. Company Financials
- 13.1.12.4. SWOT Analysis
- 13.1.1 PharmaSecure Inc *List Not Exhaustive
- 13.2. Market Entropy
- 13.2.1 Company's Key Areas Served
- 13.2.2 Recent Developments
- 13.3. Company Market Share Analysis 2025
- 13.3.1 Top 5 Companies Market Share Analysis
- 13.3.2 Top 3 Companies Market Share Analysis
- 13.4. List of Potential Customers
- 14. Research Methodology
List of Figures
- Figure 1: Global Anti Counterfeit Measures in Packaging Industry Revenue Breakdown (billion, %) by Region 2025 & 2033
- Figure 2: North America Anti Counterfeit Measures in Packaging Industry Revenue (billion), by Technology 2025 & 2033
- Figure 3: North America Anti Counterfeit Measures in Packaging Industry Revenue Share (%), by Technology 2025 & 2033
- Figure 4: North America Anti Counterfeit Measures in Packaging Industry Revenue (billion), by End User 2025 & 2033
- Figure 5: North America Anti Counterfeit Measures in Packaging Industry Revenue Share (%), by End User 2025 & 2033
- Figure 6: North America Anti Counterfeit Measures in Packaging Industry Revenue (billion), by Country 2025 & 2033
- Figure 7: North America Anti Counterfeit Measures in Packaging Industry Revenue Share (%), by Country 2025 & 2033
- Figure 8: Europe Anti Counterfeit Measures in Packaging Industry Revenue (billion), by Technology 2025 & 2033
- Figure 9: Europe Anti Counterfeit Measures in Packaging Industry Revenue Share (%), by Technology 2025 & 2033
- Figure 10: Europe Anti Counterfeit Measures in Packaging Industry Revenue (billion), by End User 2025 & 2033
- Figure 11: Europe Anti Counterfeit Measures in Packaging Industry Revenue Share (%), by End User 2025 & 2033
- Figure 12: Europe Anti Counterfeit Measures in Packaging Industry Revenue (billion), by Country 2025 & 2033
- Figure 13: Europe Anti Counterfeit Measures in Packaging Industry Revenue Share (%), by Country 2025 & 2033
- Figure 14: Asia Pacific Anti Counterfeit Measures in Packaging Industry Revenue (billion), by Technology 2025 & 2033
- Figure 15: Asia Pacific Anti Counterfeit Measures in Packaging Industry Revenue Share (%), by Technology 2025 & 2033
- Figure 16: Asia Pacific Anti Counterfeit Measures in Packaging Industry Revenue (billion), by End User 2025 & 2033
- Figure 17: Asia Pacific Anti Counterfeit Measures in Packaging Industry Revenue Share (%), by End User 2025 & 2033
- Figure 18: Asia Pacific Anti Counterfeit Measures in Packaging Industry Revenue (billion), by Country 2025 & 2033
- Figure 19: Asia Pacific Anti Counterfeit Measures in Packaging Industry Revenue Share (%), by Country 2025 & 2033
- Figure 20: Latin America Anti Counterfeit Measures in Packaging Industry Revenue (billion), by Technology 2025 & 2033
- Figure 21: Latin America Anti Counterfeit Measures in Packaging Industry Revenue Share (%), by Technology 2025 & 2033
- Figure 22: Latin America Anti Counterfeit Measures in Packaging Industry Revenue (billion), by End User 2025 & 2033
- Figure 23: Latin America Anti Counterfeit Measures in Packaging Industry Revenue Share (%), by End User 2025 & 2033
- Figure 24: Latin America Anti Counterfeit Measures in Packaging Industry Revenue (billion), by Country 2025 & 2033
- Figure 25: Latin America Anti Counterfeit Measures in Packaging Industry Revenue Share (%), by Country 2025 & 2033
- Figure 26: Middle East Anti Counterfeit Measures in Packaging Industry Revenue (billion), by Technology 2025 & 2033
- Figure 27: Middle East Anti Counterfeit Measures in Packaging Industry Revenue Share (%), by Technology 2025 & 2033
- Figure 28: Middle East Anti Counterfeit Measures in Packaging Industry Revenue (billion), by End User 2025 & 2033
- Figure 29: Middle East Anti Counterfeit Measures in Packaging Industry Revenue Share (%), by End User 2025 & 2033
- Figure 30: Middle East Anti Counterfeit Measures in Packaging Industry Revenue (billion), by Country 2025 & 2033
- Figure 31: Middle East Anti Counterfeit Measures in Packaging Industry Revenue Share (%), by Country 2025 & 2033
- Figure 32: South Africa Anti Counterfeit Measures in Packaging Industry Revenue (billion), by Technology 2025 & 2033
- Figure 33: South Africa Anti Counterfeit Measures in Packaging Industry Revenue Share (%), by Technology 2025 & 2033
- Figure 34: South Africa Anti Counterfeit Measures in Packaging Industry Revenue (billion), by End User 2025 & 2033
- Figure 35: South Africa Anti Counterfeit Measures in Packaging Industry Revenue Share (%), by End User 2025 & 2033
- Figure 36: South Africa Anti Counterfeit Measures in Packaging Industry Revenue (billion), by Country 2025 & 2033
- Figure 37: South Africa Anti Counterfeit Measures in Packaging Industry Revenue Share (%), by Country 2025 & 2033
List of Tables
- Table 1: Global Anti Counterfeit Measures in Packaging Industry Revenue billion Forecast, by Technology 2020 & 2033
- Table 2: Global Anti Counterfeit Measures in Packaging Industry Revenue billion Forecast, by End User 2020 & 2033
- Table 3: Global Anti Counterfeit Measures in Packaging Industry Revenue billion Forecast, by Region 2020 & 2033
- Table 4: Global Anti Counterfeit Measures in Packaging Industry Revenue billion Forecast, by Technology 2020 & 2033
- Table 5: Global Anti Counterfeit Measures in Packaging Industry Revenue billion Forecast, by End User 2020 & 2033
- Table 6: Global Anti Counterfeit Measures in Packaging Industry Revenue billion Forecast, by Country 2020 & 2033
- Table 7: United States Anti Counterfeit Measures in Packaging Industry Revenue (billion) Forecast, by Application 2020 & 2033
- Table 8: Canada Anti Counterfeit Measures in Packaging Industry Revenue (billion) Forecast, by Application 2020 & 2033
- Table 9: Global Anti Counterfeit Measures in Packaging Industry Revenue billion Forecast, by Technology 2020 & 2033
- Table 10: Global Anti Counterfeit Measures in Packaging Industry Revenue billion Forecast, by End User 2020 & 2033
- Table 11: Global Anti Counterfeit Measures in Packaging Industry Revenue billion Forecast, by Country 2020 & 2033
- Table 12: United Kingdom Anti Counterfeit Measures in Packaging Industry Revenue (billion) Forecast, by Application 2020 & 2033
- Table 13: Germany Anti Counterfeit Measures in Packaging Industry Revenue (billion) Forecast, by Application 2020 & 2033
- Table 14: France Anti Counterfeit Measures in Packaging Industry Revenue (billion) Forecast, by Application 2020 & 2033
- Table 15: Italy Anti Counterfeit Measures in Packaging Industry Revenue (billion) Forecast, by Application 2020 & 2033
- Table 16: Spain Anti Counterfeit Measures in Packaging Industry Revenue (billion) Forecast, by Application 2020 & 2033
- Table 17: Rest of Europe Anti Counterfeit Measures in Packaging Industry Revenue (billion) Forecast, by Application 2020 & 2033
- Table 18: Global Anti Counterfeit Measures in Packaging Industry Revenue billion Forecast, by Technology 2020 & 2033
- Table 19: Global Anti Counterfeit Measures in Packaging Industry Revenue billion Forecast, by End User 2020 & 2033
- Table 20: Global Anti Counterfeit Measures in Packaging Industry Revenue billion Forecast, by Country 2020 & 2033
- Table 21: China Anti Counterfeit Measures in Packaging Industry Revenue (billion) Forecast, by Application 2020 & 2033
- Table 22: India Anti Counterfeit Measures in Packaging Industry Revenue (billion) Forecast, by Application 2020 & 2033
- Table 23: Japan Anti Counterfeit Measures in Packaging Industry Revenue (billion) Forecast, by Application 2020 & 2033
- Table 24: Australia Anti Counterfeit Measures in Packaging Industry Revenue (billion) Forecast, by Application 2020 & 2033
- Table 25: Rest of Asia Pacific Anti Counterfeit Measures in Packaging Industry Revenue (billion) Forecast, by Application 2020 & 2033
- Table 26: Global Anti Counterfeit Measures in Packaging Industry Revenue billion Forecast, by Technology 2020 & 2033
- Table 27: Global Anti Counterfeit Measures in Packaging Industry Revenue billion Forecast, by End User 2020 & 2033
- Table 28: Global Anti Counterfeit Measures in Packaging Industry Revenue billion Forecast, by Country 2020 & 2033
- Table 29: Brazil Anti Counterfeit Measures in Packaging Industry Revenue (billion) Forecast, by Application 2020 & 2033
- Table 30: Argentina Anti Counterfeit Measures in Packaging Industry Revenue (billion) Forecast, by Application 2020 & 2033
- Table 31: Rest of Latin America Anti Counterfeit Measures in Packaging Industry Revenue (billion) Forecast, by Application 2020 & 2033
- Table 32: Global Anti Counterfeit Measures in Packaging Industry Revenue billion Forecast, by Technology 2020 & 2033
- Table 33: Global Anti Counterfeit Measures in Packaging Industry Revenue billion Forecast, by End User 2020 & 2033
- Table 34: Global Anti Counterfeit Measures in Packaging Industry Revenue billion Forecast, by Country 2020 & 2033
- Table 35: Global Anti Counterfeit Measures in Packaging Industry Revenue billion Forecast, by Technology 2020 & 2033
- Table 36: Global Anti Counterfeit Measures in Packaging Industry Revenue billion Forecast, by End User 2020 & 2033
- Table 37: Global Anti Counterfeit Measures in Packaging Industry Revenue billion Forecast, by Country 2020 & 2033
- Table 38: United Arab Emirates Anti Counterfeit Measures in Packaging Industry Revenue (billion) Forecast, by Application 2020 & 2033
- Table 39: Rest of Middle East Anti Counterfeit Measures in Packaging Industry Revenue (billion) Forecast, by Application 2020 & 2033
Frequently Asked Questions
1. What is the projected Compound Annual Growth Rate (CAGR) of the Anti Counterfeit Measures in Packaging Industry?
The projected CAGR is approximately 9.4%.
2. Which companies are prominent players in the Anti Counterfeit Measures in Packaging Industry?
Key companies in the market include PharmaSecure Inc *List Not Exhaustive, AlpVision SA, Uflex Limited, Sicpa Holding SA, 3M Company, CCL Industries Inc, Avery Dennison Corporation, Applied Dna Sciences Inc, Authentix Inc, Zebra Technologies Corporation, E I Du Pont De Nemours and Company, Ampacet Corporation.
3. What are the main segments of the Anti Counterfeit Measures in Packaging Industry?
The market segments include Technology, End User.
4. Can you provide details about the market size?
The market size is estimated to be USD 204.08 billion as of 2022.
5. What are some drivers contributing to market growth?
Booming E-commerce Industry; Increasing Focus of Manufacturers on Brand Protection.
6. What are the notable trends driving market growth?
Pharmaceuticals and Healthcare to Drive the Market Demand.
7. Are there any restraints impacting market growth?
High-initial Costs.
8. Can you provide examples of recent developments in the market?
In August 2021, - Avery Dennison Corporation acquired Vestcom for an investment of USD 1.45 billion. The acquisition will help the company expand its branded labeling offerings for retail and consumer packaged goods industries.
9. What pricing options are available for accessing the report?
Pricing options include single-user, multi-user, and enterprise licenses priced at USD 4750, USD 5250, and USD 8750 respectively.
10. Is the market size provided in terms of value or volume?
The market size is provided in terms of value, measured in billion.
11. Are there any specific market keywords associated with the report?
Yes, the market keyword associated with the report is "Anti Counterfeit Measures in Packaging Industry," which aids in identifying and referencing the specific market segment covered.
12. How do I determine which pricing option suits my needs best?
The pricing options vary based on user requirements and access needs. Individual users may opt for single-user licenses, while businesses requiring broader access may choose multi-user or enterprise licenses for cost-effective access to the report.
13. Are there any additional resources or data provided in the Anti Counterfeit Measures in Packaging Industry report?
While the report offers comprehensive insights, it's advisable to review the specific contents or supplementary materials provided to ascertain if additional resources or data are available.
14. How can I stay updated on further developments or reports in the Anti Counterfeit Measures in Packaging Industry?
To stay informed about further developments, trends, and reports in the Anti Counterfeit Measures in Packaging Industry, consider subscribing to industry newsletters, following relevant companies and organizations, or regularly checking reputable industry news sources and publications.
Methodology
Step 1 - Identification of Relevant Samples Size from Population Database


Step 2 - Approaches for Defining Global Market Size (Value, Volume* & Price*)

Note*: In applicable scenarios
Step 3 - Data Sources
Primary Research
- Web Analytics
- Survey Reports
- Research Institute
- Latest Research Reports
- Opinion Leaders
Secondary Research
- Annual Reports
- White Paper
- Latest Press Release
- Industry Association
- Paid Database
- Investor Presentations

Step 4 - Data Triangulation
Involves using different sources of information in order to increase the validity of a study
These sources are likely to be stakeholders in a program - participants, other researchers, program staff, other community members, and so on.
Then we put all data in single framework & apply various statistical tools to find out the dynamic on the market.
During the analysis stage, feedback from the stakeholder groups would be compared to determine areas of agreement as well as areas of divergence