
Key Insights
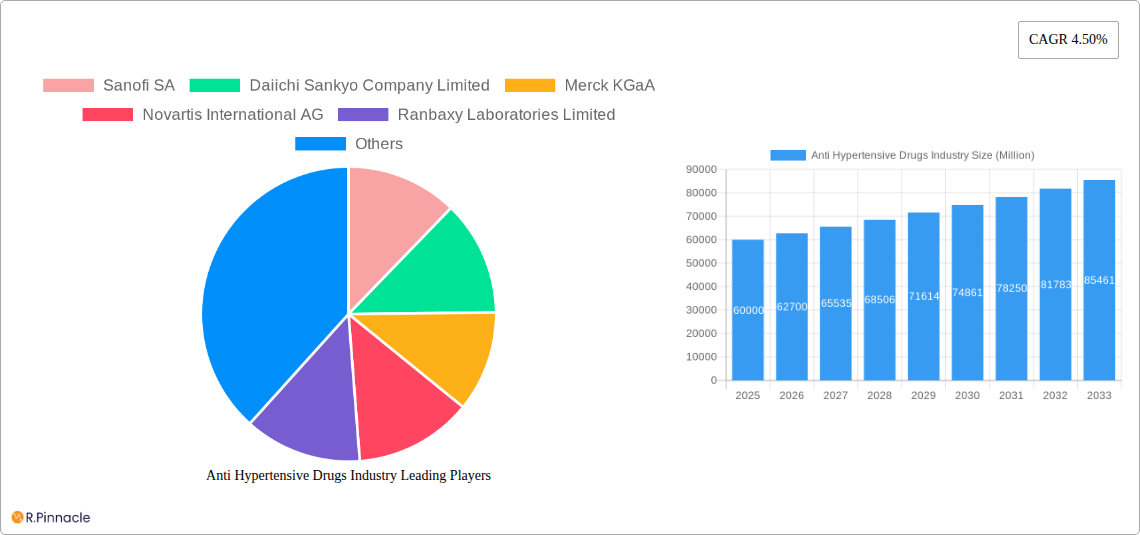
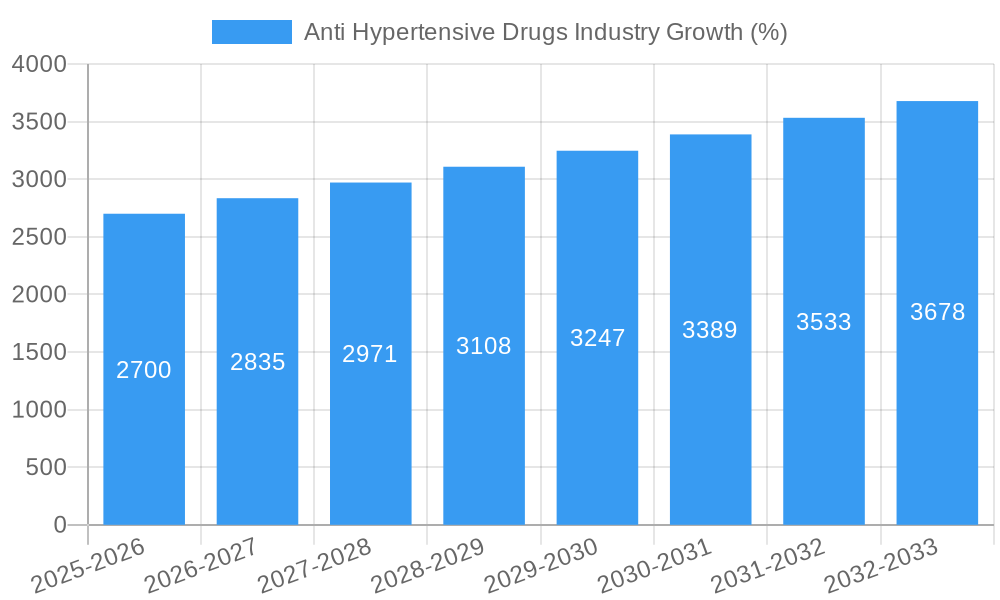
The global antihypertensive drugs market, valued at approximately $60 billion in 2025, is projected to experience robust growth, exhibiting a compound annual growth rate (CAGR) of 4.50% from 2025 to 2033. This expansion is driven by several key factors. The rising prevalence of hypertension globally, fueled by increasing aging populations, unhealthy lifestyles (including poor diet and lack of exercise), and a growing incidence of obesity and diabetes, significantly contributes to market growth. Furthermore, advancements in drug development, leading to the introduction of novel therapies with improved efficacy and safety profiles, are also fueling market expansion. Increased awareness campaigns and improved healthcare infrastructure in developing economies are expanding access to treatment and further propelling market growth. The market is segmented by therapeutic class, with diuretics, ACE inhibitors, ARBs, beta-blockers, and calcium channel blockers representing major segments. Competition among established pharmaceutical companies like Sanofi, Novartis, AstraZeneca, and Pfizer, along with the emergence of generic drug manufacturers, contributes to a dynamic market landscape. However, potential restraints include the development of drug resistance, side effects associated with long-term use of certain antihypertensive medications, and the need for consistent patient adherence to treatment regimens.
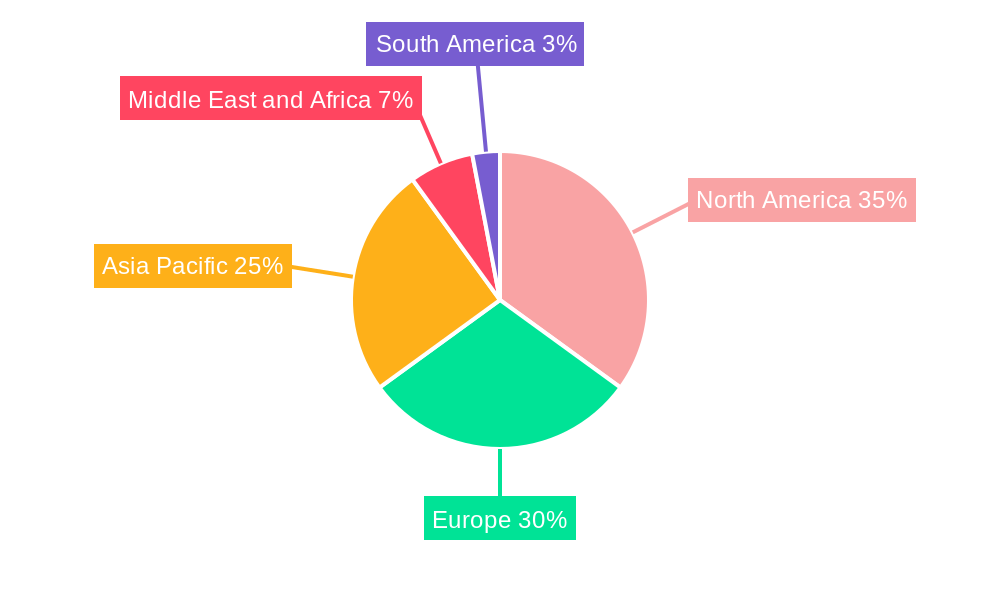
Despite these challenges, the market is poised for continued growth due to the persistent and rising prevalence of hypertension. The North American and European markets currently hold significant shares, but the Asia-Pacific region is anticipated to witness considerable growth in the coming years, driven by rising healthcare spending and increased awareness of hypertension in this region. The market’s future trajectory will depend on factors such as the success of new drug launches, pricing strategies, and the continued expansion of healthcare access globally. The focus on personalized medicine and the development of targeted therapies for specific patient sub-groups will also significantly shape market evolution in the forecast period. This robust growth, combined with ongoing research and development, positions the antihypertensive drug market for a period of sustained expansion.
Antihypertensive Drugs Industry Market Report: 2019-2033
This comprehensive report provides a detailed analysis of the global antihypertensive drugs market, offering invaluable insights for industry professionals, investors, and researchers. Covering the period from 2019 to 2033, with a focus on 2025, this report examines market structure, dynamics, leading players, and future growth prospects. The report utilizes a robust methodology incorporating market size estimations, CAGR calculations, and thorough competitive landscaping.
Anti Hypertensive Drugs Industry Market Structure & Innovation Trends
The antihypertensive drugs market exhibits a moderately concentrated structure, with several multinational pharmaceutical giants holding significant market share. Key players such as Sanofi SA, Daiichi Sankyo Company Limited, Merck KGaA, Novartis International AG, AstraZeneca PLC, Johnson & Johnson, and Pfizer Inc dominate the landscape. Their combined market share in 2024 is estimated at xx Million.
Innovation in the antihypertensive drug market is driven by the need for more effective, safer, and patient-compliant therapies. This includes the development of combination therapies, targeted drug delivery systems, and personalized medicine approaches. Stringent regulatory frameworks, particularly regarding drug safety and efficacy, significantly impact market dynamics. Generic competition also plays a crucial role, influencing pricing and market accessibility. The market witnesses frequent M&A activities, with deal values exceeding xx Million in 2024, reflecting strategic consolidation and expansion efforts among key players. End-user demographics, particularly the aging global population and rising prevalence of hypertension, are major growth drivers.
- Market Concentration: High, with top 10 players holding xx% market share in 2024.
- Innovation Drivers: Development of combination therapies, targeted drug delivery, personalized medicine.
- Regulatory Framework: Stringent regulations impacting drug approvals and market access.
- Product Substitutes: Lifestyle changes, alternative therapies (e.g., herbal remedies – though efficacy is debated).
- M&A Activity: Significant deal flow, exceeding xx Million in 2024.
Anti Hypertensive Drugs Industry Market Dynamics & Trends
The global antihypertensive drugs market is experiencing robust growth, driven by several key factors. The increasing prevalence of hypertension globally, coupled with an aging population, fuels significant demand. Technological advancements, such as the development of novel drug delivery systems and personalized medicine approaches, contribute to market expansion. Consumer preferences are shifting towards more convenient and effective treatment options, including combination therapies and once-daily formulations. The competitive landscape is characterized by intense rivalry amongst established players and emerging generic manufacturers. This leads to pricing pressures but also fosters innovation and improved treatment accessibility. The market is expected to exhibit a CAGR of xx% during the forecast period (2025-2033), with market penetration increasing steadily across various regions.
Dominant Regions & Segments in Anti Hypertensive Drugs Industry
The North American region currently holds the largest market share for antihypertensive drugs, driven by high healthcare expenditure, advanced healthcare infrastructure, and a large aging population. However, emerging markets in Asia-Pacific are expected to witness significant growth in the coming years due to rising prevalence of hypertension and increasing healthcare awareness.
Key Drivers by Segment:
- Diuretics: Cost-effectiveness and established efficacy contribute to significant market share.
- ACE Inhibitors: Widely used, but competition from ARBs and other classes limits growth.
- ARBs: Growing market share due to improved safety profiles compared to ACE inhibitors.
- Beta Blockers: Mature market, but still relevant for specific patient populations.
- Alpha Blockers: Niche applications, limited market growth.
- Renin Inhibitors: Emerging class with potential for future growth.
- Calcium Channel Blockers: Significant market share, particularly in combination therapies.
- Other Therapeutic Classes: Includes newer agents with specialized uses, offering growth opportunities.
Regional Dominance Analysis:
North America currently leads due to factors like high healthcare expenditure and advanced medical infrastructure, though the Asia-Pacific region is poised for significant growth driven by rising prevalence of hypertension and an expanding middle class with better access to healthcare.
Anti Hypertensive Drugs Industry Product Innovations
Recent innovations in the antihypertensive drug market focus on improving treatment efficacy, safety, and patient compliance. This includes the development of fixed-dose combination therapies, offering simplified administration and improved adherence. Targeted drug delivery systems aim to enhance therapeutic effectiveness while minimizing side effects. The integration of digital health technologies, such as mobile apps for patient monitoring and telehealth platforms, enhances patient engagement and improves treatment outcomes. These innovations address unmet medical needs, cater to evolving consumer preferences, and solidify competitive advantages within a dynamic market landscape.
Report Scope & Segmentation Analysis
This report comprehensively analyzes the global antihypertensive drugs market, segmented by therapeutic class (Diuretics, ACE Inhibitors, ARBs, Beta Blockers, Alpha Blockers, Renin Inhibitors, Calcium Channel Blockers, and Other Therapeutic Classes) and geography. Each segment's analysis includes market size estimation, growth projections, and competitive dynamics. The market size for each therapeutic class is estimated at xx Million in 2025, with significant variation in growth projections reflecting the maturity and competitive landscape of each segment.
Key Drivers of Anti Hypertensive Drugs Industry Growth
The growth of the antihypertensive drugs market is driven by several interconnected factors. The increasing global prevalence of hypertension, particularly among older adults, represents a significant market driver. Technological advancements resulting in the development of safer and more effective drugs with improved tolerability further fuel market expansion. Rising healthcare expenditure and improved access to healthcare services, especially in developing economies, also contribute to market growth. Government initiatives and public health campaigns promoting hypertension awareness and early detection contribute to increased diagnosis and treatment rates, ultimately boosting market demand.
Challenges in the Anti Hypertensive Drugs Industry Sector
Several challenges hinder the growth of the antihypertensive drugs market. Stricter regulatory approvals and increasing clinical trial costs pose significant obstacles to the introduction of new drugs. Patent expirations and the subsequent rise of generic competition put pressure on pricing and profitability. Supply chain disruptions and fluctuations in raw material costs can impact production efficiency and affordability. Furthermore, concerns regarding potential adverse effects and drug interactions, along with the need for long-term patient compliance, present ongoing challenges. These factors collectively contribute to complexity and competitive pressures within the market.
Emerging Opportunities in Anti Hypertensive Drugs Industry
Emerging opportunities in the antihypertensive drugs market include the development of novel therapeutic agents targeting specific patient populations or addressing unmet medical needs. Personalized medicine approaches, offering tailored treatment based on individual genetic profiles, represent a key area of potential growth. The expansion into emerging markets with high prevalence of hypertension and increasing healthcare access opens up significant growth prospects. The integration of digital health technologies, improving patient engagement and monitoring, offers opportunities to enhance treatment outcomes and improve patient compliance. Furthermore, the development of combination therapies with improved efficacy and reduced side effects continues to offer significant market opportunities.
Leading Players in the Anti Hypertensive Drugs Industry Market
- Sanofi SA
- Daiichi Sankyo Company Limited
- Merck KGaA
- Novartis International AG
- Ranbaxy Laboratories Limited
- C H Boehringer Sohn AG & Ko KG
- AstraZeneca PLC
- Johnson & Johnson
- Lupin Limited
- Noden Pharma DAC
- Pfizer Inc
Key Developments in Anti Hypertensive Drugs Industry Industry
- May 2022: Hanmi Pharmaceutical launched Amosartan (Meiyaping) in China, the first homegrown blood pressure combination therapy in the Chinese market.
- March 2022: Pfizer Inc. recalled a blood pressure drug due to elevated levels of a potentially cancer-causing impurity.
Future Outlook for Anti Hypertensive Drugs Industry Market
The future outlook for the antihypertensive drugs market remains positive, driven by persistent high prevalence of hypertension, an aging global population, and continuous innovation in drug development. The market will likely witness further consolidation through mergers and acquisitions, along with increased focus on combination therapies and personalized medicine. Growth will be fueled by expansion into emerging markets and the integration of digital health technologies to improve treatment adherence and patient outcomes. The market is poised for continued expansion, presenting significant opportunities for both established players and emerging companies.
Anti Hypertensive Drugs Industry Segmentation
-
1. Therapeutic Class
- 1.1. Diuretics
- 1.2. Angiotensin Converting Enzyme (ACE) Inhibitors
- 1.3. Angiotensin Receptor Blockers (ARBs)
- 1.4. Beta Blockers
- 1.5. Alpha Blockers
- 1.6. Renin Inhibitors
- 1.7. Calcium Channel Blockers
- 1.8. Other Therapeutic Classes
Anti Hypertensive Drugs Industry Segmentation By Geography
-
1. North America
- 1.1. United States
- 1.2. Canada
- 1.3. Mexico
-
2. Europe
- 2.1. Germany
- 2.2. United Kingdom
- 2.3. France
- 2.4. Italy
- 2.5. Spain
- 2.6. Rest of Europe
-
3. Asia Pacific
- 3.1. China
- 3.2. Japan
- 3.3. India
- 3.4. Australia
- 3.5. South korea
- 3.6. Rest of Asia Pacific
-
4. Middle East and Africa
- 4.1. GCC
- 4.2. South Africa
- 4.3. Rest of Middle East and Africa
-
5. South America
- 5.1. Brazil
- 5.2. Argentina
- 5.3. Rest of South America
Anti Hypertensive Drugs Industry REPORT HIGHLIGHTS
| Aspects | Details |
|---|---|
| Study Period | 2019-2033 |
| Base Year | 2024 |
| Estimated Year | 2025 |
| Forecast Period | 2025-2033 |
| Historical Period | 2019-2024 |
| Growth Rate | CAGR of 4.50% from 2019-2033 |
| Segmentation |
|
Table of Contents
- 1. Introduction
- 1.1. Research Scope
- 1.2. Market Segmentation
- 1.3. Research Methodology
- 1.4. Definitions and Assumptions
- 2. Executive Summary
- 2.1. Introduction
- 3. Market Dynamics
- 3.1. Introduction
- 3.2. Market Drivers
- 3.2.1. Increasing Prevalence of Hypertension; Growing Initiatives by Private and Government Organizations; Rising Awareness about Hypertension
- 3.3. Market Restrains
- 3.3.1. Multiple Major Drug Patent Expiration; Side-effects of Treatment Options and Rise in Non-pharmacological Therapy
- 3.4. Market Trends
- 3.4.1. Diuretics Therapeutics Class is Expected to Hold a Significant Market Share in the Forecast Period
- 4. Market Factor Analysis
- 4.1. Porters Five Forces
- 4.2. Supply/Value Chain
- 4.3. PESTEL analysis
- 4.4. Market Entropy
- 4.5. Patent/Trademark Analysis
- 5. Global Anti Hypertensive Drugs Industry Analysis, Insights and Forecast, 2019-2031
- 5.1. Market Analysis, Insights and Forecast - by Therapeutic Class
- 5.1.1. Diuretics
- 5.1.2. Angiotensin Converting Enzyme (ACE) Inhibitors
- 5.1.3. Angiotensin Receptor Blockers (ARBs)
- 5.1.4. Beta Blockers
- 5.1.5. Alpha Blockers
- 5.1.6. Renin Inhibitors
- 5.1.7. Calcium Channel Blockers
- 5.1.8. Other Therapeutic Classes
- 5.2. Market Analysis, Insights and Forecast - by Region
- 5.2.1. North America
- 5.2.2. Europe
- 5.2.3. Asia Pacific
- 5.2.4. Middle East and Africa
- 5.2.5. South America
- 5.1. Market Analysis, Insights and Forecast - by Therapeutic Class
- 6. North America Anti Hypertensive Drugs Industry Analysis, Insights and Forecast, 2019-2031
- 6.1. Market Analysis, Insights and Forecast - by Therapeutic Class
- 6.1.1. Diuretics
- 6.1.2. Angiotensin Converting Enzyme (ACE) Inhibitors
- 6.1.3. Angiotensin Receptor Blockers (ARBs)
- 6.1.4. Beta Blockers
- 6.1.5. Alpha Blockers
- 6.1.6. Renin Inhibitors
- 6.1.7. Calcium Channel Blockers
- 6.1.8. Other Therapeutic Classes
- 6.1. Market Analysis, Insights and Forecast - by Therapeutic Class
- 7. Europe Anti Hypertensive Drugs Industry Analysis, Insights and Forecast, 2019-2031
- 7.1. Market Analysis, Insights and Forecast - by Therapeutic Class
- 7.1.1. Diuretics
- 7.1.2. Angiotensin Converting Enzyme (ACE) Inhibitors
- 7.1.3. Angiotensin Receptor Blockers (ARBs)
- 7.1.4. Beta Blockers
- 7.1.5. Alpha Blockers
- 7.1.6. Renin Inhibitors
- 7.1.7. Calcium Channel Blockers
- 7.1.8. Other Therapeutic Classes
- 7.1. Market Analysis, Insights and Forecast - by Therapeutic Class
- 8. Asia Pacific Anti Hypertensive Drugs Industry Analysis, Insights and Forecast, 2019-2031
- 8.1. Market Analysis, Insights and Forecast - by Therapeutic Class
- 8.1.1. Diuretics
- 8.1.2. Angiotensin Converting Enzyme (ACE) Inhibitors
- 8.1.3. Angiotensin Receptor Blockers (ARBs)
- 8.1.4. Beta Blockers
- 8.1.5. Alpha Blockers
- 8.1.6. Renin Inhibitors
- 8.1.7. Calcium Channel Blockers
- 8.1.8. Other Therapeutic Classes
- 8.1. Market Analysis, Insights and Forecast - by Therapeutic Class
- 9. Middle East and Africa Anti Hypertensive Drugs Industry Analysis, Insights and Forecast, 2019-2031
- 9.1. Market Analysis, Insights and Forecast - by Therapeutic Class
- 9.1.1. Diuretics
- 9.1.2. Angiotensin Converting Enzyme (ACE) Inhibitors
- 9.1.3. Angiotensin Receptor Blockers (ARBs)
- 9.1.4. Beta Blockers
- 9.1.5. Alpha Blockers
- 9.1.6. Renin Inhibitors
- 9.1.7. Calcium Channel Blockers
- 9.1.8. Other Therapeutic Classes
- 9.1. Market Analysis, Insights and Forecast - by Therapeutic Class
- 10. South America Anti Hypertensive Drugs Industry Analysis, Insights and Forecast, 2019-2031
- 10.1. Market Analysis, Insights and Forecast - by Therapeutic Class
- 10.1.1. Diuretics
- 10.1.2. Angiotensin Converting Enzyme (ACE) Inhibitors
- 10.1.3. Angiotensin Receptor Blockers (ARBs)
- 10.1.4. Beta Blockers
- 10.1.5. Alpha Blockers
- 10.1.6. Renin Inhibitors
- 10.1.7. Calcium Channel Blockers
- 10.1.8. Other Therapeutic Classes
- 10.1. Market Analysis, Insights and Forecast - by Therapeutic Class
- 11. North America Anti Hypertensive Drugs Industry Analysis, Insights and Forecast, 2019-2031
- 11.1. Market Analysis, Insights and Forecast - By Country/Sub-region
- 11.1.1. undefined
- 12. Europe Anti Hypertensive Drugs Industry Analysis, Insights and Forecast, 2019-2031
- 12.1. Market Analysis, Insights and Forecast - By Country/Sub-region
- 12.1.1. undefined
- 13. Asia Pacific Anti Hypertensive Drugs Industry Analysis, Insights and Forecast, 2019-2031
- 13.1. Market Analysis, Insights and Forecast - By Country/Sub-region
- 13.1.1. undefined
- 14. Middle East and Africa Anti Hypertensive Drugs Industry Analysis, Insights and Forecast, 2019-2031
- 14.1. Market Analysis, Insights and Forecast - By Country/Sub-region
- 14.1.1. undefined
- 15. South America Anti Hypertensive Drugs Industry Analysis, Insights and Forecast, 2019-2031
- 15.1. Market Analysis, Insights and Forecast - By Country/Sub-region
- 15.1.1. undefined
- 16. Competitive Analysis
- 16.1. Global Market Share Analysis 2024
- 16.2. Company Profiles
- 16.2.1 Sanofi SA
- 16.2.1.1. Overview
- 16.2.1.2. Products
- 16.2.1.3. SWOT Analysis
- 16.2.1.4. Recent Developments
- 16.2.1.5. Financials (Based on Availability)
- 16.2.2 Daiichi Sankyo Company Limited
- 16.2.2.1. Overview
- 16.2.2.2. Products
- 16.2.2.3. SWOT Analysis
- 16.2.2.4. Recent Developments
- 16.2.2.5. Financials (Based on Availability)
- 16.2.3 Merck KGaA
- 16.2.3.1. Overview
- 16.2.3.2. Products
- 16.2.3.3. SWOT Analysis
- 16.2.3.4. Recent Developments
- 16.2.3.5. Financials (Based on Availability)
- 16.2.4 Novartis International AG
- 16.2.4.1. Overview
- 16.2.4.2. Products
- 16.2.4.3. SWOT Analysis
- 16.2.4.4. Recent Developments
- 16.2.4.5. Financials (Based on Availability)
- 16.2.5 Ranbaxy Laboratories Limited
- 16.2.5.1. Overview
- 16.2.5.2. Products
- 16.2.5.3. SWOT Analysis
- 16.2.5.4. Recent Developments
- 16.2.5.5. Financials (Based on Availability)
- 16.2.6 C H Boehringer Sohn AG & Ko KG
- 16.2.6.1. Overview
- 16.2.6.2. Products
- 16.2.6.3. SWOT Analysis
- 16.2.6.4. Recent Developments
- 16.2.6.5. Financials (Based on Availability)
- 16.2.7 AstraZeneca PLC
- 16.2.7.1. Overview
- 16.2.7.2. Products
- 16.2.7.3. SWOT Analysis
- 16.2.7.4. Recent Developments
- 16.2.7.5. Financials (Based on Availability)
- 16.2.8 Johnson & Johnson
- 16.2.8.1. Overview
- 16.2.8.2. Products
- 16.2.8.3. SWOT Analysis
- 16.2.8.4. Recent Developments
- 16.2.8.5. Financials (Based on Availability)
- 16.2.9 Lupin Limited
- 16.2.9.1. Overview
- 16.2.9.2. Products
- 16.2.9.3. SWOT Analysis
- 16.2.9.4. Recent Developments
- 16.2.9.5. Financials (Based on Availability)
- 16.2.10 Noden Pharma DAC
- 16.2.10.1. Overview
- 16.2.10.2. Products
- 16.2.10.3. SWOT Analysis
- 16.2.10.4. Recent Developments
- 16.2.10.5. Financials (Based on Availability)
- 16.2.11 Pfizer Inc
- 16.2.11.1. Overview
- 16.2.11.2. Products
- 16.2.11.3. SWOT Analysis
- 16.2.11.4. Recent Developments
- 16.2.11.5. Financials (Based on Availability)
- 16.2.1 Sanofi SA
List of Figures
- Figure 1: Global Anti Hypertensive Drugs Industry Revenue Breakdown (Million, %) by Region 2024 & 2032
- Figure 2: Global Anti Hypertensive Drugs Industry Volume Breakdown (K Unit, %) by Region 2024 & 2032
- Figure 3: North America Anti Hypertensive Drugs Industry Revenue (Million), by Country 2024 & 2032
- Figure 4: North America Anti Hypertensive Drugs Industry Volume (K Unit), by Country 2024 & 2032
- Figure 5: North America Anti Hypertensive Drugs Industry Revenue Share (%), by Country 2024 & 2032
- Figure 6: North America Anti Hypertensive Drugs Industry Volume Share (%), by Country 2024 & 2032
- Figure 7: Europe Anti Hypertensive Drugs Industry Revenue (Million), by Country 2024 & 2032
- Figure 8: Europe Anti Hypertensive Drugs Industry Volume (K Unit), by Country 2024 & 2032
- Figure 9: Europe Anti Hypertensive Drugs Industry Revenue Share (%), by Country 2024 & 2032
- Figure 10: Europe Anti Hypertensive Drugs Industry Volume Share (%), by Country 2024 & 2032
- Figure 11: Asia Pacific Anti Hypertensive Drugs Industry Revenue (Million), by Country 2024 & 2032
- Figure 12: Asia Pacific Anti Hypertensive Drugs Industry Volume (K Unit), by Country 2024 & 2032
- Figure 13: Asia Pacific Anti Hypertensive Drugs Industry Revenue Share (%), by Country 2024 & 2032
- Figure 14: Asia Pacific Anti Hypertensive Drugs Industry Volume Share (%), by Country 2024 & 2032
- Figure 15: Middle East and Africa Anti Hypertensive Drugs Industry Revenue (Million), by Country 2024 & 2032
- Figure 16: Middle East and Africa Anti Hypertensive Drugs Industry Volume (K Unit), by Country 2024 & 2032
- Figure 17: Middle East and Africa Anti Hypertensive Drugs Industry Revenue Share (%), by Country 2024 & 2032
- Figure 18: Middle East and Africa Anti Hypertensive Drugs Industry Volume Share (%), by Country 2024 & 2032
- Figure 19: South America Anti Hypertensive Drugs Industry Revenue (Million), by Country 2024 & 2032
- Figure 20: South America Anti Hypertensive Drugs Industry Volume (K Unit), by Country 2024 & 2032
- Figure 21: South America Anti Hypertensive Drugs Industry Revenue Share (%), by Country 2024 & 2032
- Figure 22: South America Anti Hypertensive Drugs Industry Volume Share (%), by Country 2024 & 2032
- Figure 23: North America Anti Hypertensive Drugs Industry Revenue (Million), by Therapeutic Class 2024 & 2032
- Figure 24: North America Anti Hypertensive Drugs Industry Volume (K Unit), by Therapeutic Class 2024 & 2032
- Figure 25: North America Anti Hypertensive Drugs Industry Revenue Share (%), by Therapeutic Class 2024 & 2032
- Figure 26: North America Anti Hypertensive Drugs Industry Volume Share (%), by Therapeutic Class 2024 & 2032
- Figure 27: North America Anti Hypertensive Drugs Industry Revenue (Million), by Country 2024 & 2032
- Figure 28: North America Anti Hypertensive Drugs Industry Volume (K Unit), by Country 2024 & 2032
- Figure 29: North America Anti Hypertensive Drugs Industry Revenue Share (%), by Country 2024 & 2032
- Figure 30: North America Anti Hypertensive Drugs Industry Volume Share (%), by Country 2024 & 2032
- Figure 31: Europe Anti Hypertensive Drugs Industry Revenue (Million), by Therapeutic Class 2024 & 2032
- Figure 32: Europe Anti Hypertensive Drugs Industry Volume (K Unit), by Therapeutic Class 2024 & 2032
- Figure 33: Europe Anti Hypertensive Drugs Industry Revenue Share (%), by Therapeutic Class 2024 & 2032
- Figure 34: Europe Anti Hypertensive Drugs Industry Volume Share (%), by Therapeutic Class 2024 & 2032
- Figure 35: Europe Anti Hypertensive Drugs Industry Revenue (Million), by Country 2024 & 2032
- Figure 36: Europe Anti Hypertensive Drugs Industry Volume (K Unit), by Country 2024 & 2032
- Figure 37: Europe Anti Hypertensive Drugs Industry Revenue Share (%), by Country 2024 & 2032
- Figure 38: Europe Anti Hypertensive Drugs Industry Volume Share (%), by Country 2024 & 2032
- Figure 39: Asia Pacific Anti Hypertensive Drugs Industry Revenue (Million), by Therapeutic Class 2024 & 2032
- Figure 40: Asia Pacific Anti Hypertensive Drugs Industry Volume (K Unit), by Therapeutic Class 2024 & 2032
- Figure 41: Asia Pacific Anti Hypertensive Drugs Industry Revenue Share (%), by Therapeutic Class 2024 & 2032
- Figure 42: Asia Pacific Anti Hypertensive Drugs Industry Volume Share (%), by Therapeutic Class 2024 & 2032
- Figure 43: Asia Pacific Anti Hypertensive Drugs Industry Revenue (Million), by Country 2024 & 2032
- Figure 44: Asia Pacific Anti Hypertensive Drugs Industry Volume (K Unit), by Country 2024 & 2032
- Figure 45: Asia Pacific Anti Hypertensive Drugs Industry Revenue Share (%), by Country 2024 & 2032
- Figure 46: Asia Pacific Anti Hypertensive Drugs Industry Volume Share (%), by Country 2024 & 2032
- Figure 47: Middle East and Africa Anti Hypertensive Drugs Industry Revenue (Million), by Therapeutic Class 2024 & 2032
- Figure 48: Middle East and Africa Anti Hypertensive Drugs Industry Volume (K Unit), by Therapeutic Class 2024 & 2032
- Figure 49: Middle East and Africa Anti Hypertensive Drugs Industry Revenue Share (%), by Therapeutic Class 2024 & 2032
- Figure 50: Middle East and Africa Anti Hypertensive Drugs Industry Volume Share (%), by Therapeutic Class 2024 & 2032
- Figure 51: Middle East and Africa Anti Hypertensive Drugs Industry Revenue (Million), by Country 2024 & 2032
- Figure 52: Middle East and Africa Anti Hypertensive Drugs Industry Volume (K Unit), by Country 2024 & 2032
- Figure 53: Middle East and Africa Anti Hypertensive Drugs Industry Revenue Share (%), by Country 2024 & 2032
- Figure 54: Middle East and Africa Anti Hypertensive Drugs Industry Volume Share (%), by Country 2024 & 2032
- Figure 55: South America Anti Hypertensive Drugs Industry Revenue (Million), by Therapeutic Class 2024 & 2032
- Figure 56: South America Anti Hypertensive Drugs Industry Volume (K Unit), by Therapeutic Class 2024 & 2032
- Figure 57: South America Anti Hypertensive Drugs Industry Revenue Share (%), by Therapeutic Class 2024 & 2032
- Figure 58: South America Anti Hypertensive Drugs Industry Volume Share (%), by Therapeutic Class 2024 & 2032
- Figure 59: South America Anti Hypertensive Drugs Industry Revenue (Million), by Country 2024 & 2032
- Figure 60: South America Anti Hypertensive Drugs Industry Volume (K Unit), by Country 2024 & 2032
- Figure 61: South America Anti Hypertensive Drugs Industry Revenue Share (%), by Country 2024 & 2032
- Figure 62: South America Anti Hypertensive Drugs Industry Volume Share (%), by Country 2024 & 2032
List of Tables
- Table 1: Global Anti Hypertensive Drugs Industry Revenue Million Forecast, by Region 2019 & 2032
- Table 2: Global Anti Hypertensive Drugs Industry Volume K Unit Forecast, by Region 2019 & 2032
- Table 3: Global Anti Hypertensive Drugs Industry Revenue Million Forecast, by Therapeutic Class 2019 & 2032
- Table 4: Global Anti Hypertensive Drugs Industry Volume K Unit Forecast, by Therapeutic Class 2019 & 2032
- Table 5: Global Anti Hypertensive Drugs Industry Revenue Million Forecast, by Region 2019 & 2032
- Table 6: Global Anti Hypertensive Drugs Industry Volume K Unit Forecast, by Region 2019 & 2032
- Table 7: Global Anti Hypertensive Drugs Industry Revenue Million Forecast, by Country 2019 & 2032
- Table 8: Global Anti Hypertensive Drugs Industry Volume K Unit Forecast, by Country 2019 & 2032
- Table 9: Global Anti Hypertensive Drugs Industry Revenue Million Forecast, by Country 2019 & 2032
- Table 10: Global Anti Hypertensive Drugs Industry Volume K Unit Forecast, by Country 2019 & 2032
- Table 11: Global Anti Hypertensive Drugs Industry Revenue Million Forecast, by Country 2019 & 2032
- Table 12: Global Anti Hypertensive Drugs Industry Volume K Unit Forecast, by Country 2019 & 2032
- Table 13: Global Anti Hypertensive Drugs Industry Revenue Million Forecast, by Country 2019 & 2032
- Table 14: Global Anti Hypertensive Drugs Industry Volume K Unit Forecast, by Country 2019 & 2032
- Table 15: Global Anti Hypertensive Drugs Industry Revenue Million Forecast, by Country 2019 & 2032
- Table 16: Global Anti Hypertensive Drugs Industry Volume K Unit Forecast, by Country 2019 & 2032
- Table 17: Global Anti Hypertensive Drugs Industry Revenue Million Forecast, by Therapeutic Class 2019 & 2032
- Table 18: Global Anti Hypertensive Drugs Industry Volume K Unit Forecast, by Therapeutic Class 2019 & 2032
- Table 19: Global Anti Hypertensive Drugs Industry Revenue Million Forecast, by Country 2019 & 2032
- Table 20: Global Anti Hypertensive Drugs Industry Volume K Unit Forecast, by Country 2019 & 2032
- Table 21: United States Anti Hypertensive Drugs Industry Revenue (Million) Forecast, by Application 2019 & 2032
- Table 22: United States Anti Hypertensive Drugs Industry Volume (K Unit) Forecast, by Application 2019 & 2032
- Table 23: Canada Anti Hypertensive Drugs Industry Revenue (Million) Forecast, by Application 2019 & 2032
- Table 24: Canada Anti Hypertensive Drugs Industry Volume (K Unit) Forecast, by Application 2019 & 2032
- Table 25: Mexico Anti Hypertensive Drugs Industry Revenue (Million) Forecast, by Application 2019 & 2032
- Table 26: Mexico Anti Hypertensive Drugs Industry Volume (K Unit) Forecast, by Application 2019 & 2032
- Table 27: Global Anti Hypertensive Drugs Industry Revenue Million Forecast, by Therapeutic Class 2019 & 2032
- Table 28: Global Anti Hypertensive Drugs Industry Volume K Unit Forecast, by Therapeutic Class 2019 & 2032
- Table 29: Global Anti Hypertensive Drugs Industry Revenue Million Forecast, by Country 2019 & 2032
- Table 30: Global Anti Hypertensive Drugs Industry Volume K Unit Forecast, by Country 2019 & 2032
- Table 31: Germany Anti Hypertensive Drugs Industry Revenue (Million) Forecast, by Application 2019 & 2032
- Table 32: Germany Anti Hypertensive Drugs Industry Volume (K Unit) Forecast, by Application 2019 & 2032
- Table 33: United Kingdom Anti Hypertensive Drugs Industry Revenue (Million) Forecast, by Application 2019 & 2032
- Table 34: United Kingdom Anti Hypertensive Drugs Industry Volume (K Unit) Forecast, by Application 2019 & 2032
- Table 35: France Anti Hypertensive Drugs Industry Revenue (Million) Forecast, by Application 2019 & 2032
- Table 36: France Anti Hypertensive Drugs Industry Volume (K Unit) Forecast, by Application 2019 & 2032
- Table 37: Italy Anti Hypertensive Drugs Industry Revenue (Million) Forecast, by Application 2019 & 2032
- Table 38: Italy Anti Hypertensive Drugs Industry Volume (K Unit) Forecast, by Application 2019 & 2032
- Table 39: Spain Anti Hypertensive Drugs Industry Revenue (Million) Forecast, by Application 2019 & 2032
- Table 40: Spain Anti Hypertensive Drugs Industry Volume (K Unit) Forecast, by Application 2019 & 2032
- Table 41: Rest of Europe Anti Hypertensive Drugs Industry Revenue (Million) Forecast, by Application 2019 & 2032
- Table 42: Rest of Europe Anti Hypertensive Drugs Industry Volume (K Unit) Forecast, by Application 2019 & 2032
- Table 43: Global Anti Hypertensive Drugs Industry Revenue Million Forecast, by Therapeutic Class 2019 & 2032
- Table 44: Global Anti Hypertensive Drugs Industry Volume K Unit Forecast, by Therapeutic Class 2019 & 2032
- Table 45: Global Anti Hypertensive Drugs Industry Revenue Million Forecast, by Country 2019 & 2032
- Table 46: Global Anti Hypertensive Drugs Industry Volume K Unit Forecast, by Country 2019 & 2032
- Table 47: China Anti Hypertensive Drugs Industry Revenue (Million) Forecast, by Application 2019 & 2032
- Table 48: China Anti Hypertensive Drugs Industry Volume (K Unit) Forecast, by Application 2019 & 2032
- Table 49: Japan Anti Hypertensive Drugs Industry Revenue (Million) Forecast, by Application 2019 & 2032
- Table 50: Japan Anti Hypertensive Drugs Industry Volume (K Unit) Forecast, by Application 2019 & 2032
- Table 51: India Anti Hypertensive Drugs Industry Revenue (Million) Forecast, by Application 2019 & 2032
- Table 52: India Anti Hypertensive Drugs Industry Volume (K Unit) Forecast, by Application 2019 & 2032
- Table 53: Australia Anti Hypertensive Drugs Industry Revenue (Million) Forecast, by Application 2019 & 2032
- Table 54: Australia Anti Hypertensive Drugs Industry Volume (K Unit) Forecast, by Application 2019 & 2032
- Table 55: South korea Anti Hypertensive Drugs Industry Revenue (Million) Forecast, by Application 2019 & 2032
- Table 56: South korea Anti Hypertensive Drugs Industry Volume (K Unit) Forecast, by Application 2019 & 2032
- Table 57: Rest of Asia Pacific Anti Hypertensive Drugs Industry Revenue (Million) Forecast, by Application 2019 & 2032
- Table 58: Rest of Asia Pacific Anti Hypertensive Drugs Industry Volume (K Unit) Forecast, by Application 2019 & 2032
- Table 59: Global Anti Hypertensive Drugs Industry Revenue Million Forecast, by Therapeutic Class 2019 & 2032
- Table 60: Global Anti Hypertensive Drugs Industry Volume K Unit Forecast, by Therapeutic Class 2019 & 2032
- Table 61: Global Anti Hypertensive Drugs Industry Revenue Million Forecast, by Country 2019 & 2032
- Table 62: Global Anti Hypertensive Drugs Industry Volume K Unit Forecast, by Country 2019 & 2032
- Table 63: GCC Anti Hypertensive Drugs Industry Revenue (Million) Forecast, by Application 2019 & 2032
- Table 64: GCC Anti Hypertensive Drugs Industry Volume (K Unit) Forecast, by Application 2019 & 2032
- Table 65: South Africa Anti Hypertensive Drugs Industry Revenue (Million) Forecast, by Application 2019 & 2032
- Table 66: South Africa Anti Hypertensive Drugs Industry Volume (K Unit) Forecast, by Application 2019 & 2032
- Table 67: Rest of Middle East and Africa Anti Hypertensive Drugs Industry Revenue (Million) Forecast, by Application 2019 & 2032
- Table 68: Rest of Middle East and Africa Anti Hypertensive Drugs Industry Volume (K Unit) Forecast, by Application 2019 & 2032
- Table 69: Global Anti Hypertensive Drugs Industry Revenue Million Forecast, by Therapeutic Class 2019 & 2032
- Table 70: Global Anti Hypertensive Drugs Industry Volume K Unit Forecast, by Therapeutic Class 2019 & 2032
- Table 71: Global Anti Hypertensive Drugs Industry Revenue Million Forecast, by Country 2019 & 2032
- Table 72: Global Anti Hypertensive Drugs Industry Volume K Unit Forecast, by Country 2019 & 2032
- Table 73: Brazil Anti Hypertensive Drugs Industry Revenue (Million) Forecast, by Application 2019 & 2032
- Table 74: Brazil Anti Hypertensive Drugs Industry Volume (K Unit) Forecast, by Application 2019 & 2032
- Table 75: Argentina Anti Hypertensive Drugs Industry Revenue (Million) Forecast, by Application 2019 & 2032
- Table 76: Argentina Anti Hypertensive Drugs Industry Volume (K Unit) Forecast, by Application 2019 & 2032
- Table 77: Rest of South America Anti Hypertensive Drugs Industry Revenue (Million) Forecast, by Application 2019 & 2032
- Table 78: Rest of South America Anti Hypertensive Drugs Industry Volume (K Unit) Forecast, by Application 2019 & 2032
Frequently Asked Questions
1. What is the projected Compound Annual Growth Rate (CAGR) of the Anti Hypertensive Drugs Industry?
The projected CAGR is approximately 4.50%.
2. Which companies are prominent players in the Anti Hypertensive Drugs Industry?
Key companies in the market include Sanofi SA, Daiichi Sankyo Company Limited, Merck KGaA, Novartis International AG, Ranbaxy Laboratories Limited, C H Boehringer Sohn AG & Ko KG, AstraZeneca PLC, Johnson & Johnson, Lupin Limited, Noden Pharma DAC, Pfizer Inc.
3. What are the main segments of the Anti Hypertensive Drugs Industry?
The market segments include Therapeutic Class.
4. Can you provide details about the market size?
The market size is estimated to be USD XX Million as of 2022.
5. What are some drivers contributing to market growth?
Increasing Prevalence of Hypertension; Growing Initiatives by Private and Government Organizations; Rising Awareness about Hypertension.
6. What are the notable trends driving market growth?
Diuretics Therapeutics Class is Expected to Hold a Significant Market Share in the Forecast Period.
7. Are there any restraints impacting market growth?
Multiple Major Drug Patent Expiration; Side-effects of Treatment Options and Rise in Non-pharmacological Therapy.
8. Can you provide examples of recent developments in the market?
In May 2022, Hanmi Pharmaceutical revealed that it will start marketing its blockbuster hypertension drug Amosartan under the brand name Meiyaping in China. It marked the first homegrown blood pressure combination therapy to enter the Chinese market.
9. What pricing options are available for accessing the report?
Pricing options include single-user, multi-user, and enterprise licenses priced at USD 4750, USD 5250, and USD 8750 respectively.
10. Is the market size provided in terms of value or volume?
The market size is provided in terms of value, measured in Million and volume, measured in K Unit.
11. Are there any specific market keywords associated with the report?
Yes, the market keyword associated with the report is "Anti Hypertensive Drugs Industry," which aids in identifying and referencing the specific market segment covered.
12. How do I determine which pricing option suits my needs best?
The pricing options vary based on user requirements and access needs. Individual users may opt for single-user licenses, while businesses requiring broader access may choose multi-user or enterprise licenses for cost-effective access to the report.
13. Are there any additional resources or data provided in the Anti Hypertensive Drugs Industry report?
While the report offers comprehensive insights, it's advisable to review the specific contents or supplementary materials provided to ascertain if additional resources or data are available.
14. How can I stay updated on further developments or reports in the Anti Hypertensive Drugs Industry?
To stay informed about further developments, trends, and reports in the Anti Hypertensive Drugs Industry, consider subscribing to industry newsletters, following relevant companies and organizations, or regularly checking reputable industry news sources and publications.
Methodology
Step 1 - Identification of Relevant Samples Size from Population Database


Step 2 - Approaches for Defining Global Market Size (Value, Volume* & Price*)

Note*: In applicable scenarios
Step 3 - Data Sources
Primary Research
- Web Analytics
- Survey Reports
- Research Institute
- Latest Research Reports
- Opinion Leaders
Secondary Research
- Annual Reports
- White Paper
- Latest Press Release
- Industry Association
- Paid Database
- Investor Presentations

Step 4 - Data Triangulation
Involves using different sources of information in order to increase the validity of a study
These sources are likely to be stakeholders in a program - participants, other researchers, program staff, other community members, and so on.
Then we put all data in single framework & apply various statistical tools to find out the dynamic on the market.
During the analysis stage, feedback from the stakeholder groups would be compared to determine areas of agreement as well as areas of divergence


