

Key Insights
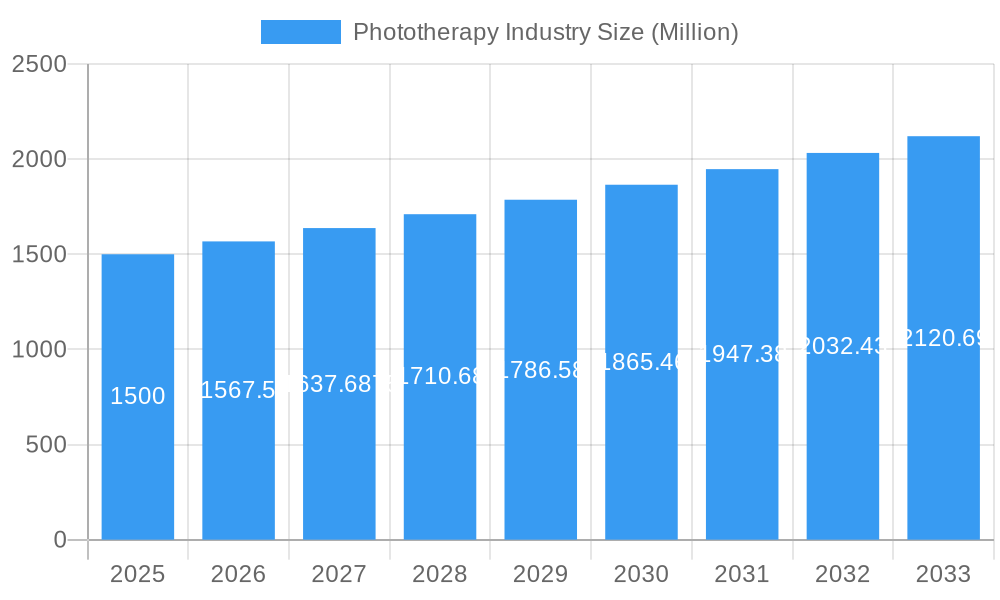
The phototherapy market, valued at 649.37 million in 2025, is projected to achieve a compound annual growth rate (CAGR) of 4.1% from 2025 to 2033. This growth is propelled by the increasing prevalence of dermatological conditions such as psoriasis and acne, alongside heightened awareness of phototherapy's therapeutic effectiveness. Furthermore, the rising incidence of Seasonal Affective Disorder (SAD) and other mental health concerns is driving the adoption of light therapy for mood regulation. Technological innovations, including the development of more compact and user-friendly devices, are also contributing to market expansion. The home care segment exhibits particularly strong growth due to the convenience and cost-effectiveness of at-home treatments. However, high initial investment costs for professional equipment and potential side effects associated with certain light therapies may present challenges to market growth. The market is segmented by end-user, product type, light type, and application. North America and Europe currently dominate market share, with the Asia-Pacific region poised for significant growth driven by increasing disposable incomes and healthcare awareness.
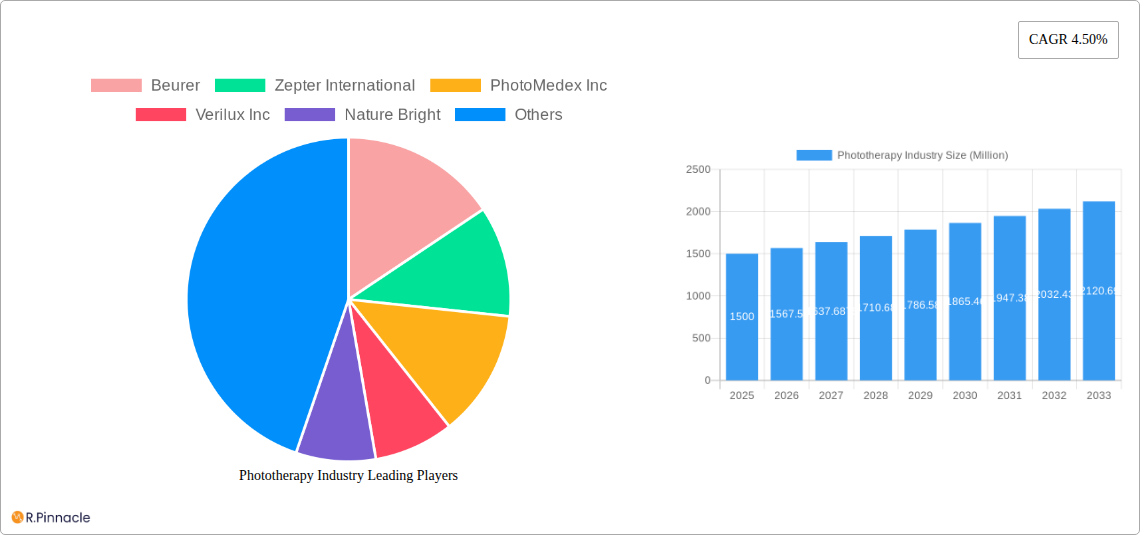
Phototherapy Industry Market Size (In Million)
The competitive landscape features established companies and specialized phototherapy technology firms focusing on product innovation, distribution expansion, and brand building. Future market expansion will be influenced by advancements in light technology, improved device portability, personalized treatment protocols, and a strong emphasis on regulatory approvals and safety guidelines. The integration of phototherapy into mainstream healthcare settings, strategic partnerships between manufacturers and healthcare providers, and ongoing research into light wavelength efficacy for specific conditions will be key drivers for the phototherapy market.
Phototherapy Industry Company Market Share
Phototherapy Industry Market Report: 2019-2033
This comprehensive report provides a detailed analysis of the global phototherapy industry, projecting a market size of $XX Million by 2033. The report covers the period 2019-2033, with a focus on the 2025-2033 forecast period. It offers actionable insights for industry professionals, investors, and researchers seeking to understand and capitalize on the growth opportunities within this dynamic sector.
Phototherapy Industry Market Structure & Innovation Trends
The phototherapy market is moderately fragmented, with key players such as Beurer, Zepter International, PhotoMedex Inc, Verilux Inc, Nature Bright, Revian Inc, Koninklijke Philips N V, Northern Light Technologies, Lumie, BioPhotas, Carex, and Lucimed SA competing for market share. Market concentration is expected to increase slightly by 2033 due to strategic mergers and acquisitions (M&A) activity. Innovation is driven by advancements in light technology, miniaturization of devices, and the expansion of applications beyond traditional treatments. Regulatory frameworks vary across regions, impacting market access and product approvals. The industry faces competition from alternative treatments, and the report analyzes the impact of substitute therapies on market growth. End-user demographics are diverse, ranging from dermatology clinics to home users, influencing product development and marketing strategies.
- Market Share (2025): Beurer (XX%), Philips (XX%), PhotoMedex (XX%), Others (XX%)
- M&A Activity (2019-2024): Total deal value estimated at $XX Million, with a focus on expanding product portfolios and geographic reach.
Phototherapy Industry Market Dynamics & Trends
The global phototherapy market is experiencing robust growth, driven by rising prevalence of skin disorders and mental health conditions, increased awareness of light therapy benefits, and technological advancements leading to improved efficacy and convenience. The market is projected to exhibit a Compound Annual Growth Rate (CAGR) of XX% during the forecast period (2025-2033). This growth is further fueled by the rising adoption of home-based light therapy devices, driven by increasing consumer preference for convenient and cost-effective solutions. Technological disruptions, such as the development of smart, wearable light therapy devices, are transforming the market landscape. Competitive dynamics are intense, with companies focusing on product differentiation, strategic partnerships, and expansion into new markets. Market penetration of light therapy treatments is increasing steadily across various segments.
Dominant Regions & Segments in Phototherapy Industry
North America currently dominates the phototherapy market, driven by high healthcare expenditure, advanced healthcare infrastructure, and strong regulatory support. However, Asia-Pacific is expected to experience the fastest growth rate during the forecast period due to the rising prevalence of skin diseases and increasing disposable incomes.
Key Drivers by Segment:
End User:
- Dermatology Clinics: High adoption rates due to efficacy and integration with existing treatments.
- Home Care Settings: Driven by convenience, cost-effectiveness, and rising awareness among consumers.
- Others (Workplace, Salons): Growing adoption for wellness applications and specialized treatments.
Product Type:
- Light Boxes: Remain the dominant product type due to established efficacy and cost-effectiveness.
- Floor and Desk Lamps: Growing popularity due to their versatility and ease of use.
- Other Product Types (Light Visors, Dawn Simulators, etc.): These represent niche segments with specific applications.
Light Type:
- White Light: Widely used for its versatility and effectiveness in treating various conditions.
- Blue Light: Primarily used for treating acne and other skin conditions.
- Red Light: Growing applications in wound healing and anti-aging treatments.
Application:
- Skin Disorders: Represents the largest application segment due to the high prevalence of conditions like psoriasis and eczema.
- Mental Health Disorders: Growing adoption for treating seasonal affective disorder (SAD) and other mood disorders.
- Vitamin D Deficiency: Significant demand for light therapy as a supplementary treatment.
- Neonatal Jaundice: Increasing use of advanced light therapy devices for effective treatment.
Phototherapy Industry Product Innovations
Recent innovations focus on the development of smaller, more portable, and user-friendly devices, personalized light therapy solutions, and integration with smart home technology. The emergence of wearable light therapy devices, such as those developed by Bilihome, highlights the industry’s focus on enhancing convenience and accessibility. Companies are also developing innovative light sources and delivery methods to improve efficacy and minimize side effects. These innovations are enhancing the market fit of phototherapy, expanding its appeal to a wider range of consumers and healthcare professionals.
Report Scope & Segmentation Analysis
This report provides a detailed segmentation analysis of the phototherapy market based on end-user, product type, light type, and application. Each segment is analyzed based on its growth potential, market size (in $ Millions), and competitive landscape. Growth projections for each segment are provided for the forecast period (2025-2033). The report includes a competitive analysis of key players within each segment, highlighting their market share, strengths, and weaknesses.
Key Drivers of Phototherapy Industry Growth
The phototherapy market is driven by a confluence of factors, including the increasing prevalence of skin disorders and mental health conditions, technological advancements resulting in more effective and user-friendly devices, growing consumer awareness of the benefits of light therapy, and supportive regulatory frameworks in several key markets. Furthermore, rising healthcare expenditure and the adoption of light therapy as a cost-effective treatment option contribute to the market's growth. Government initiatives promoting mental health awareness also play a significant role.
Challenges in the Phototherapy Industry Sector
The phototherapy industry faces several challenges, including the stringent regulatory requirements for medical devices, potential side effects associated with certain light types, variations in efficacy across different applications, and the high cost of advanced devices. Supply chain disruptions can impact the availability of components, affecting production and market supply. Intense competition and the emergence of alternative treatments also pose challenges for market players. These factors can potentially constrain market growth.
Emerging Opportunities in Phototherapy Industry
Emerging opportunities lie in the development of personalized light therapy solutions, the expansion into new therapeutic applications, and the integration of light therapy with other treatment modalities. Growing interest in holistic wellness and preventative healthcare presents a significant opportunity for market expansion. The development of smart and wearable devices enhances patient compliance and convenience, increasing the accessibility of light therapy. Expansion into emerging markets with high growth potential also offers substantial opportunities.
Leading Players in the Phototherapy Industry Market
- Beurer
- Zepter International
- PhotoMedex Inc
- Verilux Inc
- Nature Bright
- Revian Inc
- Koninklijke Philips N V
- Northern Light Technologies
- Lumie
- BioPhotas
- Carex
- Lucimed SA
Key Developments in Phototherapy Industry
- February 2022: STRATA Skin Sciences, Inc. launched the XTRAC Momentum 1.0 excimer laser system for treating inflammatory skin conditions. This advancement represents a significant step forward in targeted UVB light therapy.
- January 2022: Bilihome secured funding to support the market launch of a smart, wearable light therapy device for neonatal jaundice, addressing a significant unmet need.
Future Outlook for Phototherapy Industry Market
The phototherapy industry is poised for continued growth, driven by technological advancements, rising prevalence of target conditions, and growing consumer awareness. Strategic partnerships, product diversification, and expansion into new geographic markets will be crucial for success. The development of personalized and integrated light therapy solutions will shape the future of the industry, offering significant opportunities for market expansion and improved patient outcomes. The market is expected to reach $XX Million by 2033.
Phototherapy Industry Segmentation
-
1. Product Type
- 1.1. Light Box
- 1.2. Floor and Desk Lamps
- 1.3. Light Visor
- 1.4. Dawn Simulator
- 1.5. Light Therapy Bulbs
- 1.6. Handheld Devices
-
2. Light Type
- 2.1. White Light
- 2.2. Blue Light
- 2.3. Red Light
- 2.4. Others (Green and Yellow Light)
-
3. Application
- 3.1. Vitamin D Deficiency
- 3.2. Mental Health Disorders
- 3.3. Skin Disorders
- 3.4. Neonatal Jaundice
-
4. End User
- 4.1. Dermatology Clinics
- 4.2. Home Care Settings
- 4.3. Others (Workplace, Salons, etc.)
Phototherapy Industry Segmentation By Geography
-
1. North America
- 1.1. United States
- 1.2. Canada
- 1.3. Mexico
-
2. Europe
- 2.1. Germany
- 2.2. United Kingdom
- 2.3. France
- 2.4. Italy
- 2.5. Spain
- 2.6. Rest of Europe
-
3. Asia Pacific
- 3.1. China
- 3.2. Japan
- 3.3. India
- 3.4. Australia
- 3.5. South Korea
- 3.6. Rest of Asia Pacific
-
4. Middle East and Africa
- 4.1. GCC
- 4.2. South Africa
- 4.3. Rest of Middle East and Africa
-
5. South America
- 5.1. Brazil
- 5.2. Argentina
- 5.3. Rest of South America
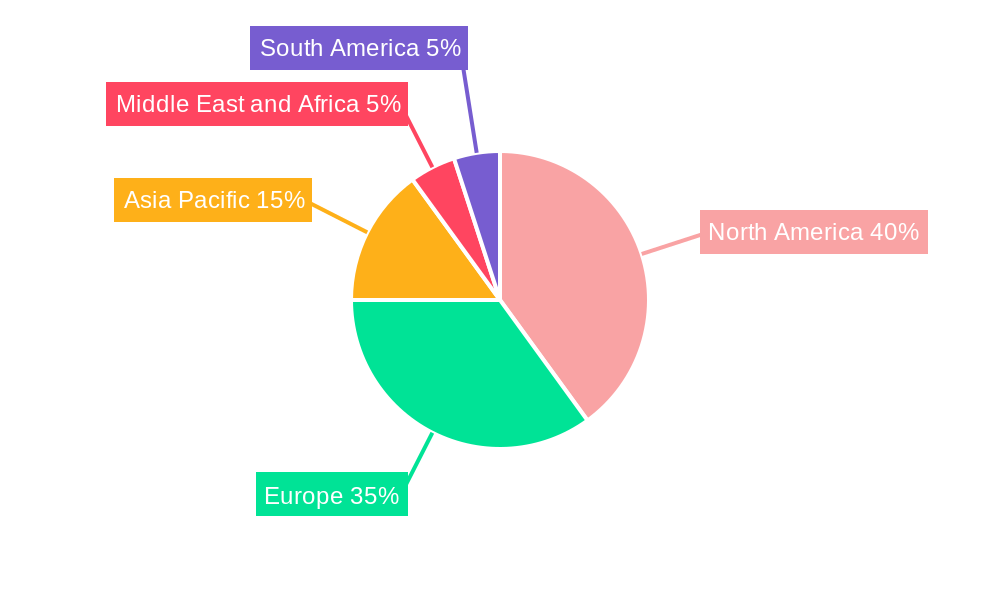
Phototherapy Industry Regional Market Share
Geographic Coverage of Phototherapy Industry
Phototherapy Industry REPORT HIGHLIGHTS
| Aspects | Details |
|---|---|
| Study Period | 2020-2034 |
| Base Year | 2025 |
| Estimated Year | 2026 |
| Forecast Period | 2026-2034 |
| Historical Period | 2020-2025 |
| Growth Rate | CAGR of 4.1% from 2020-2034 |
| Segmentation |
|
Table of Contents
- 1. Introduction
- 1.1. Research Scope
- 1.2. Market Segmentation
- 1.3. Research Objective
- 1.4. Definitions and Assumptions
- 2. Executive Summary
- 2.1. Market Snapshot
- 3. Market Dynamics
- 3.1. Market Drivers
- 3.2. Market Restrains
- 3.3. Market Trends
- 3.4. Market Opportunities
- 4. Market Factor Analysis
- 4.1. Porters Five Forces
- 4.1.1. Bargaining Power of Suppliers
- 4.1.2. Bargaining Power of Buyers
- 4.1.3. Threat of New Entrants
- 4.1.4. Threat of Substitutes
- 4.1.5. Competitive Rivalry
- 4.2. PESTEL analysis
- 4.3. BCG Analysis
- 4.3.1. Stars (High Growth, High Market Share)
- 4.3.2. Cash Cows (Low Growth, High Market Share)
- 4.3.3. Question Mark (High Growth, Low Market Share)
- 4.3.4. Dogs (Low Growth, Low Market Share)
- 4.4. Ansoff Matrix Analysis
- 4.5. Supply Chain Analysis
- 4.6. Regulatory Landscape
- 4.7. Current Market Potential and Opportunity Assessment (TAM–SAM–SOM Framework)
- 4.8. PRI Analyst Note
- 4.1. Porters Five Forces
- 5. Market Analysis, Insights and Forecast 2021-2033
- 5.1. Market Analysis, Insights and Forecast - by Product Type
- 5.1.1. Light Box
- 5.1.2. Floor and Desk Lamps
- 5.1.3. Light Visor
- 5.1.4. Dawn Simulator
- 5.1.5. Light Therapy Bulbs
- 5.1.6. Handheld Devices
- 5.2. Market Analysis, Insights and Forecast - by Light Type
- 5.2.1. White Light
- 5.2.2. Blue Light
- 5.2.3. Red Light
- 5.2.4. Others (Green and Yellow Light)
- 5.3. Market Analysis, Insights and Forecast - by Application
- 5.3.1. Vitamin D Deficiency
- 5.3.2. Mental Health Disorders
- 5.3.3. Skin Disorders
- 5.3.4. Neonatal Jaundice
- 5.4. Market Analysis, Insights and Forecast - by End User
- 5.4.1. Dermatology Clinics
- 5.4.2. Home Care Settings
- 5.4.3. Others (Workplace, Salons, etc.)
- 5.5. Market Analysis, Insights and Forecast - by Region
- 5.5.1. North America
- 5.5.2. Europe
- 5.5.3. Asia Pacific
- 5.5.4. Middle East and Africa
- 5.5.5. South America
- 5.1. Market Analysis, Insights and Forecast - by Product Type
- 6. Global Phototherapy Industry Analysis, Insights and Forecast, 2021-2033
- 6.1. Market Analysis, Insights and Forecast - by Product Type
- 6.1.1. Light Box
- 6.1.2. Floor and Desk Lamps
- 6.1.3. Light Visor
- 6.1.4. Dawn Simulator
- 6.1.5. Light Therapy Bulbs
- 6.1.6. Handheld Devices
- 6.2. Market Analysis, Insights and Forecast - by Light Type
- 6.2.1. White Light
- 6.2.2. Blue Light
- 6.2.3. Red Light
- 6.2.4. Others (Green and Yellow Light)
- 6.3. Market Analysis, Insights and Forecast - by Application
- 6.3.1. Vitamin D Deficiency
- 6.3.2. Mental Health Disorders
- 6.3.3. Skin Disorders
- 6.3.4. Neonatal Jaundice
- 6.4. Market Analysis, Insights and Forecast - by End User
- 6.4.1. Dermatology Clinics
- 6.4.2. Home Care Settings
- 6.4.3. Others (Workplace, Salons, etc.)
- 6.1. Market Analysis, Insights and Forecast - by Product Type
- 7. North America Phototherapy Industry Analysis, Insights and Forecast, 2020-2032
- 7.1. Market Analysis, Insights and Forecast - by Product Type
- 7.1.1. Light Box
- 7.1.2. Floor and Desk Lamps
- 7.1.3. Light Visor
- 7.1.4. Dawn Simulator
- 7.1.5. Light Therapy Bulbs
- 7.1.6. Handheld Devices
- 7.2. Market Analysis, Insights and Forecast - by Light Type
- 7.2.1. White Light
- 7.2.2. Blue Light
- 7.2.3. Red Light
- 7.2.4. Others (Green and Yellow Light)
- 7.3. Market Analysis, Insights and Forecast - by Application
- 7.3.1. Vitamin D Deficiency
- 7.3.2. Mental Health Disorders
- 7.3.3. Skin Disorders
- 7.3.4. Neonatal Jaundice
- 7.4. Market Analysis, Insights and Forecast - by End User
- 7.4.1. Dermatology Clinics
- 7.4.2. Home Care Settings
- 7.4.3. Others (Workplace, Salons, etc.)
- 7.1. Market Analysis, Insights and Forecast - by Product Type
- 8. Europe Phototherapy Industry Analysis, Insights and Forecast, 2020-2032
- 8.1. Market Analysis, Insights and Forecast - by Product Type
- 8.1.1. Light Box
- 8.1.2. Floor and Desk Lamps
- 8.1.3. Light Visor
- 8.1.4. Dawn Simulator
- 8.1.5. Light Therapy Bulbs
- 8.1.6. Handheld Devices
- 8.2. Market Analysis, Insights and Forecast - by Light Type
- 8.2.1. White Light
- 8.2.2. Blue Light
- 8.2.3. Red Light
- 8.2.4. Others (Green and Yellow Light)
- 8.3. Market Analysis, Insights and Forecast - by Application
- 8.3.1. Vitamin D Deficiency
- 8.3.2. Mental Health Disorders
- 8.3.3. Skin Disorders
- 8.3.4. Neonatal Jaundice
- 8.4. Market Analysis, Insights and Forecast - by End User
- 8.4.1. Dermatology Clinics
- 8.4.2. Home Care Settings
- 8.4.3. Others (Workplace, Salons, etc.)
- 8.1. Market Analysis, Insights and Forecast - by Product Type
- 9. Asia Pacific Phototherapy Industry Analysis, Insights and Forecast, 2020-2032
- 9.1. Market Analysis, Insights and Forecast - by Product Type
- 9.1.1. Light Box
- 9.1.2. Floor and Desk Lamps
- 9.1.3. Light Visor
- 9.1.4. Dawn Simulator
- 9.1.5. Light Therapy Bulbs
- 9.1.6. Handheld Devices
- 9.2. Market Analysis, Insights and Forecast - by Light Type
- 9.2.1. White Light
- 9.2.2. Blue Light
- 9.2.3. Red Light
- 9.2.4. Others (Green and Yellow Light)
- 9.3. Market Analysis, Insights and Forecast - by Application
- 9.3.1. Vitamin D Deficiency
- 9.3.2. Mental Health Disorders
- 9.3.3. Skin Disorders
- 9.3.4. Neonatal Jaundice
- 9.4. Market Analysis, Insights and Forecast - by End User
- 9.4.1. Dermatology Clinics
- 9.4.2. Home Care Settings
- 9.4.3. Others (Workplace, Salons, etc.)
- 9.1. Market Analysis, Insights and Forecast - by Product Type
- 10. Middle East and Africa Phototherapy Industry Analysis, Insights and Forecast, 2020-2032
- 10.1. Market Analysis, Insights and Forecast - by Product Type
- 10.1.1. Light Box
- 10.1.2. Floor and Desk Lamps
- 10.1.3. Light Visor
- 10.1.4. Dawn Simulator
- 10.1.5. Light Therapy Bulbs
- 10.1.6. Handheld Devices
- 10.2. Market Analysis, Insights and Forecast - by Light Type
- 10.2.1. White Light
- 10.2.2. Blue Light
- 10.2.3. Red Light
- 10.2.4. Others (Green and Yellow Light)
- 10.3. Market Analysis, Insights and Forecast - by Application
- 10.3.1. Vitamin D Deficiency
- 10.3.2. Mental Health Disorders
- 10.3.3. Skin Disorders
- 10.3.4. Neonatal Jaundice
- 10.4. Market Analysis, Insights and Forecast - by End User
- 10.4.1. Dermatology Clinics
- 10.4.2. Home Care Settings
- 10.4.3. Others (Workplace, Salons, etc.)
- 10.1. Market Analysis, Insights and Forecast - by Product Type
- 11. South America Phototherapy Industry Analysis, Insights and Forecast, 2020-2032
- 11.1. Market Analysis, Insights and Forecast - by Product Type
- 11.1.1. Light Box
- 11.1.2. Floor and Desk Lamps
- 11.1.3. Light Visor
- 11.1.4. Dawn Simulator
- 11.1.5. Light Therapy Bulbs
- 11.1.6. Handheld Devices
- 11.2. Market Analysis, Insights and Forecast - by Light Type
- 11.2.1. White Light
- 11.2.2. Blue Light
- 11.2.3. Red Light
- 11.2.4. Others (Green and Yellow Light)
- 11.3. Market Analysis, Insights and Forecast - by Application
- 11.3.1. Vitamin D Deficiency
- 11.3.2. Mental Health Disorders
- 11.3.3. Skin Disorders
- 11.3.4. Neonatal Jaundice
- 11.4. Market Analysis, Insights and Forecast - by End User
- 11.4.1. Dermatology Clinics
- 11.4.2. Home Care Settings
- 11.4.3. Others (Workplace, Salons, etc.)
- 11.1. Market Analysis, Insights and Forecast - by Product Type
- 12. Competitive Analysis
- 12.1. Company Profiles
- 12.1.1 Beurer
- 12.1.1.1. Company Overview
- 12.1.1.2. Products
- 12.1.1.3. Company Financials
- 12.1.1.4. SWOT Analysis
- 12.1.2 Zepter International
- 12.1.2.1. Company Overview
- 12.1.2.2. Products
- 12.1.2.3. Company Financials
- 12.1.2.4. SWOT Analysis
- 12.1.3 PhotoMedex Inc
- 12.1.3.1. Company Overview
- 12.1.3.2. Products
- 12.1.3.3. Company Financials
- 12.1.3.4. SWOT Analysis
- 12.1.4 Verilux Inc
- 12.1.4.1. Company Overview
- 12.1.4.2. Products
- 12.1.4.3. Company Financials
- 12.1.4.4. SWOT Analysis
- 12.1.5 Nature Bright
- 12.1.5.1. Company Overview
- 12.1.5.2. Products
- 12.1.5.3. Company Financials
- 12.1.5.4. SWOT Analysis
- 12.1.6 Revian Inc
- 12.1.6.1. Company Overview
- 12.1.6.2. Products
- 12.1.6.3. Company Financials
- 12.1.6.4. SWOT Analysis
- 12.1.7 Koninklijke Philips N V
- 12.1.7.1. Company Overview
- 12.1.7.2. Products
- 12.1.7.3. Company Financials
- 12.1.7.4. SWOT Analysis
- 12.1.8 Northern Light Technologies
- 12.1.8.1. Company Overview
- 12.1.8.2. Products
- 12.1.8.3. Company Financials
- 12.1.8.4. SWOT Analysis
- 12.1.9 Lumie
- 12.1.9.1. Company Overview
- 12.1.9.2. Products
- 12.1.9.3. Company Financials
- 12.1.9.4. SWOT Analysis
- 12.1.10 BioPhotas
- 12.1.10.1. Company Overview
- 12.1.10.2. Products
- 12.1.10.3. Company Financials
- 12.1.10.4. SWOT Analysis
- 12.1.11 Carex
- 12.1.11.1. Company Overview
- 12.1.11.2. Products
- 12.1.11.3. Company Financials
- 12.1.11.4. SWOT Analysis
- 12.1.12 Lucimed SA
- 12.1.12.1. Company Overview
- 12.1.12.2. Products
- 12.1.12.3. Company Financials
- 12.1.12.4. SWOT Analysis
- 12.1.1 Beurer
- 12.2. Market Entropy
- 12.2.1 Company's Key Areas Served
- 12.2.2 Recent Developments
- 12.3. Company Market Share Analysis 2025
- 12.3.1 Top 5 Companies Market Share Analysis
- 12.3.2 Top 3 Companies Market Share Analysis
- 12.4. List of Potential Customers
- 13. Research Methodology
List of Figures
- Figure 1: Global Phototherapy Industry Revenue Breakdown (million, %) by Region 2025 & 2033
- Figure 2: North America Phototherapy Industry Revenue (million), by Product Type 2025 & 2033
- Figure 3: North America Phototherapy Industry Revenue Share (%), by Product Type 2025 & 2033
- Figure 4: North America Phototherapy Industry Revenue (million), by Light Type 2025 & 2033
- Figure 5: North America Phototherapy Industry Revenue Share (%), by Light Type 2025 & 2033
- Figure 6: North America Phototherapy Industry Revenue (million), by Application 2025 & 2033
- Figure 7: North America Phototherapy Industry Revenue Share (%), by Application 2025 & 2033
- Figure 8: North America Phototherapy Industry Revenue (million), by End User 2025 & 2033
- Figure 9: North America Phototherapy Industry Revenue Share (%), by End User 2025 & 2033
- Figure 10: North America Phototherapy Industry Revenue (million), by Country 2025 & 2033
- Figure 11: North America Phototherapy Industry Revenue Share (%), by Country 2025 & 2033
- Figure 12: Europe Phototherapy Industry Revenue (million), by Product Type 2025 & 2033
- Figure 13: Europe Phototherapy Industry Revenue Share (%), by Product Type 2025 & 2033
- Figure 14: Europe Phototherapy Industry Revenue (million), by Light Type 2025 & 2033
- Figure 15: Europe Phototherapy Industry Revenue Share (%), by Light Type 2025 & 2033
- Figure 16: Europe Phototherapy Industry Revenue (million), by Application 2025 & 2033
- Figure 17: Europe Phototherapy Industry Revenue Share (%), by Application 2025 & 2033
- Figure 18: Europe Phototherapy Industry Revenue (million), by End User 2025 & 2033
- Figure 19: Europe Phototherapy Industry Revenue Share (%), by End User 2025 & 2033
- Figure 20: Europe Phototherapy Industry Revenue (million), by Country 2025 & 2033
- Figure 21: Europe Phototherapy Industry Revenue Share (%), by Country 2025 & 2033
- Figure 22: Asia Pacific Phototherapy Industry Revenue (million), by Product Type 2025 & 2033
- Figure 23: Asia Pacific Phototherapy Industry Revenue Share (%), by Product Type 2025 & 2033
- Figure 24: Asia Pacific Phototherapy Industry Revenue (million), by Light Type 2025 & 2033
- Figure 25: Asia Pacific Phototherapy Industry Revenue Share (%), by Light Type 2025 & 2033
- Figure 26: Asia Pacific Phototherapy Industry Revenue (million), by Application 2025 & 2033
- Figure 27: Asia Pacific Phototherapy Industry Revenue Share (%), by Application 2025 & 2033
- Figure 28: Asia Pacific Phototherapy Industry Revenue (million), by End User 2025 & 2033
- Figure 29: Asia Pacific Phototherapy Industry Revenue Share (%), by End User 2025 & 2033
- Figure 30: Asia Pacific Phototherapy Industry Revenue (million), by Country 2025 & 2033
- Figure 31: Asia Pacific Phototherapy Industry Revenue Share (%), by Country 2025 & 2033
- Figure 32: Middle East and Africa Phototherapy Industry Revenue (million), by Product Type 2025 & 2033
- Figure 33: Middle East and Africa Phototherapy Industry Revenue Share (%), by Product Type 2025 & 2033
- Figure 34: Middle East and Africa Phototherapy Industry Revenue (million), by Light Type 2025 & 2033
- Figure 35: Middle East and Africa Phototherapy Industry Revenue Share (%), by Light Type 2025 & 2033
- Figure 36: Middle East and Africa Phototherapy Industry Revenue (million), by Application 2025 & 2033
- Figure 37: Middle East and Africa Phototherapy Industry Revenue Share (%), by Application 2025 & 2033
- Figure 38: Middle East and Africa Phototherapy Industry Revenue (million), by End User 2025 & 2033
- Figure 39: Middle East and Africa Phototherapy Industry Revenue Share (%), by End User 2025 & 2033
- Figure 40: Middle East and Africa Phototherapy Industry Revenue (million), by Country 2025 & 2033
- Figure 41: Middle East and Africa Phototherapy Industry Revenue Share (%), by Country 2025 & 2033
- Figure 42: South America Phototherapy Industry Revenue (million), by Product Type 2025 & 2033
- Figure 43: South America Phototherapy Industry Revenue Share (%), by Product Type 2025 & 2033
- Figure 44: South America Phototherapy Industry Revenue (million), by Light Type 2025 & 2033
- Figure 45: South America Phototherapy Industry Revenue Share (%), by Light Type 2025 & 2033
- Figure 46: South America Phototherapy Industry Revenue (million), by Application 2025 & 2033
- Figure 47: South America Phototherapy Industry Revenue Share (%), by Application 2025 & 2033
- Figure 48: South America Phototherapy Industry Revenue (million), by End User 2025 & 2033
- Figure 49: South America Phototherapy Industry Revenue Share (%), by End User 2025 & 2033
- Figure 50: South America Phototherapy Industry Revenue (million), by Country 2025 & 2033
- Figure 51: South America Phototherapy Industry Revenue Share (%), by Country 2025 & 2033
List of Tables
- Table 1: Global Phototherapy Industry Revenue million Forecast, by Product Type 2020 & 2033
- Table 2: Global Phototherapy Industry Revenue million Forecast, by Light Type 2020 & 2033
- Table 3: Global Phototherapy Industry Revenue million Forecast, by Application 2020 & 2033
- Table 4: Global Phototherapy Industry Revenue million Forecast, by End User 2020 & 2033
- Table 5: Global Phototherapy Industry Revenue million Forecast, by Region 2020 & 2033
- Table 6: Global Phototherapy Industry Revenue million Forecast, by Product Type 2020 & 2033
- Table 7: Global Phototherapy Industry Revenue million Forecast, by Light Type 2020 & 2033
- Table 8: Global Phototherapy Industry Revenue million Forecast, by Application 2020 & 2033
- Table 9: Global Phototherapy Industry Revenue million Forecast, by End User 2020 & 2033
- Table 10: Global Phototherapy Industry Revenue million Forecast, by Country 2020 & 2033
- Table 11: United States Phototherapy Industry Revenue (million) Forecast, by Application 2020 & 2033
- Table 12: Canada Phototherapy Industry Revenue (million) Forecast, by Application 2020 & 2033
- Table 13: Mexico Phototherapy Industry Revenue (million) Forecast, by Application 2020 & 2033
- Table 14: Global Phototherapy Industry Revenue million Forecast, by Product Type 2020 & 2033
- Table 15: Global Phototherapy Industry Revenue million Forecast, by Light Type 2020 & 2033
- Table 16: Global Phototherapy Industry Revenue million Forecast, by Application 2020 & 2033
- Table 17: Global Phototherapy Industry Revenue million Forecast, by End User 2020 & 2033
- Table 18: Global Phototherapy Industry Revenue million Forecast, by Country 2020 & 2033
- Table 19: Germany Phototherapy Industry Revenue (million) Forecast, by Application 2020 & 2033
- Table 20: United Kingdom Phototherapy Industry Revenue (million) Forecast, by Application 2020 & 2033
- Table 21: France Phototherapy Industry Revenue (million) Forecast, by Application 2020 & 2033
- Table 22: Italy Phototherapy Industry Revenue (million) Forecast, by Application 2020 & 2033
- Table 23: Spain Phototherapy Industry Revenue (million) Forecast, by Application 2020 & 2033
- Table 24: Rest of Europe Phototherapy Industry Revenue (million) Forecast, by Application 2020 & 2033
- Table 25: Global Phototherapy Industry Revenue million Forecast, by Product Type 2020 & 2033
- Table 26: Global Phototherapy Industry Revenue million Forecast, by Light Type 2020 & 2033
- Table 27: Global Phototherapy Industry Revenue million Forecast, by Application 2020 & 2033
- Table 28: Global Phototherapy Industry Revenue million Forecast, by End User 2020 & 2033
- Table 29: Global Phototherapy Industry Revenue million Forecast, by Country 2020 & 2033
- Table 30: China Phototherapy Industry Revenue (million) Forecast, by Application 2020 & 2033
- Table 31: Japan Phototherapy Industry Revenue (million) Forecast, by Application 2020 & 2033
- Table 32: India Phototherapy Industry Revenue (million) Forecast, by Application 2020 & 2033
- Table 33: Australia Phototherapy Industry Revenue (million) Forecast, by Application 2020 & 2033
- Table 34: South Korea Phototherapy Industry Revenue (million) Forecast, by Application 2020 & 2033
- Table 35: Rest of Asia Pacific Phototherapy Industry Revenue (million) Forecast, by Application 2020 & 2033
- Table 36: Global Phototherapy Industry Revenue million Forecast, by Product Type 2020 & 2033
- Table 37: Global Phototherapy Industry Revenue million Forecast, by Light Type 2020 & 2033
- Table 38: Global Phototherapy Industry Revenue million Forecast, by Application 2020 & 2033
- Table 39: Global Phototherapy Industry Revenue million Forecast, by End User 2020 & 2033
- Table 40: Global Phototherapy Industry Revenue million Forecast, by Country 2020 & 2033
- Table 41: GCC Phototherapy Industry Revenue (million) Forecast, by Application 2020 & 2033
- Table 42: South Africa Phototherapy Industry Revenue (million) Forecast, by Application 2020 & 2033
- Table 43: Rest of Middle East and Africa Phototherapy Industry Revenue (million) Forecast, by Application 2020 & 2033
- Table 44: Global Phototherapy Industry Revenue million Forecast, by Product Type 2020 & 2033
- Table 45: Global Phototherapy Industry Revenue million Forecast, by Light Type 2020 & 2033
- Table 46: Global Phototherapy Industry Revenue million Forecast, by Application 2020 & 2033
- Table 47: Global Phototherapy Industry Revenue million Forecast, by End User 2020 & 2033
- Table 48: Global Phototherapy Industry Revenue million Forecast, by Country 2020 & 2033
- Table 49: Brazil Phototherapy Industry Revenue (million) Forecast, by Application 2020 & 2033
- Table 50: Argentina Phototherapy Industry Revenue (million) Forecast, by Application 2020 & 2033
- Table 51: Rest of South America Phototherapy Industry Revenue (million) Forecast, by Application 2020 & 2033
Frequently Asked Questions
1. What is the projected Compound Annual Growth Rate (CAGR) of the Phototherapy Industry?
The projected CAGR is approximately 4.1%.
2. Which companies are prominent players in the Phototherapy Industry?
Key companies in the market include Beurer, Zepter International, PhotoMedex Inc, Verilux Inc, Nature Bright, Revian Inc, Koninklijke Philips N V, Northern Light Technologies, Lumie, BioPhotas, Carex, Lucimed SA.
3. What are the main segments of the Phototherapy Industry?
The market segments include Product Type, Light Type, Application, End User.
4. Can you provide details about the market size?
The market size is estimated to be USD 649.37 million as of 2022.
5. What are some drivers contributing to market growth?
Growing Burden of Skin and Mental Health Disorders; Increasing Research and Development Activities.
6. What are the notable trends driving market growth?
Red Light Segment is Expected to Account for the Largest Market Share During the Forecast Period.
7. Are there any restraints impacting market growth?
Increasing Side Effects Due to Light Therapy and Product Recalls.
8. Can you provide examples of recent developments in the market?
In February 2022, STRATA Skin Sciences, Inc. announced the commercial launch of its next-generation excimer laser system, XTRAC Momentum 1.0. The XTRAC excimer laser technology allows for the precise delivery of targeted UVB light therapy to specific treatment areas of the skin for both adult and pediatric patients suffering from inflammatory skin conditions such as psoriasis, atopic dermatitis, and vitiligo.
9. What pricing options are available for accessing the report?
Pricing options include single-user, multi-user, and enterprise licenses priced at USD 4750, USD 5250, and USD 8750 respectively.
10. Is the market size provided in terms of value or volume?
The market size is provided in terms of value, measured in million.
11. Are there any specific market keywords associated with the report?
Yes, the market keyword associated with the report is "Phototherapy Industry," which aids in identifying and referencing the specific market segment covered.
12. How do I determine which pricing option suits my needs best?
The pricing options vary based on user requirements and access needs. Individual users may opt for single-user licenses, while businesses requiring broader access may choose multi-user or enterprise licenses for cost-effective access to the report.
13. Are there any additional resources or data provided in the Phototherapy Industry report?
While the report offers comprehensive insights, it's advisable to review the specific contents or supplementary materials provided to ascertain if additional resources or data are available.
14. How can I stay updated on further developments or reports in the Phototherapy Industry?
To stay informed about further developments, trends, and reports in the Phototherapy Industry, consider subscribing to industry newsletters, following relevant companies and organizations, or regularly checking reputable industry news sources and publications.
Methodology
Step 1 - Identification of Relevant Samples Size from Population Database


Step 2 - Approaches for Defining Global Market Size (Value, Volume* & Price*)

Note*: In applicable scenarios
Step 3 - Data Sources
Primary Research
- Web Analytics
- Survey Reports
- Research Institute
- Latest Research Reports
- Opinion Leaders
Secondary Research
- Annual Reports
- White Paper
- Latest Press Release
- Industry Association
- Paid Database
- Investor Presentations

Step 4 - Data Triangulation
Involves using different sources of information in order to increase the validity of a study
These sources are likely to be stakeholders in a program - participants, other researchers, program staff, other community members, and so on.
Then we put all data in single framework & apply various statistical tools to find out the dynamic on the market.
During the analysis stage, feedback from the stakeholder groups would be compared to determine areas of agreement as well as areas of divergence