

Key Insights
The Asia-Pacific (APAC) Air Separation Unit (ASU) market is experiencing significant expansion, fueled by rapid industrialization in key economies like China, India, and Southeast Asia. The burgeoning steel, chemical, and oil & gas sectors are primary drivers of demand for oxygen, nitrogen, and argon. The market is projected to achieve a Compound Annual Growth Rate (CAGR) of 4.3%. This sustained growth through 2033 is attributed to the increasing need for high-purity industrial gases in applications such as metal fabrication, chemical synthesis, and food processing. Government initiatives promoting industrial development and infrastructure projects across the APAC region further accelerate ASU adoption. While non-cryogenic distillation methods currently hold a smaller market share, ongoing technological advancements and cost efficiencies suggest future growth potential. Cryogenic distillation is expected to maintain its dominance due to proven efficiency and reliability in producing high-purity gases. Competitive pressures among leading global players and the rise of local manufacturers will shape market dynamics. Key challenges include high initial investment costs and rising energy prices. Despite these, the long-term growth prospects for the APAC ASU market remain robust, driven by the region's economic development and industrial expansion.
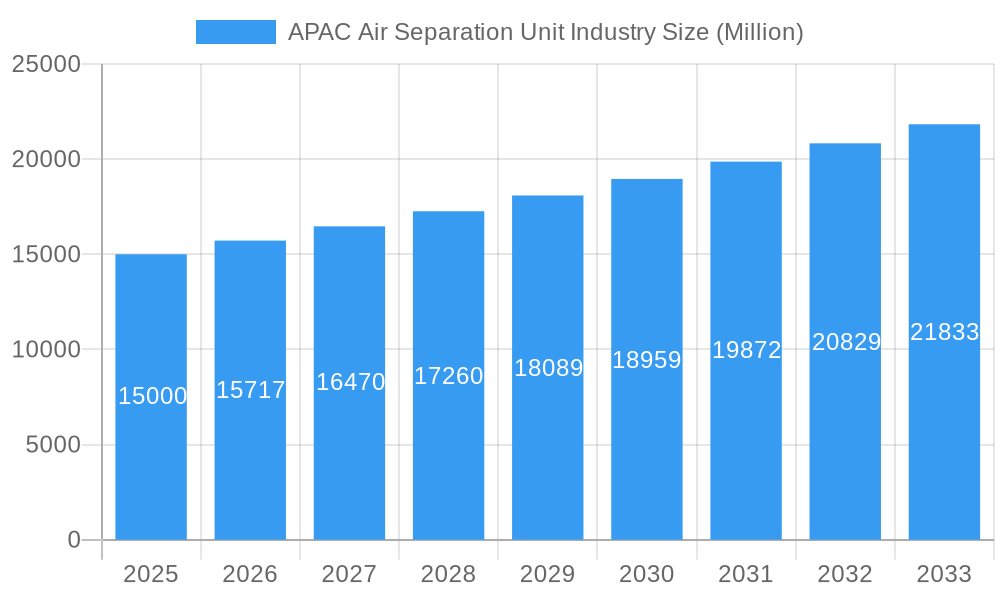
APAC Air Separation Unit Industry Market Size (In Billion)
The APAC ASU market is projected to reach $6.4 billion by 2025. This forecast considers the global market size and the APAC region's significant growth trajectory. Growth is expected to be more pronounced in developing economies like India and Southeast Asia, compared to more mature markets. Cryogenic distillation will continue to be the leading technology, though non-cryogenic solutions will gain traction in niche applications. End-user demand will closely mirror overall industrial development, with the steel and chemical sectors being key influencers. Continued investment in infrastructure and industrial modernization will be crucial. Environmental considerations are also driving demand for efficient and sustainable ASU technologies.
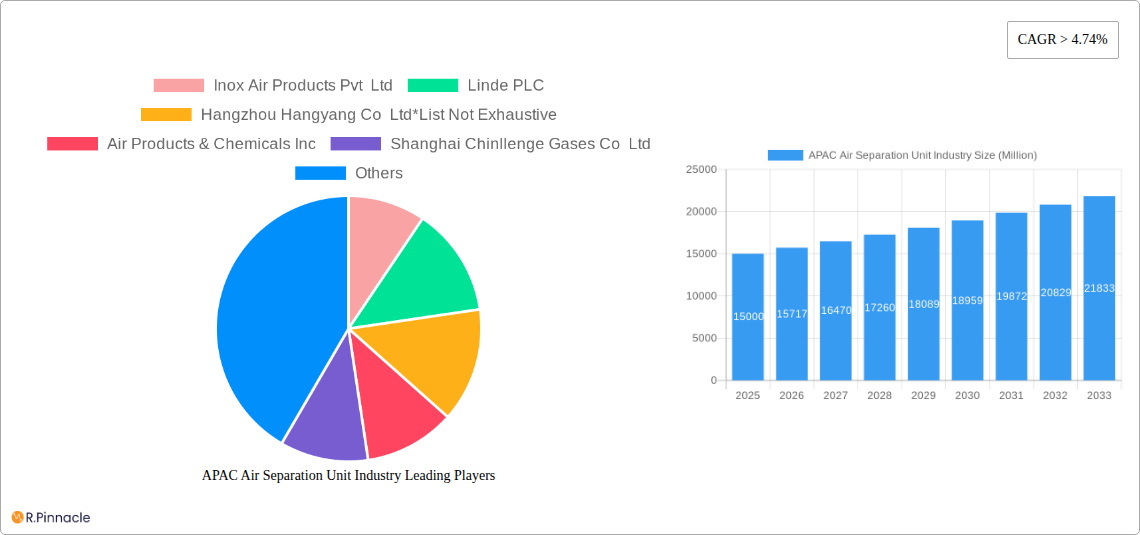
APAC Air Separation Unit Industry Company Market Share
APAC Air Separation Unit Industry Report: 2019-2033
This comprehensive report provides an in-depth analysis of the Asia-Pacific (APAC) Air Separation Unit (ASU) industry, offering crucial insights for industry professionals, investors, and strategic planners. Covering the period from 2019 to 2033, with a base year of 2025 and a forecast period of 2025-2033, this report delivers a detailed understanding of market dynamics, growth drivers, challenges, and future opportunities.
APAC Air Separation Unit Industry Market Structure & Innovation Trends
This section analyzes the competitive landscape of the APAC ASU market, encompassing market concentration, innovation drivers, regulatory frameworks, and M&A activities. The industry exhibits a moderately consolidated structure, with key players like Linde PLC, Air Products & Chemicals Inc, and Air Liquide SA holding significant market share, estimated at approximately xx% collectively in 2025. Smaller regional players, such as Hangzhou Hangyang Co Ltd and Sichuan Air Separation Group, also contribute significantly, particularly within their respective national markets. Market share fluctuations are influenced by factors including technological advancements, strategic partnerships, and regulatory changes. Innovation in ASU technology is driven by the need for increased efficiency, reduced energy consumption, and enhanced product purity. Stringent environmental regulations, particularly regarding greenhouse gas emissions, are further driving innovation towards more sustainable ASU technologies. M&A activity in the APAC ASU industry is moderate, with deal values fluctuating between xx Million and xx Million annually, reflecting strategic consolidation efforts within the sector. The primary drivers for M&A activities include expanding market reach, accessing new technologies, and enhancing economies of scale.
- Market Concentration: Moderately consolidated, with key players holding significant market share.
- Innovation Drivers: Efficiency gains, reduced energy consumption, sustainable technologies, regulatory pressures.
- M&A Activity: Moderate activity, with deal values varying between xx Million and xx Million annually.
- Regulatory Landscape: Stringent environmental regulations driving innovation towards sustainable technologies.
APAC Air Separation Unit Industry Market Dynamics & Trends
The APAC ASU market is experiencing robust growth, driven by increasing industrialization, rising demand across various end-user sectors, and technological advancements. The market exhibits a Compound Annual Growth Rate (CAGR) of xx% during the forecast period (2025-2033). Key growth drivers include the expansion of the steel, chemical, and oil & gas industries, rising demand for high-purity gases in the healthcare and food & beverage sectors, and government initiatives promoting industrial development in various APAC economies. Technological disruptions, such as the adoption of more efficient cryogenic distillation technologies and advancements in membrane separation, are also contributing to market growth. Consumer preferences are shifting towards higher-quality, more sustainably produced gases, which further fuels innovation in the sector. Competitive dynamics are characterized by price competition, product differentiation, and strategic alliances. Market penetration of advanced ASU technologies is steadily increasing, driven by the economic benefits and environmental advantages they offer.
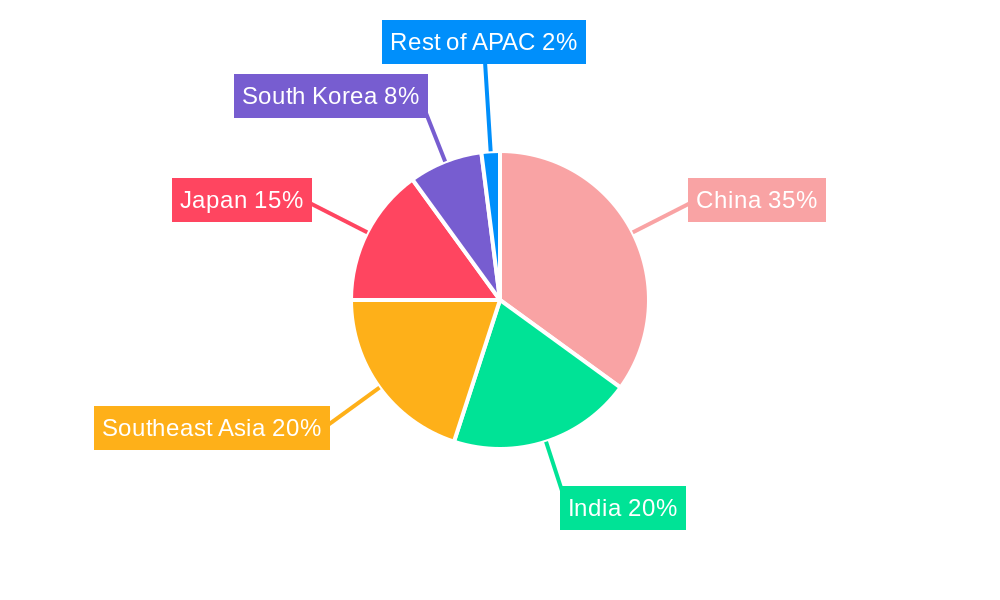
Dominant Regions & Segments in APAC Air Separation Unit Industry
China and India are the dominant regions in the APAC ASU market, accounting for xx% and xx% of the total market value in 2025 respectively, driven by robust industrial growth and substantial investments in infrastructure development. Within the segmentation:
- Process: Cryogenic distillation dominates the market, holding an estimated xx% market share in 2025, due to its high efficiency and ability to produce high-purity gases. Non-cryogenic distillation holds a smaller share but is experiencing growth due to its lower capital investment requirements.
- Gas: Nitrogen and Oxygen represent the largest segments, driven by their extensive applications across various industries. Argon is a significant but smaller segment, with applications primarily in the steel and welding industries. "Other Gases," including helium and neon, constitute a smaller but growing segment.
- End User: The steel and chemical industries are the largest consumers of ASU products, driven by high demand in these manufacturing sectors. The oil and gas industry, food and beverage industry, and healthcare industry represent significant but smaller segments.
Key Drivers:
- China & India: Robust industrial growth, substantial infrastructure investments, and government support.
- Cryogenic Distillation: High efficiency and high-purity gas production capabilities.
- Steel & Chemical Industries: High demand for nitrogen and oxygen in manufacturing processes.
APAC Air Separation Unit Industry Product Innovations
Recent innovations in ASU technology focus on enhancing energy efficiency, reducing operational costs, and minimizing environmental impact. Advancements in cryogenic distillation processes, membrane separation technologies, and pressure swing adsorption (PSA) systems are enhancing the purity and yield of separated gases. These innovations are leading to smaller, more modular ASU units, suitable for diverse applications and locations. The development of integrated ASU systems, which combine ASU with downstream processing capabilities, is also gaining traction, offering increased efficiency and reduced costs for end-users.
Report Scope & Segmentation Analysis
This report comprehensively segments the APAC ASU market by process (cryogenic and non-cryogenic distillation), gas type (nitrogen, oxygen, argon, and other gases), and end-user industry (oil & gas, steel, chemicals, food & beverage, healthcare, and others). Each segment's market size, growth projections, and competitive dynamics are analyzed. The market shows substantial growth across all segments, with Cryogenic distillation and Nitrogen gas expected to maintain leading positions during the forecast period due to their wide-ranging industrial applications and high purity requirements. The end-user segments demonstrate varied growth trajectories, influenced by economic growth, industrial investment, and regulatory developments in each sector.
Key Drivers of APAC Air Separation Unit Industry Growth
The APAC ASU industry's growth is driven by several factors: Firstly, the rapid industrialization across APAC nations, particularly in China and India, creates significant demand for industrial gases. Secondly, the increasing focus on sustainable practices and stringent environmental regulations are pushing industries towards more efficient and environmentally friendly ASU technologies. Finally, advancements in ASU technology, such as the development of more energy-efficient and modular units, are fueling market expansion. These factors collectively contribute to a positive outlook for the APAC ASU market.
Challenges in the APAC Air Separation Unit Industry Sector
The APAC ASU industry faces several challenges: fluctuating raw material prices (primarily energy costs), intense competition from established players and new entrants, and the need for substantial capital investments in new ASU facilities. Furthermore, navigating complex regulatory frameworks and ensuring a reliable supply chain in a geographically diverse region can present operational hurdles. These challenges require innovative solutions and strategic adaptations to mitigate their impact on market growth.
Emerging Opportunities in APAC Air Separation Unit Industry
Significant opportunities exist within the APAC ASU industry. The burgeoning demand for high-purity gases in emerging industries like electronics and biotechnology presents new market segments. Technological advancements, such as the development of compact and energy-efficient ASU systems, are opening doors to new applications in remote areas and small-scale industrial settings. Furthermore, the increasing adoption of on-site gas generation systems offers new avenues for market penetration.
Leading Players in the APAC Air Separation Unit Industry Market
- Inox Air Products Pvt Ltd
- Linde PLC
- Hangzhou Hangyang Co Ltd
- Air Products & Chemicals Inc
- Shanghai Chinllenge Gases Co Ltd
- Praxair Technology Inc
- Iwatani Corp
- Sichuan Air Separation Group
- Air Liquide SA
- Messer Group GmbH
- Universal Industrial Plants Mfg Co Private Limited
- Taiyo Nippon Sanso Corporation
Key Developments in APAC Air Separation Unit Industry
- 2022 Q4: Linde PLC announced a major investment in a new ASU facility in Vietnam.
- 2023 Q1: Air Products & Chemicals Inc launched a new line of energy-efficient ASU technology.
- 2023 Q2: A significant merger between two smaller ASU providers in India was announced. (Specific details are unavailable, but the merger value was estimated at xx Million.)
Future Outlook for APAC Air Separation Unit Industry Market
The APAC ASU market is poised for continued growth, driven by robust industrial expansion, technological advancements, and supportive government policies. The increasing demand for high-purity gases across various industries, coupled with the development of innovative and sustainable ASU technologies, promises significant market expansion over the forecast period. Strategic investments in new ASU facilities and expansion into new market segments are key to capitalizing on the future growth potential of this sector.
APAC Air Separation Unit Industry Segmentation
-
1. Process
- 1.1. Cryogenic Distillation
- 1.2. Non-cryogenic Distillation
-
2. Gas
- 2.1. Nitrogen
- 2.2. Oxygen
- 2.3. Argon
- 2.4. Other Gases
-
3. End User
- 3.1. Oil and Gas Industry
- 3.2. Steel Industry
- 3.3. Chemical Industry
- 3.4. Food and Beverage Industry
- 3.5. Healthcare Industry
- 3.6. Other End Users
-
4. Geography
- 4.1. Japan
- 4.2. China
- 4.3. India
- 4.4. Rest of Asia-Pacific
APAC Air Separation Unit Industry Segmentation By Geography
- 1. Japan
- 2. China
- 3. India
- 4. Rest of Asia Pacific
APAC Air Separation Unit Industry Regional Market Share
Geographic Coverage of APAC Air Separation Unit Industry
APAC Air Separation Unit Industry REPORT HIGHLIGHTS
| Aspects | Details |
|---|---|
| Study Period | 2020-2034 |
| Base Year | 2025 |
| Estimated Year | 2026 |
| Forecast Period | 2026-2034 |
| Historical Period | 2020-2025 |
| Growth Rate | CAGR of 4.3% from 2020-2034 |
| Segmentation |
|
Table of Contents
- 1. Introduction
- 1.1. Research Scope
- 1.2. Market Segmentation
- 1.3. Research Objective
- 1.4. Definitions and Assumptions
- 2. Executive Summary
- 2.1. Market Snapshot
- 3. Market Dynamics
- 3.1. Market Drivers
- 3.2. Market Restrains
- 3.3. Market Trends
- 3.4. Market Opportunities
- 4. Market Factor Analysis
- 4.1. Porters Five Forces
- 4.1.1. Bargaining Power of Suppliers
- 4.1.2. Bargaining Power of Buyers
- 4.1.3. Threat of New Entrants
- 4.1.4. Threat of Substitutes
- 4.1.5. Competitive Rivalry
- 4.2. PESTEL analysis
- 4.3. BCG Analysis
- 4.3.1. Stars (High Growth, High Market Share)
- 4.3.2. Cash Cows (Low Growth, High Market Share)
- 4.3.3. Question Mark (High Growth, Low Market Share)
- 4.3.4. Dogs (Low Growth, Low Market Share)
- 4.4. Ansoff Matrix Analysis
- 4.5. Supply Chain Analysis
- 4.6. Regulatory Landscape
- 4.7. Current Market Potential and Opportunity Assessment (TAM–SAM–SOM Framework)
- 4.8. PRI Analyst Note
- 4.1. Porters Five Forces
- 5. Market Analysis, Insights and Forecast 2021-2033
- 5.1. Market Analysis, Insights and Forecast - by Process
- 5.1.1. Cryogenic Distillation
- 5.1.2. Non-cryogenic Distillation
- 5.2. Market Analysis, Insights and Forecast - by Gas
- 5.2.1. Nitrogen
- 5.2.2. Oxygen
- 5.2.3. Argon
- 5.2.4. Other Gases
- 5.3. Market Analysis, Insights and Forecast - by End User
- 5.3.1. Oil and Gas Industry
- 5.3.2. Steel Industry
- 5.3.3. Chemical Industry
- 5.3.4. Food and Beverage Industry
- 5.3.5. Healthcare Industry
- 5.3.6. Other End Users
- 5.4. Market Analysis, Insights and Forecast - by Geography
- 5.4.1. Japan
- 5.4.2. China
- 5.4.3. India
- 5.4.4. Rest of Asia-Pacific
- 5.5. Market Analysis, Insights and Forecast - by Region
- 5.5.1. Japan
- 5.5.2. China
- 5.5.3. India
- 5.5.4. Rest of Asia Pacific
- 5.1. Market Analysis, Insights and Forecast - by Process
- 6. Global APAC Air Separation Unit Industry Analysis, Insights and Forecast, 2021-2033
- 6.1. Market Analysis, Insights and Forecast - by Process
- 6.1.1. Cryogenic Distillation
- 6.1.2. Non-cryogenic Distillation
- 6.2. Market Analysis, Insights and Forecast - by Gas
- 6.2.1. Nitrogen
- 6.2.2. Oxygen
- 6.2.3. Argon
- 6.2.4. Other Gases
- 6.3. Market Analysis, Insights and Forecast - by End User
- 6.3.1. Oil and Gas Industry
- 6.3.2. Steel Industry
- 6.3.3. Chemical Industry
- 6.3.4. Food and Beverage Industry
- 6.3.5. Healthcare Industry
- 6.3.6. Other End Users
- 6.4. Market Analysis, Insights and Forecast - by Geography
- 6.4.1. Japan
- 6.4.2. China
- 6.4.3. India
- 6.4.4. Rest of Asia-Pacific
- 6.1. Market Analysis, Insights and Forecast - by Process
- 7. Japan APAC Air Separation Unit Industry Analysis, Insights and Forecast, 2020-2032
- 7.1. Market Analysis, Insights and Forecast - by Process
- 7.1.1. Cryogenic Distillation
- 7.1.2. Non-cryogenic Distillation
- 7.2. Market Analysis, Insights and Forecast - by Gas
- 7.2.1. Nitrogen
- 7.2.2. Oxygen
- 7.2.3. Argon
- 7.2.4. Other Gases
- 7.3. Market Analysis, Insights and Forecast - by End User
- 7.3.1. Oil and Gas Industry
- 7.3.2. Steel Industry
- 7.3.3. Chemical Industry
- 7.3.4. Food and Beverage Industry
- 7.3.5. Healthcare Industry
- 7.3.6. Other End Users
- 7.4. Market Analysis, Insights and Forecast - by Geography
- 7.4.1. Japan
- 7.4.2. China
- 7.4.3. India
- 7.4.4. Rest of Asia-Pacific
- 7.1. Market Analysis, Insights and Forecast - by Process
- 8. China APAC Air Separation Unit Industry Analysis, Insights and Forecast, 2020-2032
- 8.1. Market Analysis, Insights and Forecast - by Process
- 8.1.1. Cryogenic Distillation
- 8.1.2. Non-cryogenic Distillation
- 8.2. Market Analysis, Insights and Forecast - by Gas
- 8.2.1. Nitrogen
- 8.2.2. Oxygen
- 8.2.3. Argon
- 8.2.4. Other Gases
- 8.3. Market Analysis, Insights and Forecast - by End User
- 8.3.1. Oil and Gas Industry
- 8.3.2. Steel Industry
- 8.3.3. Chemical Industry
- 8.3.4. Food and Beverage Industry
- 8.3.5. Healthcare Industry
- 8.3.6. Other End Users
- 8.4. Market Analysis, Insights and Forecast - by Geography
- 8.4.1. Japan
- 8.4.2. China
- 8.4.3. India
- 8.4.4. Rest of Asia-Pacific
- 8.1. Market Analysis, Insights and Forecast - by Process
- 9. India APAC Air Separation Unit Industry Analysis, Insights and Forecast, 2020-2032
- 9.1. Market Analysis, Insights and Forecast - by Process
- 9.1.1. Cryogenic Distillation
- 9.1.2. Non-cryogenic Distillation
- 9.2. Market Analysis, Insights and Forecast - by Gas
- 9.2.1. Nitrogen
- 9.2.2. Oxygen
- 9.2.3. Argon
- 9.2.4. Other Gases
- 9.3. Market Analysis, Insights and Forecast - by End User
- 9.3.1. Oil and Gas Industry
- 9.3.2. Steel Industry
- 9.3.3. Chemical Industry
- 9.3.4. Food and Beverage Industry
- 9.3.5. Healthcare Industry
- 9.3.6. Other End Users
- 9.4. Market Analysis, Insights and Forecast - by Geography
- 9.4.1. Japan
- 9.4.2. China
- 9.4.3. India
- 9.4.4. Rest of Asia-Pacific
- 9.1. Market Analysis, Insights and Forecast - by Process
- 10. Rest of Asia Pacific APAC Air Separation Unit Industry Analysis, Insights and Forecast, 2020-2032
- 10.1. Market Analysis, Insights and Forecast - by Process
- 10.1.1. Cryogenic Distillation
- 10.1.2. Non-cryogenic Distillation
- 10.2. Market Analysis, Insights and Forecast - by Gas
- 10.2.1. Nitrogen
- 10.2.2. Oxygen
- 10.2.3. Argon
- 10.2.4. Other Gases
- 10.3. Market Analysis, Insights and Forecast - by End User
- 10.3.1. Oil and Gas Industry
- 10.3.2. Steel Industry
- 10.3.3. Chemical Industry
- 10.3.4. Food and Beverage Industry
- 10.3.5. Healthcare Industry
- 10.3.6. Other End Users
- 10.4. Market Analysis, Insights and Forecast - by Geography
- 10.4.1. Japan
- 10.4.2. China
- 10.4.3. India
- 10.4.4. Rest of Asia-Pacific
- 10.1. Market Analysis, Insights and Forecast - by Process
- 11. Competitive Analysis
- 11.1. Company Profiles
- 11.1.1 Inox Air Products Pvt Ltd
- 11.1.1.1. Company Overview
- 11.1.1.2. Products
- 11.1.1.3. Company Financials
- 11.1.1.4. SWOT Analysis
- 11.1.2 Linde PLC
- 11.1.2.1. Company Overview
- 11.1.2.2. Products
- 11.1.2.3. Company Financials
- 11.1.2.4. SWOT Analysis
- 11.1.3 Hangzhou Hangyang Co Ltd*List Not Exhaustive
- 11.1.3.1. Company Overview
- 11.1.3.2. Products
- 11.1.3.3. Company Financials
- 11.1.3.4. SWOT Analysis
- 11.1.4 Air Products & Chemicals Inc
- 11.1.4.1. Company Overview
- 11.1.4.2. Products
- 11.1.4.3. Company Financials
- 11.1.4.4. SWOT Analysis
- 11.1.5 Shanghai Chinllenge Gases Co Ltd
- 11.1.5.1. Company Overview
- 11.1.5.2. Products
- 11.1.5.3. Company Financials
- 11.1.5.4. SWOT Analysis
- 11.1.6 Praxair Technology Inc
- 11.1.6.1. Company Overview
- 11.1.6.2. Products
- 11.1.6.3. Company Financials
- 11.1.6.4. SWOT Analysis
- 11.1.7 Iwatani Corp
- 11.1.7.1. Company Overview
- 11.1.7.2. Products
- 11.1.7.3. Company Financials
- 11.1.7.4. SWOT Analysis
- 11.1.8 Sichuan Air Separation Group
- 11.1.8.1. Company Overview
- 11.1.8.2. Products
- 11.1.8.3. Company Financials
- 11.1.8.4. SWOT Analysis
- 11.1.9 Air Liquide SA
- 11.1.9.1. Company Overview
- 11.1.9.2. Products
- 11.1.9.3. Company Financials
- 11.1.9.4. SWOT Analysis
- 11.1.10 Messer Group GmbH
- 11.1.10.1. Company Overview
- 11.1.10.2. Products
- 11.1.10.3. Company Financials
- 11.1.10.4. SWOT Analysis
- 11.1.11 Universal Industrial Plants Mfg Co Private Limited
- 11.1.11.1. Company Overview
- 11.1.11.2. Products
- 11.1.11.3. Company Financials
- 11.1.11.4. SWOT Analysis
- 11.1.12 Taiyo Nippon Sanso Corporation
- 11.1.12.1. Company Overview
- 11.1.12.2. Products
- 11.1.12.3. Company Financials
- 11.1.12.4. SWOT Analysis
- 11.1.1 Inox Air Products Pvt Ltd
- 11.2. Market Entropy
- 11.2.1 Company's Key Areas Served
- 11.2.2 Recent Developments
- 11.3. Company Market Share Analysis 2025
- 11.3.1 Top 5 Companies Market Share Analysis
- 11.3.2 Top 3 Companies Market Share Analysis
- 11.4. List of Potential Customers
- 12. Research Methodology
List of Figures
- Figure 1: Global APAC Air Separation Unit Industry Revenue Breakdown (billion, %) by Region 2025 & 2033
- Figure 2: Japan APAC Air Separation Unit Industry Revenue (billion), by Process 2025 & 2033
- Figure 3: Japan APAC Air Separation Unit Industry Revenue Share (%), by Process 2025 & 2033
- Figure 4: Japan APAC Air Separation Unit Industry Revenue (billion), by Gas 2025 & 2033
- Figure 5: Japan APAC Air Separation Unit Industry Revenue Share (%), by Gas 2025 & 2033
- Figure 6: Japan APAC Air Separation Unit Industry Revenue (billion), by End User 2025 & 2033
- Figure 7: Japan APAC Air Separation Unit Industry Revenue Share (%), by End User 2025 & 2033
- Figure 8: Japan APAC Air Separation Unit Industry Revenue (billion), by Geography 2025 & 2033
- Figure 9: Japan APAC Air Separation Unit Industry Revenue Share (%), by Geography 2025 & 2033
- Figure 10: Japan APAC Air Separation Unit Industry Revenue (billion), by Country 2025 & 2033
- Figure 11: Japan APAC Air Separation Unit Industry Revenue Share (%), by Country 2025 & 2033
- Figure 12: China APAC Air Separation Unit Industry Revenue (billion), by Process 2025 & 2033
- Figure 13: China APAC Air Separation Unit Industry Revenue Share (%), by Process 2025 & 2033
- Figure 14: China APAC Air Separation Unit Industry Revenue (billion), by Gas 2025 & 2033
- Figure 15: China APAC Air Separation Unit Industry Revenue Share (%), by Gas 2025 & 2033
- Figure 16: China APAC Air Separation Unit Industry Revenue (billion), by End User 2025 & 2033
- Figure 17: China APAC Air Separation Unit Industry Revenue Share (%), by End User 2025 & 2033
- Figure 18: China APAC Air Separation Unit Industry Revenue (billion), by Geography 2025 & 2033
- Figure 19: China APAC Air Separation Unit Industry Revenue Share (%), by Geography 2025 & 2033
- Figure 20: China APAC Air Separation Unit Industry Revenue (billion), by Country 2025 & 2033
- Figure 21: China APAC Air Separation Unit Industry Revenue Share (%), by Country 2025 & 2033
- Figure 22: India APAC Air Separation Unit Industry Revenue (billion), by Process 2025 & 2033
- Figure 23: India APAC Air Separation Unit Industry Revenue Share (%), by Process 2025 & 2033
- Figure 24: India APAC Air Separation Unit Industry Revenue (billion), by Gas 2025 & 2033
- Figure 25: India APAC Air Separation Unit Industry Revenue Share (%), by Gas 2025 & 2033
- Figure 26: India APAC Air Separation Unit Industry Revenue (billion), by End User 2025 & 2033
- Figure 27: India APAC Air Separation Unit Industry Revenue Share (%), by End User 2025 & 2033
- Figure 28: India APAC Air Separation Unit Industry Revenue (billion), by Geography 2025 & 2033
- Figure 29: India APAC Air Separation Unit Industry Revenue Share (%), by Geography 2025 & 2033
- Figure 30: India APAC Air Separation Unit Industry Revenue (billion), by Country 2025 & 2033
- Figure 31: India APAC Air Separation Unit Industry Revenue Share (%), by Country 2025 & 2033
- Figure 32: Rest of Asia Pacific APAC Air Separation Unit Industry Revenue (billion), by Process 2025 & 2033
- Figure 33: Rest of Asia Pacific APAC Air Separation Unit Industry Revenue Share (%), by Process 2025 & 2033
- Figure 34: Rest of Asia Pacific APAC Air Separation Unit Industry Revenue (billion), by Gas 2025 & 2033
- Figure 35: Rest of Asia Pacific APAC Air Separation Unit Industry Revenue Share (%), by Gas 2025 & 2033
- Figure 36: Rest of Asia Pacific APAC Air Separation Unit Industry Revenue (billion), by End User 2025 & 2033
- Figure 37: Rest of Asia Pacific APAC Air Separation Unit Industry Revenue Share (%), by End User 2025 & 2033
- Figure 38: Rest of Asia Pacific APAC Air Separation Unit Industry Revenue (billion), by Geography 2025 & 2033
- Figure 39: Rest of Asia Pacific APAC Air Separation Unit Industry Revenue Share (%), by Geography 2025 & 2033
- Figure 40: Rest of Asia Pacific APAC Air Separation Unit Industry Revenue (billion), by Country 2025 & 2033
- Figure 41: Rest of Asia Pacific APAC Air Separation Unit Industry Revenue Share (%), by Country 2025 & 2033
List of Tables
- Table 1: Global APAC Air Separation Unit Industry Revenue billion Forecast, by Process 2020 & 2033
- Table 2: Global APAC Air Separation Unit Industry Revenue billion Forecast, by Gas 2020 & 2033
- Table 3: Global APAC Air Separation Unit Industry Revenue billion Forecast, by End User 2020 & 2033
- Table 4: Global APAC Air Separation Unit Industry Revenue billion Forecast, by Geography 2020 & 2033
- Table 5: Global APAC Air Separation Unit Industry Revenue billion Forecast, by Region 2020 & 2033
- Table 6: Global APAC Air Separation Unit Industry Revenue billion Forecast, by Process 2020 & 2033
- Table 7: Global APAC Air Separation Unit Industry Revenue billion Forecast, by Gas 2020 & 2033
- Table 8: Global APAC Air Separation Unit Industry Revenue billion Forecast, by End User 2020 & 2033
- Table 9: Global APAC Air Separation Unit Industry Revenue billion Forecast, by Geography 2020 & 2033
- Table 10: Global APAC Air Separation Unit Industry Revenue billion Forecast, by Country 2020 & 2033
- Table 11: Global APAC Air Separation Unit Industry Revenue billion Forecast, by Process 2020 & 2033
- Table 12: Global APAC Air Separation Unit Industry Revenue billion Forecast, by Gas 2020 & 2033
- Table 13: Global APAC Air Separation Unit Industry Revenue billion Forecast, by End User 2020 & 2033
- Table 14: Global APAC Air Separation Unit Industry Revenue billion Forecast, by Geography 2020 & 2033
- Table 15: Global APAC Air Separation Unit Industry Revenue billion Forecast, by Country 2020 & 2033
- Table 16: Global APAC Air Separation Unit Industry Revenue billion Forecast, by Process 2020 & 2033
- Table 17: Global APAC Air Separation Unit Industry Revenue billion Forecast, by Gas 2020 & 2033
- Table 18: Global APAC Air Separation Unit Industry Revenue billion Forecast, by End User 2020 & 2033
- Table 19: Global APAC Air Separation Unit Industry Revenue billion Forecast, by Geography 2020 & 2033
- Table 20: Global APAC Air Separation Unit Industry Revenue billion Forecast, by Country 2020 & 2033
- Table 21: Global APAC Air Separation Unit Industry Revenue billion Forecast, by Process 2020 & 2033
- Table 22: Global APAC Air Separation Unit Industry Revenue billion Forecast, by Gas 2020 & 2033
- Table 23: Global APAC Air Separation Unit Industry Revenue billion Forecast, by End User 2020 & 2033
- Table 24: Global APAC Air Separation Unit Industry Revenue billion Forecast, by Geography 2020 & 2033
- Table 25: Global APAC Air Separation Unit Industry Revenue billion Forecast, by Country 2020 & 2033
Frequently Asked Questions
1. What is the projected Compound Annual Growth Rate (CAGR) of the APAC Air Separation Unit Industry?
The projected CAGR is approximately 4.3%.
2. Which companies are prominent players in the APAC Air Separation Unit Industry?
Key companies in the market include Inox Air Products Pvt Ltd, Linde PLC, Hangzhou Hangyang Co Ltd*List Not Exhaustive, Air Products & Chemicals Inc, Shanghai Chinllenge Gases Co Ltd, Praxair Technology Inc, Iwatani Corp, Sichuan Air Separation Group, Air Liquide SA, Messer Group GmbH, Universal Industrial Plants Mfg Co Private Limited, Taiyo Nippon Sanso Corporation.
3. What are the main segments of the APAC Air Separation Unit Industry?
The market segments include Process, Gas, End User, Geography.
4. Can you provide details about the market size?
The market size is estimated to be USD 6.4 billion as of 2022.
5. What are some drivers contributing to market growth?
4.; Increasing Focus on the Decarbonization of Global Energy4.; Expansion of Automobile Industry.
6. What are the notable trends driving market growth?
Chemical Industry to Witness Significant Growth.
7. Are there any restraints impacting market growth?
4.; High Costs Associated with Transportation of Liquid Hydrogen.
8. Can you provide examples of recent developments in the market?
N/A
9. What pricing options are available for accessing the report?
Pricing options include single-user, multi-user, and enterprise licenses priced at USD 4750, USD 5250, and USD 8750 respectively.
10. Is the market size provided in terms of value or volume?
The market size is provided in terms of value, measured in billion.
11. Are there any specific market keywords associated with the report?
Yes, the market keyword associated with the report is "APAC Air Separation Unit Industry," which aids in identifying and referencing the specific market segment covered.
12. How do I determine which pricing option suits my needs best?
The pricing options vary based on user requirements and access needs. Individual users may opt for single-user licenses, while businesses requiring broader access may choose multi-user or enterprise licenses for cost-effective access to the report.
13. Are there any additional resources or data provided in the APAC Air Separation Unit Industry report?
While the report offers comprehensive insights, it's advisable to review the specific contents or supplementary materials provided to ascertain if additional resources or data are available.
14. How can I stay updated on further developments or reports in the APAC Air Separation Unit Industry?
To stay informed about further developments, trends, and reports in the APAC Air Separation Unit Industry, consider subscribing to industry newsletters, following relevant companies and organizations, or regularly checking reputable industry news sources and publications.
Methodology
Step 1 - Identification of Relevant Samples Size from Population Database


Step 2 - Approaches for Defining Global Market Size (Value, Volume* & Price*)

Note*: In applicable scenarios
Step 3 - Data Sources
Primary Research
- Web Analytics
- Survey Reports
- Research Institute
- Latest Research Reports
- Opinion Leaders
Secondary Research
- Annual Reports
- White Paper
- Latest Press Release
- Industry Association
- Paid Database
- Investor Presentations

Step 4 - Data Triangulation
Involves using different sources of information in order to increase the validity of a study
These sources are likely to be stakeholders in a program - participants, other researchers, program staff, other community members, and so on.
Then we put all data in single framework & apply various statistical tools to find out the dynamic on the market.
During the analysis stage, feedback from the stakeholder groups would be compared to determine areas of agreement as well as areas of divergence