

Key Insights
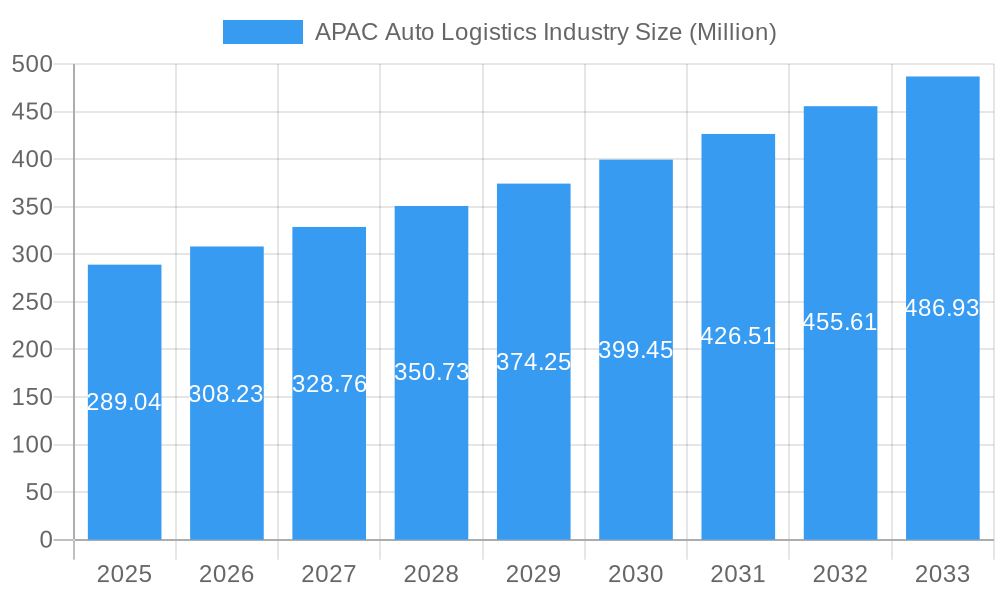
The Asia-Pacific (APAC) auto logistics industry is experiencing robust growth, projected to reach a market size of $289.04 million in 2025 and maintain a Compound Annual Growth Rate (CAGR) exceeding 6.50% from 2025 to 2033. This expansion is fueled by several key factors. Firstly, the burgeoning automotive manufacturing and sales within the region, particularly in China, India, and other Southeast Asian nations, drive significant demand for efficient transportation, warehousing, and distribution services. Secondly, the increasing complexity of automotive supply chains, with more components sourced globally, necessitates sophisticated logistics solutions for timely delivery and inventory management. The rise of e-commerce in automotive parts and accessories further contributes to this demand. Finally, investments in advanced logistics technologies, such as automated warehousing systems and real-time tracking, are enhancing efficiency and reducing operational costs, boosting market growth.
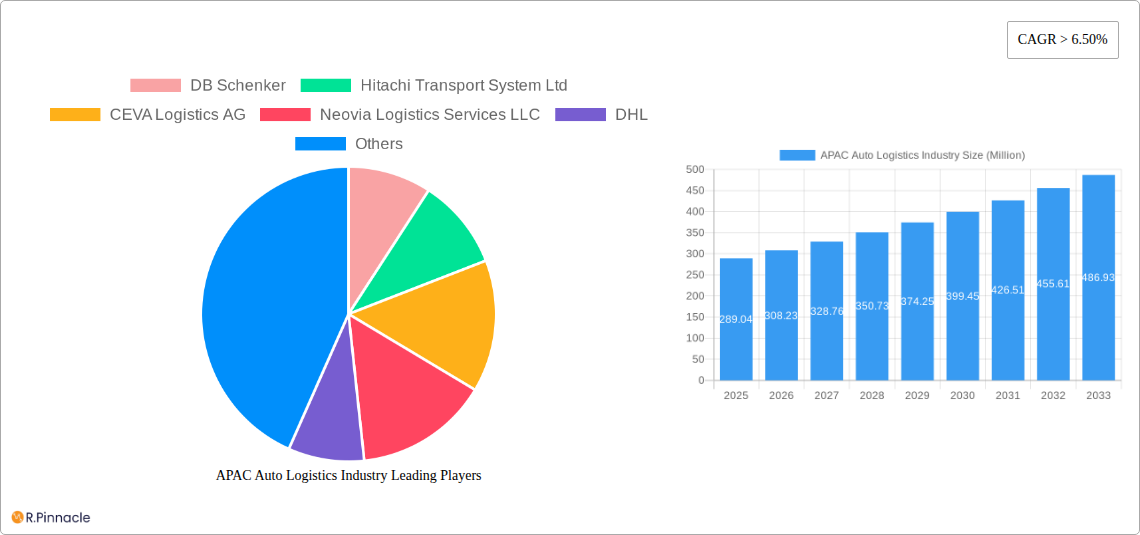
APAC Auto Logistics Industry Market Size (In Million)
However, challenges remain. Infrastructure limitations in certain APAC countries can hinder efficient transportation, and fluctuations in fuel prices pose a significant cost factor for logistics providers. Furthermore, increasing regulatory compliance requirements and the need to adapt to evolving consumer preferences necessitate continuous investment and strategic adjustments. Despite these headwinds, the long-term outlook for the APAC auto logistics industry remains positive, driven by continued automotive industry growth and the increasing adoption of advanced logistics solutions. Key players like DB Schenker, Hitachi Transport System, and DHL are well-positioned to capitalize on these opportunities through strategic partnerships, technological innovation, and expansion into emerging markets within the region. The segmentation by service type (transportation, warehousing, etc.), vehicle type (finished vehicles, components), and country-specific data highlights lucrative niche markets within the larger APAC landscape. Growth will be particularly pronounced in countries experiencing rapid automotive sector development and those investing heavily in infrastructure improvements.
APAC Auto Logistics Industry Company Market Share
This comprehensive report provides an in-depth analysis of the Asia-Pacific (APAC) auto logistics industry, offering invaluable insights for industry professionals, investors, and strategic decision-makers. With a study period spanning 2019-2033, a base year of 2025, and a forecast period of 2025-2033, this report unveils the market's current state and future trajectory. The analysis incorporates key segments (By Service, By Type, By Country) and profiles leading players, including DB Schenker, Hitachi Transport System Ltd, CEVA Logistics AG, Neovia Logistics Services LLC, DHL, Yusen Logistics Co Ltd, GEODIS, Nippon Express Co Ltd, United Parcel Service Inc, XPO Logistics Inc, KUEHNE + NAGEL International AG, DSV, and Ryder System Inc. The report's detailed segmentation and analysis are crucial for understanding the complexities and opportunities within this dynamic market.
APAC Auto Logistics Industry Market Structure & Innovation Trends
This section analyzes the APAC auto logistics market's structure, highlighting market concentration, innovation drivers, regulatory landscapes, product substitutes, end-user demographics, and mergers & acquisitions (M&A) activities. The market is characterized by a mix of global giants and regional players, resulting in a moderately concentrated landscape. The top 10 players likely hold a combined market share of approximately xx%, with the remaining share distributed amongst numerous smaller companies. Innovation is driven by advancements in technology, particularly in areas such as automation, data analytics, and sustainable logistics solutions. Stringent environmental regulations across several APAC countries are prompting the adoption of greener technologies and practices. The growing demand for just-in-time delivery and increased supply chain transparency further fuels innovation.
- Market Concentration: Moderately concentrated, with top 10 players holding approximately xx% market share (2024 estimate).
- Innovation Drivers: Automation, data analytics, sustainable logistics, and just-in-time delivery.
- Regulatory Frameworks: Stringent environmental regulations driving the adoption of green technologies.
- M&A Activity: Significant M&A activity observed in recent years, with deal values totaling approximately $xx Million (2019-2024). These activities are primarily driven by expansion strategies and the consolidation of market share.
APAC Auto Logistics Industry Market Dynamics & Trends
The APAC auto logistics market is experiencing robust growth, driven by factors such as the region's burgeoning automotive industry, rising disposable incomes, expanding middle class, and increasing demand for vehicles. Technological disruptions, such as the adoption of autonomous vehicles and the rise of e-commerce, are reshaping the industry landscape. Consumer preferences are shifting towards personalized services and enhanced transparency, pushing companies to adapt their offerings. The competitive landscape is dynamic, with both established players and new entrants vying for market share. The market is projected to register a CAGR of xx% during the forecast period (2025-2033), with market penetration expected to reach xx% by 2033.
Dominant Regions & Segments in APAC Auto Logistics Industry
China, India, and Japan are the dominant regions in the APAC auto logistics market, accounting for the largest share of overall revenue. This dominance is attributed to factors including robust automotive production, well-established infrastructure, and supportive government policies.
By Country:
- China: Strong automotive manufacturing base, large consumer market, and extensive logistics infrastructure.
- India: Rapidly growing automotive sector, supportive government initiatives, and increasing demand for vehicles.
- Japan: Established automotive industry, advanced technological capabilities, and efficient logistics networks.
By Service: Transportation currently holds the largest market share, driven by high vehicle production and distribution volumes. However, Warehousing, Distribution, and Inventory Management are expected to witness significant growth due to the increasing focus on supply chain optimization and efficient inventory management.
By Type: Finished Vehicle transportation dominates the market, but Auto Components logistics is expected to show robust growth, reflecting the rising complexity of modern vehicles and the increasing demand for specialized logistics services.
APAP Auto Logistics Industry Product Innovations
Recent innovations include the implementation of advanced tracking systems, automated warehousing solutions, and the use of big data analytics for optimizing logistics operations. These advancements enhance efficiency, reduce costs, and improve supply chain transparency. The integration of blockchain technology for secure data management and improved traceability is gaining traction, meeting the increasing demand for supply chain visibility. These innovations address market needs for efficiency, traceability, and sustainability, giving companies a competitive edge.
Report Scope & Segmentation Analysis
This report segments the APAC auto logistics market by Service (Transportation, Warehousing, Distribution and Inventory Management, Other Services), by Type (Finished Vehicle, Auto Components, Other types), and by Country (China, India, Japan, South Korea, Indonesia, Philippines, Rest of Asia-Pacific). Each segment is analyzed based on its growth projections, market size, and competitive landscape. The report provides detailed insights into market dynamics, key players, and future growth opportunities for each segment, offering a comprehensive understanding of the overall APAC auto logistics landscape. The market size for each segment is projected to reach $xx Million by 2033.
Key Drivers of APAC Auto Logistics Industry Growth
The growth of the APAC auto logistics industry is fueled by several factors, including the expansion of the automotive manufacturing sector, the rise of e-commerce, and government initiatives promoting infrastructure development. The increasing adoption of advanced technologies such as automation and data analytics further enhances efficiency and growth. Economic growth in the region and rising consumer spending also contribute significantly to market expansion. Stringent environmental regulations are driving investments in sustainable logistics solutions.
Challenges in the APAC Auto Logistics Industry Sector
The APAC auto logistics industry faces challenges such as infrastructure limitations in certain regions, the complexities of navigating diverse regulatory environments, and increasing competition. Supply chain disruptions, particularly evident post-pandemic, have impacted logistics operations and increased costs. These challenges collectively result in an estimated $xx Million loss annually (2024 estimate) across the APAC region.
Emerging Opportunities in APAC Auto Logistics Industry
The growing adoption of electric vehicles (EVs) presents significant opportunities for auto logistics companies to specialize in EV-specific transportation and charging infrastructure. The rise of shared mobility and autonomous driving technologies also creates new business models and service offerings. Furthermore, the increasing focus on sustainability opens avenues for companies to provide eco-friendly logistics solutions.
Leading Players in the APAC Auto Logistics Industry Market
- DB Schenker
- Hitachi Transport System Ltd
- CEVA Logistics AG
- Neovia Logistics Services LLC
- DHL
- Yusen Logistics Co Ltd
- GEODIS
- Nippon Express Co Ltd
- United Parcel Service Inc
- XPO Logistics Inc
- KUEHNE + NAGEL International AG
- DSV
- Ryder System Inc
Key Developments in APAC Auto Logistics Industry
- December 2022: Tata Motors signed a contract with Everest Fleet Pvt. Ltd. for the delivery of 5,000 XPRES-T EVs. This significantly boosted the demand for EV transportation services.
- March 2023: Tata Motors received an order for 1000 XPRES-T EVs from OHM E Logistics Pvt. Ltd., further solidifying the growth in the EV segment and its impact on auto logistics.
Future Outlook for APAC Auto Logistics Industry Market
The APAC auto logistics market is poised for continued growth, driven by factors such as increasing vehicle production, expanding e-commerce, and the rise of new mobility services. Strategic partnerships, investments in technology, and a focus on sustainable practices will be key to success in this dynamic and evolving market. The market's future potential is substantial, presenting lucrative opportunities for both established players and new entrants.
APAC Auto Logistics Industry Segmentation
-
1. Service
- 1.1. Transportation
- 1.2. Warehousing, Distribution and Inventory Management
- 1.3. Other Services
-
2. Type
- 2.1. Finished Vehicle
- 2.2. Auto Components
- 2.3. Other types
APAC Auto Logistics Industry Segmentation By Geography
-
1. North America
- 1.1. United States
- 1.2. Canada
- 1.3. Mexico
-
2. South America
- 2.1. Brazil
- 2.2. Argentina
- 2.3. Rest of South America
-
3. Europe
- 3.1. United Kingdom
- 3.2. Germany
- 3.3. France
- 3.4. Italy
- 3.5. Spain
- 3.6. Russia
- 3.7. Benelux
- 3.8. Nordics
- 3.9. Rest of Europe
-
4. Middle East & Africa
- 4.1. Turkey
- 4.2. Israel
- 4.3. GCC
- 4.4. North Africa
- 4.5. South Africa
- 4.6. Rest of Middle East & Africa
-
5. Asia Pacific
- 5.1. China
- 5.2. India
- 5.3. Japan
- 5.4. South Korea
- 5.5. ASEAN
- 5.6. Oceania
- 5.7. Rest of Asia Pacific
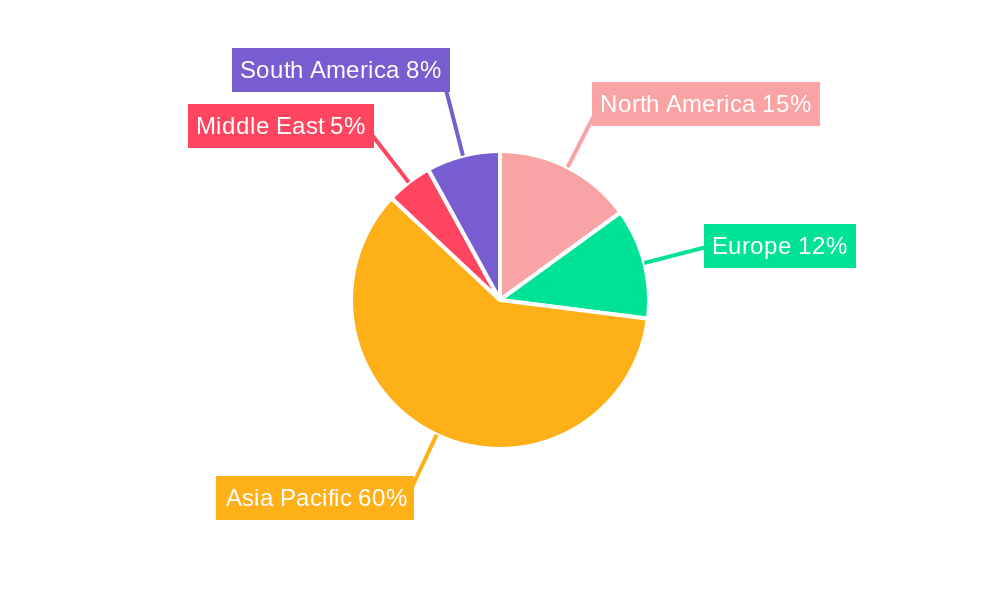
APAC Auto Logistics Industry Regional Market Share
Geographic Coverage of APAC Auto Logistics Industry
APAC Auto Logistics Industry REPORT HIGHLIGHTS
| Aspects | Details |
|---|---|
| Study Period | 2020-2034 |
| Base Year | 2025 |
| Estimated Year | 2026 |
| Forecast Period | 2026-2034 |
| Historical Period | 2020-2025 |
| Growth Rate | CAGR of > 6.50% from 2020-2034 |
| Segmentation |
|
Table of Contents
- 1. Introduction
- 1.1. Research Scope
- 1.2. Market Segmentation
- 1.3. Research Objective
- 1.4. Definitions and Assumptions
- 2. Executive Summary
- 2.1. Market Snapshot
- 3. Market Dynamics
- 3.1. Market Drivers
- 3.2. Market Restrains
- 3.3. Market Trends
- 3.4. Market Opportunities
- 4. Market Factor Analysis
- 4.1. Porters Five Forces
- 4.1.1. Bargaining Power of Suppliers
- 4.1.2. Bargaining Power of Buyers
- 4.1.3. Threat of New Entrants
- 4.1.4. Threat of Substitutes
- 4.1.5. Competitive Rivalry
- 4.2. PESTEL analysis
- 4.3. BCG Analysis
- 4.3.1. Stars (High Growth, High Market Share)
- 4.3.2. Cash Cows (Low Growth, High Market Share)
- 4.3.3. Question Mark (High Growth, Low Market Share)
- 4.3.4. Dogs (Low Growth, Low Market Share)
- 4.4. Ansoff Matrix Analysis
- 4.5. Supply Chain Analysis
- 4.6. Regulatory Landscape
- 4.7. Current Market Potential and Opportunity Assessment (TAM–SAM–SOM Framework)
- 4.8. PRI Analyst Note
- 4.1. Porters Five Forces
- 5. Market Analysis, Insights and Forecast 2021-2033
- 5.1. Market Analysis, Insights and Forecast - by Service
- 5.1.1. Transportation
- 5.1.2. Warehousing, Distribution and Inventory Management
- 5.1.3. Other Services
- 5.2. Market Analysis, Insights and Forecast - by Type
- 5.2.1. Finished Vehicle
- 5.2.2. Auto Components
- 5.2.3. Other types
- 5.3. Market Analysis, Insights and Forecast - by Region
- 5.3.1. North America
- 5.3.2. South America
- 5.3.3. Europe
- 5.3.4. Middle East & Africa
- 5.3.5. Asia Pacific
- 5.1. Market Analysis, Insights and Forecast - by Service
- 6. Global APAC Auto Logistics Industry Analysis, Insights and Forecast, 2021-2033
- 6.1. Market Analysis, Insights and Forecast - by Service
- 6.1.1. Transportation
- 6.1.2. Warehousing, Distribution and Inventory Management
- 6.1.3. Other Services
- 6.2. Market Analysis, Insights and Forecast - by Type
- 6.2.1. Finished Vehicle
- 6.2.2. Auto Components
- 6.2.3. Other types
- 6.1. Market Analysis, Insights and Forecast - by Service
- 7. North America APAC Auto Logistics Industry Analysis, Insights and Forecast, 2020-2032
- 7.1. Market Analysis, Insights and Forecast - by Service
- 7.1.1. Transportation
- 7.1.2. Warehousing, Distribution and Inventory Management
- 7.1.3. Other Services
- 7.2. Market Analysis, Insights and Forecast - by Type
- 7.2.1. Finished Vehicle
- 7.2.2. Auto Components
- 7.2.3. Other types
- 7.1. Market Analysis, Insights and Forecast - by Service
- 8. South America APAC Auto Logistics Industry Analysis, Insights and Forecast, 2020-2032
- 8.1. Market Analysis, Insights and Forecast - by Service
- 8.1.1. Transportation
- 8.1.2. Warehousing, Distribution and Inventory Management
- 8.1.3. Other Services
- 8.2. Market Analysis, Insights and Forecast - by Type
- 8.2.1. Finished Vehicle
- 8.2.2. Auto Components
- 8.2.3. Other types
- 8.1. Market Analysis, Insights and Forecast - by Service
- 9. Europe APAC Auto Logistics Industry Analysis, Insights and Forecast, 2020-2032
- 9.1. Market Analysis, Insights and Forecast - by Service
- 9.1.1. Transportation
- 9.1.2. Warehousing, Distribution and Inventory Management
- 9.1.3. Other Services
- 9.2. Market Analysis, Insights and Forecast - by Type
- 9.2.1. Finished Vehicle
- 9.2.2. Auto Components
- 9.2.3. Other types
- 9.1. Market Analysis, Insights and Forecast - by Service
- 10. Middle East & Africa APAC Auto Logistics Industry Analysis, Insights and Forecast, 2020-2032
- 10.1. Market Analysis, Insights and Forecast - by Service
- 10.1.1. Transportation
- 10.1.2. Warehousing, Distribution and Inventory Management
- 10.1.3. Other Services
- 10.2. Market Analysis, Insights and Forecast - by Type
- 10.2.1. Finished Vehicle
- 10.2.2. Auto Components
- 10.2.3. Other types
- 10.1. Market Analysis, Insights and Forecast - by Service
- 11. Asia Pacific APAC Auto Logistics Industry Analysis, Insights and Forecast, 2020-2032
- 11.1. Market Analysis, Insights and Forecast - by Service
- 11.1.1. Transportation
- 11.1.2. Warehousing, Distribution and Inventory Management
- 11.1.3. Other Services
- 11.2. Market Analysis, Insights and Forecast - by Type
- 11.2.1. Finished Vehicle
- 11.2.2. Auto Components
- 11.2.3. Other types
- 11.1. Market Analysis, Insights and Forecast - by Service
- 12. Competitive Analysis
- 12.1. Company Profiles
- 12.1.1 DB Schenker
- 12.1.1.1. Company Overview
- 12.1.1.2. Products
- 12.1.1.3. Company Financials
- 12.1.1.4. SWOT Analysis
- 12.1.2 Hitachi Transport System Ltd
- 12.1.2.1. Company Overview
- 12.1.2.2. Products
- 12.1.2.3. Company Financials
- 12.1.2.4. SWOT Analysis
- 12.1.3 CEVA Logistics AG
- 12.1.3.1. Company Overview
- 12.1.3.2. Products
- 12.1.3.3. Company Financials
- 12.1.3.4. SWOT Analysis
- 12.1.4 Neovia Logistics Services LLC
- 12.1.4.1. Company Overview
- 12.1.4.2. Products
- 12.1.4.3. Company Financials
- 12.1.4.4. SWOT Analysis
- 12.1.5 DHL
- 12.1.5.1. Company Overview
- 12.1.5.2. Products
- 12.1.5.3. Company Financials
- 12.1.5.4. SWOT Analysis
- 12.1.6 Yusen Logistics Co Ltd
- 12.1.6.1. Company Overview
- 12.1.6.2. Products
- 12.1.6.3. Company Financials
- 12.1.6.4. SWOT Analysis
- 12.1.7 GEODIS
- 12.1.7.1. Company Overview
- 12.1.7.2. Products
- 12.1.7.3. Company Financials
- 12.1.7.4. SWOT Analysis
- 12.1.8 Nippon Express Co Ltd
- 12.1.8.1. Company Overview
- 12.1.8.2. Products
- 12.1.8.3. Company Financials
- 12.1.8.4. SWOT Analysis
- 12.1.9 United Parcel Service Inc**List Not Exhaustive
- 12.1.9.1. Company Overview
- 12.1.9.2. Products
- 12.1.9.3. Company Financials
- 12.1.9.4. SWOT Analysis
- 12.1.10 XPO Logistics Inc
- 12.1.10.1. Company Overview
- 12.1.10.2. Products
- 12.1.10.3. Company Financials
- 12.1.10.4. SWOT Analysis
- 12.1.11 KUEHNE + NAGEL International AG
- 12.1.11.1. Company Overview
- 12.1.11.2. Products
- 12.1.11.3. Company Financials
- 12.1.11.4. SWOT Analysis
- 12.1.12 DSV
- 12.1.12.1. Company Overview
- 12.1.12.2. Products
- 12.1.12.3. Company Financials
- 12.1.12.4. SWOT Analysis
- 12.1.13 Ryder System Inc
- 12.1.13.1. Company Overview
- 12.1.13.2. Products
- 12.1.13.3. Company Financials
- 12.1.13.4. SWOT Analysis
- 12.1.1 DB Schenker
- 12.2. Market Entropy
- 12.2.1 Company's Key Areas Served
- 12.2.2 Recent Developments
- 12.3. Company Market Share Analysis 2025
- 12.3.1 Top 5 Companies Market Share Analysis
- 12.3.2 Top 3 Companies Market Share Analysis
- 12.4. List of Potential Customers
- 13. Research Methodology
List of Figures
- Figure 1: Global APAC Auto Logistics Industry Revenue Breakdown (Million, %) by Region 2025 & 2033
- Figure 2: North America APAC Auto Logistics Industry Revenue (Million), by Service 2025 & 2033
- Figure 3: North America APAC Auto Logistics Industry Revenue Share (%), by Service 2025 & 2033
- Figure 4: North America APAC Auto Logistics Industry Revenue (Million), by Type 2025 & 2033
- Figure 5: North America APAC Auto Logistics Industry Revenue Share (%), by Type 2025 & 2033
- Figure 6: North America APAC Auto Logistics Industry Revenue (Million), by Country 2025 & 2033
- Figure 7: North America APAC Auto Logistics Industry Revenue Share (%), by Country 2025 & 2033
- Figure 8: South America APAC Auto Logistics Industry Revenue (Million), by Service 2025 & 2033
- Figure 9: South America APAC Auto Logistics Industry Revenue Share (%), by Service 2025 & 2033
- Figure 10: South America APAC Auto Logistics Industry Revenue (Million), by Type 2025 & 2033
- Figure 11: South America APAC Auto Logistics Industry Revenue Share (%), by Type 2025 & 2033
- Figure 12: South America APAC Auto Logistics Industry Revenue (Million), by Country 2025 & 2033
- Figure 13: South America APAC Auto Logistics Industry Revenue Share (%), by Country 2025 & 2033
- Figure 14: Europe APAC Auto Logistics Industry Revenue (Million), by Service 2025 & 2033
- Figure 15: Europe APAC Auto Logistics Industry Revenue Share (%), by Service 2025 & 2033
- Figure 16: Europe APAC Auto Logistics Industry Revenue (Million), by Type 2025 & 2033
- Figure 17: Europe APAC Auto Logistics Industry Revenue Share (%), by Type 2025 & 2033
- Figure 18: Europe APAC Auto Logistics Industry Revenue (Million), by Country 2025 & 2033
- Figure 19: Europe APAC Auto Logistics Industry Revenue Share (%), by Country 2025 & 2033
- Figure 20: Middle East & Africa APAC Auto Logistics Industry Revenue (Million), by Service 2025 & 2033
- Figure 21: Middle East & Africa APAC Auto Logistics Industry Revenue Share (%), by Service 2025 & 2033
- Figure 22: Middle East & Africa APAC Auto Logistics Industry Revenue (Million), by Type 2025 & 2033
- Figure 23: Middle East & Africa APAC Auto Logistics Industry Revenue Share (%), by Type 2025 & 2033
- Figure 24: Middle East & Africa APAC Auto Logistics Industry Revenue (Million), by Country 2025 & 2033
- Figure 25: Middle East & Africa APAC Auto Logistics Industry Revenue Share (%), by Country 2025 & 2033
- Figure 26: Asia Pacific APAC Auto Logistics Industry Revenue (Million), by Service 2025 & 2033
- Figure 27: Asia Pacific APAC Auto Logistics Industry Revenue Share (%), by Service 2025 & 2033
- Figure 28: Asia Pacific APAC Auto Logistics Industry Revenue (Million), by Type 2025 & 2033
- Figure 29: Asia Pacific APAC Auto Logistics Industry Revenue Share (%), by Type 2025 & 2033
- Figure 30: Asia Pacific APAC Auto Logistics Industry Revenue (Million), by Country 2025 & 2033
- Figure 31: Asia Pacific APAC Auto Logistics Industry Revenue Share (%), by Country 2025 & 2033
List of Tables
- Table 1: Global APAC Auto Logistics Industry Revenue Million Forecast, by Service 2020 & 2033
- Table 2: Global APAC Auto Logistics Industry Revenue Million Forecast, by Type 2020 & 2033
- Table 3: Global APAC Auto Logistics Industry Revenue Million Forecast, by Region 2020 & 2033
- Table 4: Global APAC Auto Logistics Industry Revenue Million Forecast, by Service 2020 & 2033
- Table 5: Global APAC Auto Logistics Industry Revenue Million Forecast, by Type 2020 & 2033
- Table 6: Global APAC Auto Logistics Industry Revenue Million Forecast, by Country 2020 & 2033
- Table 7: United States APAC Auto Logistics Industry Revenue (Million) Forecast, by Application 2020 & 2033
- Table 8: Canada APAC Auto Logistics Industry Revenue (Million) Forecast, by Application 2020 & 2033
- Table 9: Mexico APAC Auto Logistics Industry Revenue (Million) Forecast, by Application 2020 & 2033
- Table 10: Global APAC Auto Logistics Industry Revenue Million Forecast, by Service 2020 & 2033
- Table 11: Global APAC Auto Logistics Industry Revenue Million Forecast, by Type 2020 & 2033
- Table 12: Global APAC Auto Logistics Industry Revenue Million Forecast, by Country 2020 & 2033
- Table 13: Brazil APAC Auto Logistics Industry Revenue (Million) Forecast, by Application 2020 & 2033
- Table 14: Argentina APAC Auto Logistics Industry Revenue (Million) Forecast, by Application 2020 & 2033
- Table 15: Rest of South America APAC Auto Logistics Industry Revenue (Million) Forecast, by Application 2020 & 2033
- Table 16: Global APAC Auto Logistics Industry Revenue Million Forecast, by Service 2020 & 2033
- Table 17: Global APAC Auto Logistics Industry Revenue Million Forecast, by Type 2020 & 2033
- Table 18: Global APAC Auto Logistics Industry Revenue Million Forecast, by Country 2020 & 2033
- Table 19: United Kingdom APAC Auto Logistics Industry Revenue (Million) Forecast, by Application 2020 & 2033
- Table 20: Germany APAC Auto Logistics Industry Revenue (Million) Forecast, by Application 2020 & 2033
- Table 21: France APAC Auto Logistics Industry Revenue (Million) Forecast, by Application 2020 & 2033
- Table 22: Italy APAC Auto Logistics Industry Revenue (Million) Forecast, by Application 2020 & 2033
- Table 23: Spain APAC Auto Logistics Industry Revenue (Million) Forecast, by Application 2020 & 2033
- Table 24: Russia APAC Auto Logistics Industry Revenue (Million) Forecast, by Application 2020 & 2033
- Table 25: Benelux APAC Auto Logistics Industry Revenue (Million) Forecast, by Application 2020 & 2033
- Table 26: Nordics APAC Auto Logistics Industry Revenue (Million) Forecast, by Application 2020 & 2033
- Table 27: Rest of Europe APAC Auto Logistics Industry Revenue (Million) Forecast, by Application 2020 & 2033
- Table 28: Global APAC Auto Logistics Industry Revenue Million Forecast, by Service 2020 & 2033
- Table 29: Global APAC Auto Logistics Industry Revenue Million Forecast, by Type 2020 & 2033
- Table 30: Global APAC Auto Logistics Industry Revenue Million Forecast, by Country 2020 & 2033
- Table 31: Turkey APAC Auto Logistics Industry Revenue (Million) Forecast, by Application 2020 & 2033
- Table 32: Israel APAC Auto Logistics Industry Revenue (Million) Forecast, by Application 2020 & 2033
- Table 33: GCC APAC Auto Logistics Industry Revenue (Million) Forecast, by Application 2020 & 2033
- Table 34: North Africa APAC Auto Logistics Industry Revenue (Million) Forecast, by Application 2020 & 2033
- Table 35: South Africa APAC Auto Logistics Industry Revenue (Million) Forecast, by Application 2020 & 2033
- Table 36: Rest of Middle East & Africa APAC Auto Logistics Industry Revenue (Million) Forecast, by Application 2020 & 2033
- Table 37: Global APAC Auto Logistics Industry Revenue Million Forecast, by Service 2020 & 2033
- Table 38: Global APAC Auto Logistics Industry Revenue Million Forecast, by Type 2020 & 2033
- Table 39: Global APAC Auto Logistics Industry Revenue Million Forecast, by Country 2020 & 2033
- Table 40: China APAC Auto Logistics Industry Revenue (Million) Forecast, by Application 2020 & 2033
- Table 41: India APAC Auto Logistics Industry Revenue (Million) Forecast, by Application 2020 & 2033
- Table 42: Japan APAC Auto Logistics Industry Revenue (Million) Forecast, by Application 2020 & 2033
- Table 43: South Korea APAC Auto Logistics Industry Revenue (Million) Forecast, by Application 2020 & 2033
- Table 44: ASEAN APAC Auto Logistics Industry Revenue (Million) Forecast, by Application 2020 & 2033
- Table 45: Oceania APAC Auto Logistics Industry Revenue (Million) Forecast, by Application 2020 & 2033
- Table 46: Rest of Asia Pacific APAC Auto Logistics Industry Revenue (Million) Forecast, by Application 2020 & 2033
Frequently Asked Questions
1. What is the projected Compound Annual Growth Rate (CAGR) of the APAC Auto Logistics Industry?
The projected CAGR is approximately > 6.50%.
2. Which companies are prominent players in the APAC Auto Logistics Industry?
Key companies in the market include DB Schenker, Hitachi Transport System Ltd, CEVA Logistics AG, Neovia Logistics Services LLC, DHL, Yusen Logistics Co Ltd, GEODIS, Nippon Express Co Ltd, United Parcel Service Inc**List Not Exhaustive, XPO Logistics Inc, KUEHNE + NAGEL International AG, DSV, Ryder System Inc.
3. What are the main segments of the APAC Auto Logistics Industry?
The market segments include Service, Type.
4. Can you provide details about the market size?
The market size is estimated to be USD 289.04 Million as of 2022.
5. What are some drivers contributing to market growth?
Rising Number of Partnerships among Automobile Manufacturers and Logistics Partners; Growth in international trade.
6. What are the notable trends driving market growth?
Demand for Electric Vehicles are increasing in the region.
7. Are there any restraints impacting market growth?
Nature of Supply Chain Business.
8. Can you provide examples of recent developments in the market?
March 2023: Tata Motors, One of India’s leading automobile manufacturers and the pioneer of India’s EV evolution, received an order for providing 1000 XPRES-T EVs to OHM E Logistics Pvt. Ltd. in Hyderabad for their electric cab transportation services. These cars will be delivered to OHM E Logistics in a phased manner.
9. What pricing options are available for accessing the report?
Pricing options include single-user, multi-user, and enterprise licenses priced at USD 4750, USD 4950, and USD 6800 respectively.
10. Is the market size provided in terms of value or volume?
The market size is provided in terms of value, measured in Million.
11. Are there any specific market keywords associated with the report?
Yes, the market keyword associated with the report is "APAC Auto Logistics Industry," which aids in identifying and referencing the specific market segment covered.
12. How do I determine which pricing option suits my needs best?
The pricing options vary based on user requirements and access needs. Individual users may opt for single-user licenses, while businesses requiring broader access may choose multi-user or enterprise licenses for cost-effective access to the report.
13. Are there any additional resources or data provided in the APAC Auto Logistics Industry report?
While the report offers comprehensive insights, it's advisable to review the specific contents or supplementary materials provided to ascertain if additional resources or data are available.
14. How can I stay updated on further developments or reports in the APAC Auto Logistics Industry?
To stay informed about further developments, trends, and reports in the APAC Auto Logistics Industry, consider subscribing to industry newsletters, following relevant companies and organizations, or regularly checking reputable industry news sources and publications.
Methodology
Step 1 - Identification of Relevant Samples Size from Population Database


Step 2 - Approaches for Defining Global Market Size (Value, Volume* & Price*)

Note*: In applicable scenarios
Step 3 - Data Sources
Primary Research
- Web Analytics
- Survey Reports
- Research Institute
- Latest Research Reports
- Opinion Leaders
Secondary Research
- Annual Reports
- White Paper
- Latest Press Release
- Industry Association
- Paid Database
- Investor Presentations

Step 4 - Data Triangulation
Involves using different sources of information in order to increase the validity of a study
These sources are likely to be stakeholders in a program - participants, other researchers, program staff, other community members, and so on.
Then we put all data in single framework & apply various statistical tools to find out the dynamic on the market.
During the analysis stage, feedback from the stakeholder groups would be compared to determine areas of agreement as well as areas of divergence