

Key Insights
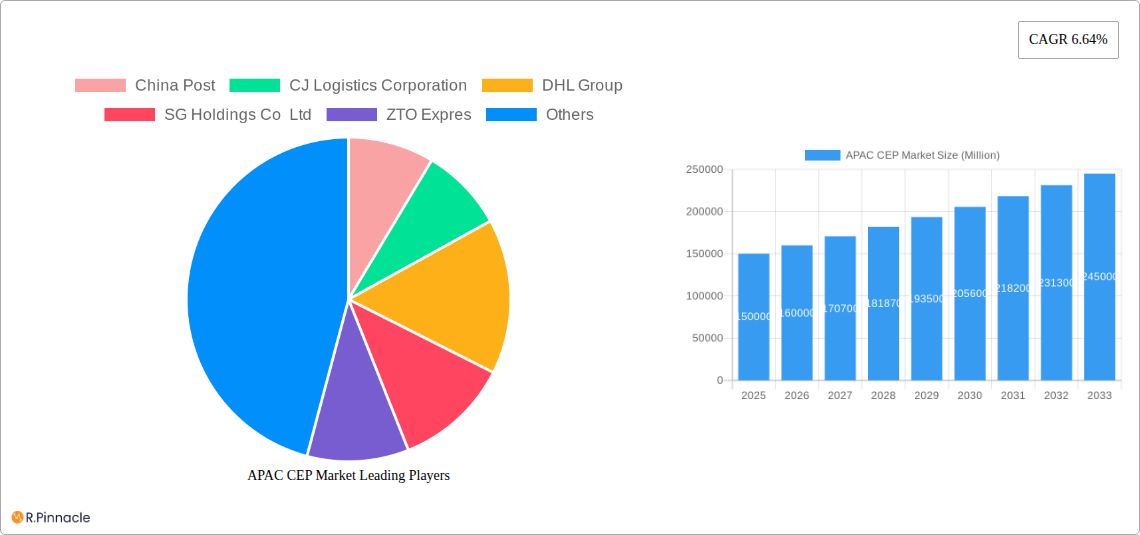
The Asia-Pacific (APAC) Courier, Express, and Parcel (CEP) market is experiencing robust growth, fueled by the region's burgeoning e-commerce sector, expanding financial services, and increasing healthcare logistics needs. The market's 6.64% Compound Annual Growth Rate (CAGR) from 2019 to 2024 indicates a significant upward trajectory, projected to continue through 2033. Key drivers include rising disposable incomes, improved infrastructure in several APAC nations, and the increasing adoption of digital technologies across various industries. The dominance of e-commerce is particularly noteworthy, driving demand for faster and more reliable delivery options, especially express services. While growth is widespread across the region, China, India, and Indonesia are expected to be major contributors, given their large populations and rapidly expanding economies. However, challenges remain, including fluctuating fuel prices impacting transportation costs, the need for enhanced last-mile delivery infrastructure in certain areas, and the complexities of navigating diverse regulatory environments across different countries. Segment analysis reveals strong growth in B2C models, driven by e-commerce, while B2B segments continue to exhibit steady growth, reflecting the increasing reliance on efficient supply chains within manufacturing and other sectors. Air transport remains a significant mode for international shipments, while road transport dominates domestic deliveries, especially for lighter weight packages.
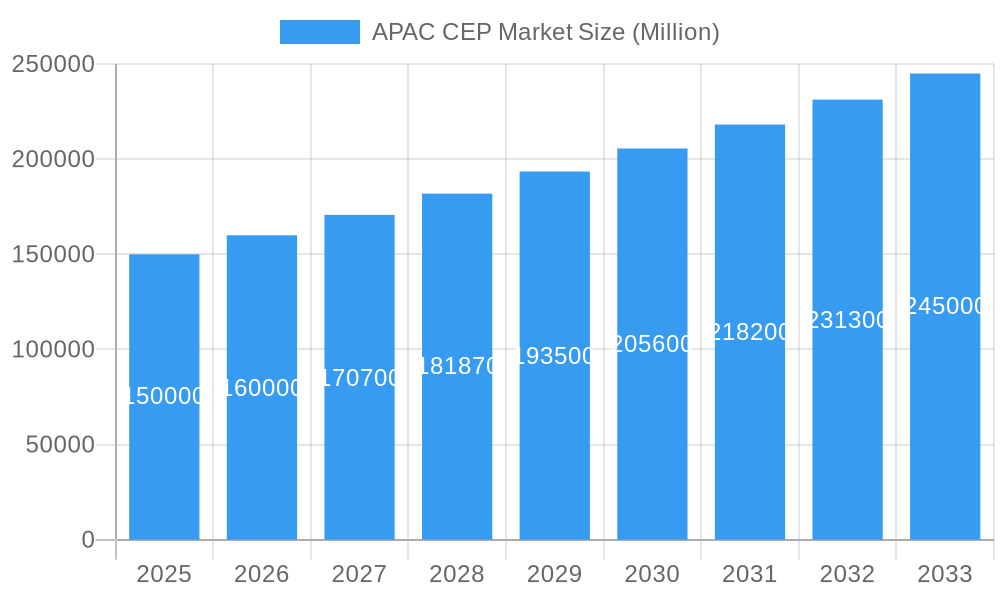
APAC CEP Market Market Size (In Billion)
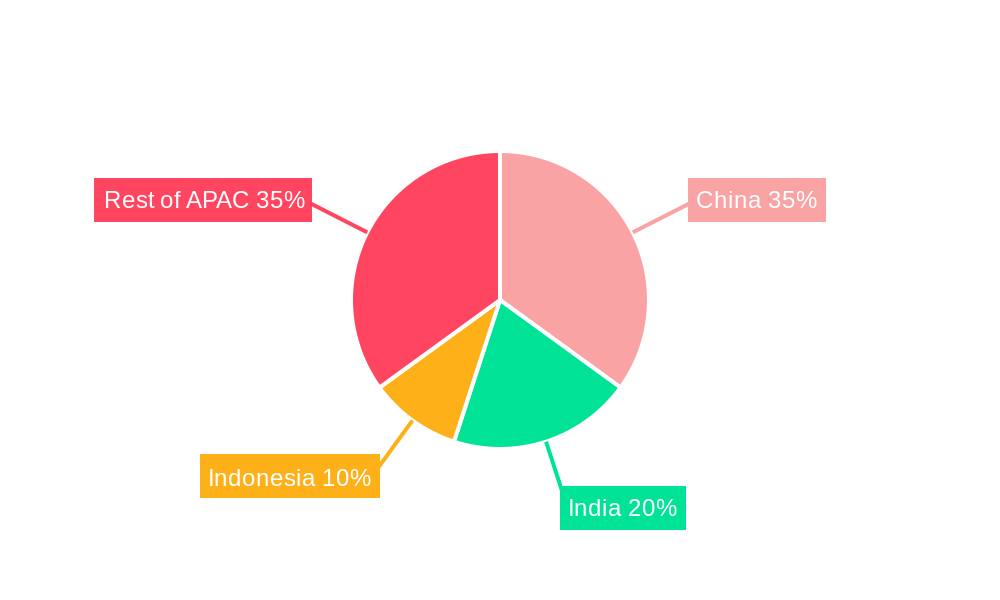
The segmentation of the APAC CEP market provides a granular view of its dynamics. The E-commerce sector is undeniably the primary end-user industry driving market growth, followed by financial services and healthcare. While the market is geographically diverse, growth is concentrated in specific countries like China, India, and Indonesia, due to factors such as their large populations, expanding middle classes and investments in logistics infrastructure. The preference for delivery speed varies based on the shipment type and industry; express deliveries are crucial for e-commerce and time-sensitive goods, while non-express options cater to less urgent shipments. The diversity in shipment weights further highlights the market’s breadth, accommodating various product categories and business needs. Continued investment in technology, including advanced tracking systems and optimized delivery routes, are crucial for meeting growing customer expectations and maintaining market competitiveness. The competitive landscape is characterized by both established global players and regional leaders, engaged in a dynamic interplay of market share acquisition and service differentiation.
APAC CEP Market Company Market Share
APAC CEP Market Report: 2019-2033 Forecast
This comprehensive report provides a detailed analysis of the Asia-Pacific (APAC) Courier, Express, and Parcel (CEP) market, offering invaluable insights for industry professionals, investors, and strategists. Covering the period from 2019 to 2033, with a focus on 2025, this report unveils market dynamics, growth drivers, competitive landscapes, and future opportunities within this rapidly evolving sector. The market is valued at xx Million in 2025 and is projected to reach xx Million by 2033, exhibiting a CAGR of xx%.
APAC CEP Market Market Structure & Innovation Trends
The APAC CEP market is characterized by a dynamic interplay of established players and emerging entrants. Market concentration is moderate, with a few dominant players commanding significant market share, while numerous regional and niche players cater to specific segments. China, India, and Japan represent the largest national markets. For example, in 2024, SF Express (KEX-SF) held an estimated xx% market share in China, while DHL Group commanded approximately xx% across the APAC region. Innovation is driven by technological advancements in automation, AI, and data analytics, aiming to enhance efficiency, tracking, and delivery speed. Regulatory frameworks vary across countries, impacting operational costs and compliance. Product substitutes, such as postal services and localized delivery networks, pose a competitive threat. End-user demographics are shifting towards a digitally savvy population, driving demand for e-commerce-focused CEP services. M&A activity has been significant, with deal values exceeding xx Million in the past five years, primarily focused on expanding geographical reach and service capabilities. Examples include the strategic acquisitions of regional players by global giants to strengthen their market presence.
APAC CEP Market Market Dynamics & Trends
The APAC CEP market is experiencing robust growth fueled by several key factors. The exponential rise of e-commerce, particularly in developing economies, is a primary driver, pushing demand for efficient and reliable delivery services. The increasing penetration of smartphones and internet access further accelerates this growth. Technological disruptions, such as the adoption of automated sorting systems, drone delivery, and AI-powered route optimization, are improving operational efficiency and lowering costs. Changing consumer preferences towards faster and more convenient delivery options, including same-day and next-day delivery, are shaping market trends. Intense competitive dynamics, with both price wars and service differentiation strategies, are a hallmark of the market. The CAGR for the market is estimated at xx% during the forecast period (2025-2033), reflecting the significant growth potential. Market penetration in rural areas remains a significant opportunity, driving expansion beyond major urban centers.
Dominant Regions & Segments in APAC CEP Market
- Leading Region: China dominates the APAC CEP market due to its vast population, burgeoning e-commerce sector, and robust infrastructure investments.
- Leading Countries: China, India, and Japan represent the largest national markets, driven by high population density, robust economic growth, and increasing online shopping habits.
- Leading Mode of Transport: Road transport accounts for the largest share of the market due to its cost-effectiveness and wide reach, particularly for domestic shipments. Air transport is crucial for international shipments and time-sensitive deliveries.
- Leading End-User Industry: E-commerce is the dominant end-user segment, fueled by the rapid expansion of online retail platforms and consumer adoption. The BFSI sector is also a significant contributor due to the need for secure and timely document delivery.
China's dominance stems from its extensive logistics network, technological advancements, and supportive government policies. India’s growth is fueled by its young, digitally-engaged population and expanding middle class. Japan’s market is characterized by high service quality expectations and technological sophistication. The dominance of road transport reflects its affordability and accessibility, especially in geographically diverse regions. E-commerce’s leading role reflects the rapid growth and ubiquity of online shopping across the APAC region.
APAC CEP Market Product Innovations
The APAC CEP market is witnessing significant product innovations driven by technological advancements. Companies are adopting automation, AI-powered route optimization, and sophisticated tracking systems to improve efficiency and reduce delivery times. The integration of robotics and drones into last-mile delivery is gaining traction, particularly for addressing challenges in urban environments. These innovations are improving delivery speed, reliability, and cost-effectiveness, thereby enhancing the overall customer experience and creating a competitive advantage for the players who embrace these trends effectively.
Report Scope & Segmentation Analysis
This report segments the APAC CEP market across various dimensions:
- Mode of Transport: Air, Road, Others (Rail, Sea)
- End-User Industry: E-commerce, Financial Services (BFSI), Healthcare, Manufacturing, Primary Industry, Wholesale and Retail Trade (Offline), Others
- Country: Australia, China, India, Indonesia, Japan, Malaysia, Pakistan, Philippines, Thailand, Vietnam, Rest of Asia Pacific
- Destination: Domestic, International
- Speed of Delivery: Express, Non-Express
- Model: Business-to-Business (B2B), Business-to-Consumer (B2C), Consumer-to-Consumer (C2C)
- Shipment Weight: Light Weight Shipments, Medium Weight Shipments, Heavy Weight Shipments
Each segment is analyzed in detail, providing market size, growth projections, and competitive dynamics. Market size for each segment is presented for the historical period (2019-2024), the base year (2025), and the forecast period (2025-2033).
Key Drivers of APAC CEP Market Growth
The APAC CEP market’s growth is propelled by several factors. The rapid expansion of e-commerce significantly boosts demand for efficient delivery solutions. Technological advancements, like AI and automation, streamline operations, reduce costs, and enhance service quality. Favorable government policies supporting infrastructure development and logistics modernization contribute significantly. Furthermore, the rising disposable incomes and increasing urbanization across the region increase consumer spending and logistics demands.
Challenges in the APAC CEP Market Sector
The APAC CEP market faces challenges including varying regulatory landscapes across different countries, requiring companies to navigate complex compliance requirements. Infrastructure limitations, particularly in less developed areas, hamper efficient and timely deliveries. Intense competition among numerous players leads to price pressures and necessitates constant innovation for market differentiation. Fluctuations in fuel prices and geopolitical uncertainties also impact operational costs and market stability.
Emerging Opportunities in APAP CEP Market
Several emerging opportunities exist in the APAC CEP market. Expansion into underserved rural areas presents significant potential. The adoption of sustainable logistics practices, such as electric vehicle fleets and green packaging, is gaining momentum. The increasing use of big data and analytics to optimize logistics and improve customer experience opens up new possibilities. Furthermore, the integration of fintech solutions for streamlined payment processes is expected to further enhance market growth.
Leading Players in the APAC CEP Market Market
- China Post
- CJ Logistics Corporation
- DHL Group
- SG Holdings Co Ltd
- ZTO Expres
- FedEx
- United Parcel Service of America Inc (UPS)
- YTO Express
- Yamato Holdings
- SF Express (KEX-SF)
- Blue Dart Express
- DTDC Express Limited
- Toll Group
- JWD Group
Key Developments in APAC CEP Market Industry
- June 2023: China Post launched its first integrated indoor and outdoor “Robot Plus” AI delivery solution in China, enhancing last-mile delivery efficiency.
- April 2023: China Post and Ping An Bank launched an intelligent archives service center, integrating auto finance and logistics services.
- March 2023: Colowide MD Co. Ltd and Yamato Transport Co. Ltd partnered to optimize the supply chain of the Colowide Group, showcasing technological integration in logistics.
Future Outlook for APAC CEP Market Market
The APAC CEP market is poised for sustained growth, driven by continued e-commerce expansion, technological innovation, and supportive government policies. Strategic partnerships, investments in infrastructure, and focus on sustainable practices will be crucial for success. The market will likely see increased consolidation among players, further technological advancements in automation and AI, and an enhanced customer focus on personalization and seamless delivery experiences. The market is expected to see significant growth in the coming years, presenting lucrative opportunities for established and emerging players alike.
APAC CEP Market Segmentation
-
1. Destination
- 1.1. Domestic
- 1.2. International
-
2. Speed Of Delivery
- 2.1. Express
- 2.2. Non-Express
-
3. Model
- 3.1. Business-to-Business (B2B)
- 3.2. Business-to-Consumer (B2C)
- 3.3. Consumer-to-Consumer (C2C)
-
4. Shipment Weight
- 4.1. Heavy Weight Shipments
- 4.2. Light Weight Shipments
- 4.3. Medium Weight Shipments
-
5. Mode Of Transport
- 5.1. Air
- 5.2. Road
- 5.3. Others
-
6. End User Industry
- 6.1. E-Commerce
- 6.2. Financial Services (BFSI)
- 6.3. Healthcare
- 6.4. Manufacturing
- 6.5. Primary Industry
- 6.6. Wholesale and Retail Trade (Offline)
- 6.7. Others
APAC CEP Market Segmentation By Geography
-
1. North America
- 1.1. United States
- 1.2. Canada
- 1.3. Mexico
-
2. South America
- 2.1. Brazil
- 2.2. Argentina
- 2.3. Rest of South America
-
3. Europe
- 3.1. United Kingdom
- 3.2. Germany
- 3.3. France
- 3.4. Italy
- 3.5. Spain
- 3.6. Russia
- 3.7. Benelux
- 3.8. Nordics
- 3.9. Rest of Europe
-
4. Middle East & Africa
- 4.1. Turkey
- 4.2. Israel
- 4.3. GCC
- 4.4. North Africa
- 4.5. South Africa
- 4.6. Rest of Middle East & Africa
-
5. Asia Pacific
- 5.1. China
- 5.2. India
- 5.3. Japan
- 5.4. South Korea
- 5.5. ASEAN
- 5.6. Oceania
- 5.7. Rest of Asia Pacific
APAC CEP Market Regional Market Share
Geographic Coverage of APAC CEP Market
APAC CEP Market REPORT HIGHLIGHTS
| Aspects | Details |
|---|---|
| Study Period | 2020-2034 |
| Base Year | 2025 |
| Estimated Year | 2026 |
| Forecast Period | 2026-2034 |
| Historical Period | 2020-2025 |
| Growth Rate | CAGR of 6.64% from 2020-2034 |
| Segmentation |
|
Table of Contents
- 1. Introduction
- 1.1. Research Scope
- 1.2. Market Segmentation
- 1.3. Research Objective
- 1.4. Definitions and Assumptions
- 2. Executive Summary
- 2.1. Market Snapshot
- 3. Market Dynamics
- 3.1. Market Drivers
- 3.2. Market Restrains
- 3.3. Market Trends
- 3.4. Market Opportunities
- 4. Market Factor Analysis
- 4.1. Porters Five Forces
- 4.1.1. Bargaining Power of Suppliers
- 4.1.2. Bargaining Power of Buyers
- 4.1.3. Threat of New Entrants
- 4.1.4. Threat of Substitutes
- 4.1.5. Competitive Rivalry
- 4.2. PESTEL analysis
- 4.3. BCG Analysis
- 4.3.1. Stars (High Growth, High Market Share)
- 4.3.2. Cash Cows (Low Growth, High Market Share)
- 4.3.3. Question Mark (High Growth, Low Market Share)
- 4.3.4. Dogs (Low Growth, Low Market Share)
- 4.4. Ansoff Matrix Analysis
- 4.5. Supply Chain Analysis
- 4.6. Regulatory Landscape
- 4.7. Current Market Potential and Opportunity Assessment (TAM–SAM–SOM Framework)
- 4.8. PRI Analyst Note
- 4.1. Porters Five Forces
- 5. Market Analysis, Insights and Forecast 2021-2033
- 5.1. Market Analysis, Insights and Forecast - by Destination
- 5.1.1. Domestic
- 5.1.2. International
- 5.2. Market Analysis, Insights and Forecast - by Speed Of Delivery
- 5.2.1. Express
- 5.2.2. Non-Express
- 5.3. Market Analysis, Insights and Forecast - by Model
- 5.3.1. Business-to-Business (B2B)
- 5.3.2. Business-to-Consumer (B2C)
- 5.3.3. Consumer-to-Consumer (C2C)
- 5.4. Market Analysis, Insights and Forecast - by Shipment Weight
- 5.4.1. Heavy Weight Shipments
- 5.4.2. Light Weight Shipments
- 5.4.3. Medium Weight Shipments
- 5.5. Market Analysis, Insights and Forecast - by Mode Of Transport
- 5.5.1. Air
- 5.5.2. Road
- 5.5.3. Others
- 5.6. Market Analysis, Insights and Forecast - by End User Industry
- 5.6.1. E-Commerce
- 5.6.2. Financial Services (BFSI)
- 5.6.3. Healthcare
- 5.6.4. Manufacturing
- 5.6.5. Primary Industry
- 5.6.6. Wholesale and Retail Trade (Offline)
- 5.6.7. Others
- 5.7. Market Analysis, Insights and Forecast - by Region
- 5.7.1. North America
- 5.7.2. South America
- 5.7.3. Europe
- 5.7.4. Middle East & Africa
- 5.7.5. Asia Pacific
- 5.1. Market Analysis, Insights and Forecast - by Destination
- 6. Global APAC CEP Market Analysis, Insights and Forecast, 2021-2033
- 6.1. Market Analysis, Insights and Forecast - by Destination
- 6.1.1. Domestic
- 6.1.2. International
- 6.2. Market Analysis, Insights and Forecast - by Speed Of Delivery
- 6.2.1. Express
- 6.2.2. Non-Express
- 6.3. Market Analysis, Insights and Forecast - by Model
- 6.3.1. Business-to-Business (B2B)
- 6.3.2. Business-to-Consumer (B2C)
- 6.3.3. Consumer-to-Consumer (C2C)
- 6.4. Market Analysis, Insights and Forecast - by Shipment Weight
- 6.4.1. Heavy Weight Shipments
- 6.4.2. Light Weight Shipments
- 6.4.3. Medium Weight Shipments
- 6.5. Market Analysis, Insights and Forecast - by Mode Of Transport
- 6.5.1. Air
- 6.5.2. Road
- 6.5.3. Others
- 6.6. Market Analysis, Insights and Forecast - by End User Industry
- 6.6.1. E-Commerce
- 6.6.2. Financial Services (BFSI)
- 6.6.3. Healthcare
- 6.6.4. Manufacturing
- 6.6.5. Primary Industry
- 6.6.6. Wholesale and Retail Trade (Offline)
- 6.6.7. Others
- 6.1. Market Analysis, Insights and Forecast - by Destination
- 7. North America APAC CEP Market Analysis, Insights and Forecast, 2020-2032
- 7.1. Market Analysis, Insights and Forecast - by Destination
- 7.1.1. Domestic
- 7.1.2. International
- 7.2. Market Analysis, Insights and Forecast - by Speed Of Delivery
- 7.2.1. Express
- 7.2.2. Non-Express
- 7.3. Market Analysis, Insights and Forecast - by Model
- 7.3.1. Business-to-Business (B2B)
- 7.3.2. Business-to-Consumer (B2C)
- 7.3.3. Consumer-to-Consumer (C2C)
- 7.4. Market Analysis, Insights and Forecast - by Shipment Weight
- 7.4.1. Heavy Weight Shipments
- 7.4.2. Light Weight Shipments
- 7.4.3. Medium Weight Shipments
- 7.5. Market Analysis, Insights and Forecast - by Mode Of Transport
- 7.5.1. Air
- 7.5.2. Road
- 7.5.3. Others
- 7.6. Market Analysis, Insights and Forecast - by End User Industry
- 7.6.1. E-Commerce
- 7.6.2. Financial Services (BFSI)
- 7.6.3. Healthcare
- 7.6.4. Manufacturing
- 7.6.5. Primary Industry
- 7.6.6. Wholesale and Retail Trade (Offline)
- 7.6.7. Others
- 7.1. Market Analysis, Insights and Forecast - by Destination
- 8. South America APAC CEP Market Analysis, Insights and Forecast, 2020-2032
- 8.1. Market Analysis, Insights and Forecast - by Destination
- 8.1.1. Domestic
- 8.1.2. International
- 8.2. Market Analysis, Insights and Forecast - by Speed Of Delivery
- 8.2.1. Express
- 8.2.2. Non-Express
- 8.3. Market Analysis, Insights and Forecast - by Model
- 8.3.1. Business-to-Business (B2B)
- 8.3.2. Business-to-Consumer (B2C)
- 8.3.3. Consumer-to-Consumer (C2C)
- 8.4. Market Analysis, Insights and Forecast - by Shipment Weight
- 8.4.1. Heavy Weight Shipments
- 8.4.2. Light Weight Shipments
- 8.4.3. Medium Weight Shipments
- 8.5. Market Analysis, Insights and Forecast - by Mode Of Transport
- 8.5.1. Air
- 8.5.2. Road
- 8.5.3. Others
- 8.6. Market Analysis, Insights and Forecast - by End User Industry
- 8.6.1. E-Commerce
- 8.6.2. Financial Services (BFSI)
- 8.6.3. Healthcare
- 8.6.4. Manufacturing
- 8.6.5. Primary Industry
- 8.6.6. Wholesale and Retail Trade (Offline)
- 8.6.7. Others
- 8.1. Market Analysis, Insights and Forecast - by Destination
- 9. Europe APAC CEP Market Analysis, Insights and Forecast, 2020-2032
- 9.1. Market Analysis, Insights and Forecast - by Destination
- 9.1.1. Domestic
- 9.1.2. International
- 9.2. Market Analysis, Insights and Forecast - by Speed Of Delivery
- 9.2.1. Express
- 9.2.2. Non-Express
- 9.3. Market Analysis, Insights and Forecast - by Model
- 9.3.1. Business-to-Business (B2B)
- 9.3.2. Business-to-Consumer (B2C)
- 9.3.3. Consumer-to-Consumer (C2C)
- 9.4. Market Analysis, Insights and Forecast - by Shipment Weight
- 9.4.1. Heavy Weight Shipments
- 9.4.2. Light Weight Shipments
- 9.4.3. Medium Weight Shipments
- 9.5. Market Analysis, Insights and Forecast - by Mode Of Transport
- 9.5.1. Air
- 9.5.2. Road
- 9.5.3. Others
- 9.6. Market Analysis, Insights and Forecast - by End User Industry
- 9.6.1. E-Commerce
- 9.6.2. Financial Services (BFSI)
- 9.6.3. Healthcare
- 9.6.4. Manufacturing
- 9.6.5. Primary Industry
- 9.6.6. Wholesale and Retail Trade (Offline)
- 9.6.7. Others
- 9.1. Market Analysis, Insights and Forecast - by Destination
- 10. Middle East & Africa APAC CEP Market Analysis, Insights and Forecast, 2020-2032
- 10.1. Market Analysis, Insights and Forecast - by Destination
- 10.1.1. Domestic
- 10.1.2. International
- 10.2. Market Analysis, Insights and Forecast - by Speed Of Delivery
- 10.2.1. Express
- 10.2.2. Non-Express
- 10.3. Market Analysis, Insights and Forecast - by Model
- 10.3.1. Business-to-Business (B2B)
- 10.3.2. Business-to-Consumer (B2C)
- 10.3.3. Consumer-to-Consumer (C2C)
- 10.4. Market Analysis, Insights and Forecast - by Shipment Weight
- 10.4.1. Heavy Weight Shipments
- 10.4.2. Light Weight Shipments
- 10.4.3. Medium Weight Shipments
- 10.5. Market Analysis, Insights and Forecast - by Mode Of Transport
- 10.5.1. Air
- 10.5.2. Road
- 10.5.3. Others
- 10.6. Market Analysis, Insights and Forecast - by End User Industry
- 10.6.1. E-Commerce
- 10.6.2. Financial Services (BFSI)
- 10.6.3. Healthcare
- 10.6.4. Manufacturing
- 10.6.5. Primary Industry
- 10.6.6. Wholesale and Retail Trade (Offline)
- 10.6.7. Others
- 10.1. Market Analysis, Insights and Forecast - by Destination
- 11. Asia Pacific APAC CEP Market Analysis, Insights and Forecast, 2020-2032
- 11.1. Market Analysis, Insights and Forecast - by Destination
- 11.1.1. Domestic
- 11.1.2. International
- 11.2. Market Analysis, Insights and Forecast - by Speed Of Delivery
- 11.2.1. Express
- 11.2.2. Non-Express
- 11.3. Market Analysis, Insights and Forecast - by Model
- 11.3.1. Business-to-Business (B2B)
- 11.3.2. Business-to-Consumer (B2C)
- 11.3.3. Consumer-to-Consumer (C2C)
- 11.4. Market Analysis, Insights and Forecast - by Shipment Weight
- 11.4.1. Heavy Weight Shipments
- 11.4.2. Light Weight Shipments
- 11.4.3. Medium Weight Shipments
- 11.5. Market Analysis, Insights and Forecast - by Mode Of Transport
- 11.5.1. Air
- 11.5.2. Road
- 11.5.3. Others
- 11.6. Market Analysis, Insights and Forecast - by End User Industry
- 11.6.1. E-Commerce
- 11.6.2. Financial Services (BFSI)
- 11.6.3. Healthcare
- 11.6.4. Manufacturing
- 11.6.5. Primary Industry
- 11.6.6. Wholesale and Retail Trade (Offline)
- 11.6.7. Others
- 11.1. Market Analysis, Insights and Forecast - by Destination
- 12. Competitive Analysis
- 12.1. Company Profiles
- 12.1.1 China Post
- 12.1.1.1. Company Overview
- 12.1.1.2. Products
- 12.1.1.3. Company Financials
- 12.1.1.4. SWOT Analysis
- 12.1.2 CJ Logistics Corporation
- 12.1.2.1. Company Overview
- 12.1.2.2. Products
- 12.1.2.3. Company Financials
- 12.1.2.4. SWOT Analysis
- 12.1.3 DHL Group
- 12.1.3.1. Company Overview
- 12.1.3.2. Products
- 12.1.3.3. Company Financials
- 12.1.3.4. SWOT Analysis
- 12.1.4 SG Holdings Co Ltd
- 12.1.4.1. Company Overview
- 12.1.4.2. Products
- 12.1.4.3. Company Financials
- 12.1.4.4. SWOT Analysis
- 12.1.5 ZTO Expres
- 12.1.5.1. Company Overview
- 12.1.5.2. Products
- 12.1.5.3. Company Financials
- 12.1.5.4. SWOT Analysis
- 12.1.6 FedEx
- 12.1.6.1. Company Overview
- 12.1.6.2. Products
- 12.1.6.3. Company Financials
- 12.1.6.4. SWOT Analysis
- 12.1.7 United Parcel Service of America Inc (UPS)
- 12.1.7.1. Company Overview
- 12.1.7.2. Products
- 12.1.7.3. Company Financials
- 12.1.7.4. SWOT Analysis
- 12.1.8 YTO Express
- 12.1.8.1. Company Overview
- 12.1.8.2. Products
- 12.1.8.3. Company Financials
- 12.1.8.4. SWOT Analysis
- 12.1.9 Yamato Holdings
- 12.1.9.1. Company Overview
- 12.1.9.2. Products
- 12.1.9.3. Company Financials
- 12.1.9.4. SWOT Analysis
- 12.1.10 SF Express (KEX-SF)
- 12.1.10.1. Company Overview
- 12.1.10.2. Products
- 12.1.10.3. Company Financials
- 12.1.10.4. SWOT Analysis
- 12.1.11 Blue Dart Express
- 12.1.11.1. Company Overview
- 12.1.11.2. Products
- 12.1.11.3. Company Financials
- 12.1.11.4. SWOT Analysis
- 12.1.12 DTDC Express Limited
- 12.1.12.1. Company Overview
- 12.1.12.2. Products
- 12.1.12.3. Company Financials
- 12.1.12.4. SWOT Analysis
- 12.1.13 Toll Group
- 12.1.13.1. Company Overview
- 12.1.13.2. Products
- 12.1.13.3. Company Financials
- 12.1.13.4. SWOT Analysis
- 12.1.14 JWD Group
- 12.1.14.1. Company Overview
- 12.1.14.2. Products
- 12.1.14.3. Company Financials
- 12.1.14.4. SWOT Analysis
- 12.1.1 China Post
- 12.2. Market Entropy
- 12.2.1 Company's Key Areas Served
- 12.2.2 Recent Developments
- 12.3. Company Market Share Analysis 2025
- 12.3.1 Top 5 Companies Market Share Analysis
- 12.3.2 Top 3 Companies Market Share Analysis
- 12.4. List of Potential Customers
- 13. Research Methodology
List of Figures
- Figure 1: Global APAC CEP Market Revenue Breakdown (Million, %) by Region 2025 & 2033
- Figure 2: North America APAC CEP Market Revenue (Million), by Destination 2025 & 2033
- Figure 3: North America APAC CEP Market Revenue Share (%), by Destination 2025 & 2033
- Figure 4: North America APAC CEP Market Revenue (Million), by Speed Of Delivery 2025 & 2033
- Figure 5: North America APAC CEP Market Revenue Share (%), by Speed Of Delivery 2025 & 2033
- Figure 6: North America APAC CEP Market Revenue (Million), by Model 2025 & 2033
- Figure 7: North America APAC CEP Market Revenue Share (%), by Model 2025 & 2033
- Figure 8: North America APAC CEP Market Revenue (Million), by Shipment Weight 2025 & 2033
- Figure 9: North America APAC CEP Market Revenue Share (%), by Shipment Weight 2025 & 2033
- Figure 10: North America APAC CEP Market Revenue (Million), by Mode Of Transport 2025 & 2033
- Figure 11: North America APAC CEP Market Revenue Share (%), by Mode Of Transport 2025 & 2033
- Figure 12: North America APAC CEP Market Revenue (Million), by End User Industry 2025 & 2033
- Figure 13: North America APAC CEP Market Revenue Share (%), by End User Industry 2025 & 2033
- Figure 14: North America APAC CEP Market Revenue (Million), by Country 2025 & 2033
- Figure 15: North America APAC CEP Market Revenue Share (%), by Country 2025 & 2033
- Figure 16: South America APAC CEP Market Revenue (Million), by Destination 2025 & 2033
- Figure 17: South America APAC CEP Market Revenue Share (%), by Destination 2025 & 2033
- Figure 18: South America APAC CEP Market Revenue (Million), by Speed Of Delivery 2025 & 2033
- Figure 19: South America APAC CEP Market Revenue Share (%), by Speed Of Delivery 2025 & 2033
- Figure 20: South America APAC CEP Market Revenue (Million), by Model 2025 & 2033
- Figure 21: South America APAC CEP Market Revenue Share (%), by Model 2025 & 2033
- Figure 22: South America APAC CEP Market Revenue (Million), by Shipment Weight 2025 & 2033
- Figure 23: South America APAC CEP Market Revenue Share (%), by Shipment Weight 2025 & 2033
- Figure 24: South America APAC CEP Market Revenue (Million), by Mode Of Transport 2025 & 2033
- Figure 25: South America APAC CEP Market Revenue Share (%), by Mode Of Transport 2025 & 2033
- Figure 26: South America APAC CEP Market Revenue (Million), by End User Industry 2025 & 2033
- Figure 27: South America APAC CEP Market Revenue Share (%), by End User Industry 2025 & 2033
- Figure 28: South America APAC CEP Market Revenue (Million), by Country 2025 & 2033
- Figure 29: South America APAC CEP Market Revenue Share (%), by Country 2025 & 2033
- Figure 30: Europe APAC CEP Market Revenue (Million), by Destination 2025 & 2033
- Figure 31: Europe APAC CEP Market Revenue Share (%), by Destination 2025 & 2033
- Figure 32: Europe APAC CEP Market Revenue (Million), by Speed Of Delivery 2025 & 2033
- Figure 33: Europe APAC CEP Market Revenue Share (%), by Speed Of Delivery 2025 & 2033
- Figure 34: Europe APAC CEP Market Revenue (Million), by Model 2025 & 2033
- Figure 35: Europe APAC CEP Market Revenue Share (%), by Model 2025 & 2033
- Figure 36: Europe APAC CEP Market Revenue (Million), by Shipment Weight 2025 & 2033
- Figure 37: Europe APAC CEP Market Revenue Share (%), by Shipment Weight 2025 & 2033
- Figure 38: Europe APAC CEP Market Revenue (Million), by Mode Of Transport 2025 & 2033
- Figure 39: Europe APAC CEP Market Revenue Share (%), by Mode Of Transport 2025 & 2033
- Figure 40: Europe APAC CEP Market Revenue (Million), by End User Industry 2025 & 2033
- Figure 41: Europe APAC CEP Market Revenue Share (%), by End User Industry 2025 & 2033
- Figure 42: Europe APAC CEP Market Revenue (Million), by Country 2025 & 2033
- Figure 43: Europe APAC CEP Market Revenue Share (%), by Country 2025 & 2033
- Figure 44: Middle East & Africa APAC CEP Market Revenue (Million), by Destination 2025 & 2033
- Figure 45: Middle East & Africa APAC CEP Market Revenue Share (%), by Destination 2025 & 2033
- Figure 46: Middle East & Africa APAC CEP Market Revenue (Million), by Speed Of Delivery 2025 & 2033
- Figure 47: Middle East & Africa APAC CEP Market Revenue Share (%), by Speed Of Delivery 2025 & 2033
- Figure 48: Middle East & Africa APAC CEP Market Revenue (Million), by Model 2025 & 2033
- Figure 49: Middle East & Africa APAC CEP Market Revenue Share (%), by Model 2025 & 2033
- Figure 50: Middle East & Africa APAC CEP Market Revenue (Million), by Shipment Weight 2025 & 2033
- Figure 51: Middle East & Africa APAC CEP Market Revenue Share (%), by Shipment Weight 2025 & 2033
- Figure 52: Middle East & Africa APAC CEP Market Revenue (Million), by Mode Of Transport 2025 & 2033
- Figure 53: Middle East & Africa APAC CEP Market Revenue Share (%), by Mode Of Transport 2025 & 2033
- Figure 54: Middle East & Africa APAC CEP Market Revenue (Million), by End User Industry 2025 & 2033
- Figure 55: Middle East & Africa APAC CEP Market Revenue Share (%), by End User Industry 2025 & 2033
- Figure 56: Middle East & Africa APAC CEP Market Revenue (Million), by Country 2025 & 2033
- Figure 57: Middle East & Africa APAC CEP Market Revenue Share (%), by Country 2025 & 2033
- Figure 58: Asia Pacific APAC CEP Market Revenue (Million), by Destination 2025 & 2033
- Figure 59: Asia Pacific APAC CEP Market Revenue Share (%), by Destination 2025 & 2033
- Figure 60: Asia Pacific APAC CEP Market Revenue (Million), by Speed Of Delivery 2025 & 2033
- Figure 61: Asia Pacific APAC CEP Market Revenue Share (%), by Speed Of Delivery 2025 & 2033
- Figure 62: Asia Pacific APAC CEP Market Revenue (Million), by Model 2025 & 2033
- Figure 63: Asia Pacific APAC CEP Market Revenue Share (%), by Model 2025 & 2033
- Figure 64: Asia Pacific APAC CEP Market Revenue (Million), by Shipment Weight 2025 & 2033
- Figure 65: Asia Pacific APAC CEP Market Revenue Share (%), by Shipment Weight 2025 & 2033
- Figure 66: Asia Pacific APAC CEP Market Revenue (Million), by Mode Of Transport 2025 & 2033
- Figure 67: Asia Pacific APAC CEP Market Revenue Share (%), by Mode Of Transport 2025 & 2033
- Figure 68: Asia Pacific APAC CEP Market Revenue (Million), by End User Industry 2025 & 2033
- Figure 69: Asia Pacific APAC CEP Market Revenue Share (%), by End User Industry 2025 & 2033
- Figure 70: Asia Pacific APAC CEP Market Revenue (Million), by Country 2025 & 2033
- Figure 71: Asia Pacific APAC CEP Market Revenue Share (%), by Country 2025 & 2033
List of Tables
- Table 1: Global APAC CEP Market Revenue Million Forecast, by Destination 2020 & 2033
- Table 2: Global APAC CEP Market Revenue Million Forecast, by Speed Of Delivery 2020 & 2033
- Table 3: Global APAC CEP Market Revenue Million Forecast, by Model 2020 & 2033
- Table 4: Global APAC CEP Market Revenue Million Forecast, by Shipment Weight 2020 & 2033
- Table 5: Global APAC CEP Market Revenue Million Forecast, by Mode Of Transport 2020 & 2033
- Table 6: Global APAC CEP Market Revenue Million Forecast, by End User Industry 2020 & 2033
- Table 7: Global APAC CEP Market Revenue Million Forecast, by Region 2020 & 2033
- Table 8: Global APAC CEP Market Revenue Million Forecast, by Destination 2020 & 2033
- Table 9: Global APAC CEP Market Revenue Million Forecast, by Speed Of Delivery 2020 & 2033
- Table 10: Global APAC CEP Market Revenue Million Forecast, by Model 2020 & 2033
- Table 11: Global APAC CEP Market Revenue Million Forecast, by Shipment Weight 2020 & 2033
- Table 12: Global APAC CEP Market Revenue Million Forecast, by Mode Of Transport 2020 & 2033
- Table 13: Global APAC CEP Market Revenue Million Forecast, by End User Industry 2020 & 2033
- Table 14: Global APAC CEP Market Revenue Million Forecast, by Country 2020 & 2033
- Table 15: United States APAC CEP Market Revenue (Million) Forecast, by Application 2020 & 2033
- Table 16: Canada APAC CEP Market Revenue (Million) Forecast, by Application 2020 & 2033
- Table 17: Mexico APAC CEP Market Revenue (Million) Forecast, by Application 2020 & 2033
- Table 18: Global APAC CEP Market Revenue Million Forecast, by Destination 2020 & 2033
- Table 19: Global APAC CEP Market Revenue Million Forecast, by Speed Of Delivery 2020 & 2033
- Table 20: Global APAC CEP Market Revenue Million Forecast, by Model 2020 & 2033
- Table 21: Global APAC CEP Market Revenue Million Forecast, by Shipment Weight 2020 & 2033
- Table 22: Global APAC CEP Market Revenue Million Forecast, by Mode Of Transport 2020 & 2033
- Table 23: Global APAC CEP Market Revenue Million Forecast, by End User Industry 2020 & 2033
- Table 24: Global APAC CEP Market Revenue Million Forecast, by Country 2020 & 2033
- Table 25: Brazil APAC CEP Market Revenue (Million) Forecast, by Application 2020 & 2033
- Table 26: Argentina APAC CEP Market Revenue (Million) Forecast, by Application 2020 & 2033
- Table 27: Rest of South America APAC CEP Market Revenue (Million) Forecast, by Application 2020 & 2033
- Table 28: Global APAC CEP Market Revenue Million Forecast, by Destination 2020 & 2033
- Table 29: Global APAC CEP Market Revenue Million Forecast, by Speed Of Delivery 2020 & 2033
- Table 30: Global APAC CEP Market Revenue Million Forecast, by Model 2020 & 2033
- Table 31: Global APAC CEP Market Revenue Million Forecast, by Shipment Weight 2020 & 2033
- Table 32: Global APAC CEP Market Revenue Million Forecast, by Mode Of Transport 2020 & 2033
- Table 33: Global APAC CEP Market Revenue Million Forecast, by End User Industry 2020 & 2033
- Table 34: Global APAC CEP Market Revenue Million Forecast, by Country 2020 & 2033
- Table 35: United Kingdom APAC CEP Market Revenue (Million) Forecast, by Application 2020 & 2033
- Table 36: Germany APAC CEP Market Revenue (Million) Forecast, by Application 2020 & 2033
- Table 37: France APAC CEP Market Revenue (Million) Forecast, by Application 2020 & 2033
- Table 38: Italy APAC CEP Market Revenue (Million) Forecast, by Application 2020 & 2033
- Table 39: Spain APAC CEP Market Revenue (Million) Forecast, by Application 2020 & 2033
- Table 40: Russia APAC CEP Market Revenue (Million) Forecast, by Application 2020 & 2033
- Table 41: Benelux APAC CEP Market Revenue (Million) Forecast, by Application 2020 & 2033
- Table 42: Nordics APAC CEP Market Revenue (Million) Forecast, by Application 2020 & 2033
- Table 43: Rest of Europe APAC CEP Market Revenue (Million) Forecast, by Application 2020 & 2033
- Table 44: Global APAC CEP Market Revenue Million Forecast, by Destination 2020 & 2033
- Table 45: Global APAC CEP Market Revenue Million Forecast, by Speed Of Delivery 2020 & 2033
- Table 46: Global APAC CEP Market Revenue Million Forecast, by Model 2020 & 2033
- Table 47: Global APAC CEP Market Revenue Million Forecast, by Shipment Weight 2020 & 2033
- Table 48: Global APAC CEP Market Revenue Million Forecast, by Mode Of Transport 2020 & 2033
- Table 49: Global APAC CEP Market Revenue Million Forecast, by End User Industry 2020 & 2033
- Table 50: Global APAC CEP Market Revenue Million Forecast, by Country 2020 & 2033
- Table 51: Turkey APAC CEP Market Revenue (Million) Forecast, by Application 2020 & 2033
- Table 52: Israel APAC CEP Market Revenue (Million) Forecast, by Application 2020 & 2033
- Table 53: GCC APAC CEP Market Revenue (Million) Forecast, by Application 2020 & 2033
- Table 54: North Africa APAC CEP Market Revenue (Million) Forecast, by Application 2020 & 2033
- Table 55: South Africa APAC CEP Market Revenue (Million) Forecast, by Application 2020 & 2033
- Table 56: Rest of Middle East & Africa APAC CEP Market Revenue (Million) Forecast, by Application 2020 & 2033
- Table 57: Global APAC CEP Market Revenue Million Forecast, by Destination 2020 & 2033
- Table 58: Global APAC CEP Market Revenue Million Forecast, by Speed Of Delivery 2020 & 2033
- Table 59: Global APAC CEP Market Revenue Million Forecast, by Model 2020 & 2033
- Table 60: Global APAC CEP Market Revenue Million Forecast, by Shipment Weight 2020 & 2033
- Table 61: Global APAC CEP Market Revenue Million Forecast, by Mode Of Transport 2020 & 2033
- Table 62: Global APAC CEP Market Revenue Million Forecast, by End User Industry 2020 & 2033
- Table 63: Global APAC CEP Market Revenue Million Forecast, by Country 2020 & 2033
- Table 64: China APAC CEP Market Revenue (Million) Forecast, by Application 2020 & 2033
- Table 65: India APAC CEP Market Revenue (Million) Forecast, by Application 2020 & 2033
- Table 66: Japan APAC CEP Market Revenue (Million) Forecast, by Application 2020 & 2033
- Table 67: South Korea APAC CEP Market Revenue (Million) Forecast, by Application 2020 & 2033
- Table 68: ASEAN APAC CEP Market Revenue (Million) Forecast, by Application 2020 & 2033
- Table 69: Oceania APAC CEP Market Revenue (Million) Forecast, by Application 2020 & 2033
- Table 70: Rest of Asia Pacific APAC CEP Market Revenue (Million) Forecast, by Application 2020 & 2033
Frequently Asked Questions
1. What is the projected Compound Annual Growth Rate (CAGR) of the APAC CEP Market?
The projected CAGR is approximately 6.64%.
2. Which companies are prominent players in the APAC CEP Market?
Key companies in the market include China Post, CJ Logistics Corporation, DHL Group, SG Holdings Co Ltd, ZTO Expres, FedEx, United Parcel Service of America Inc (UPS), YTO Express, Yamato Holdings, SF Express (KEX-SF), Blue Dart Express, DTDC Express Limited, Toll Group, JWD Group.
3. What are the main segments of the APAC CEP Market?
The market segments include Destination, Speed Of Delivery, Model, Shipment Weight, Mode Of Transport, End User Industry.
4. Can you provide details about the market size?
The market size is estimated to be USD XX Million as of 2022.
5. What are some drivers contributing to market growth?
E-commerce Fueling the Growth of 3PL Market.
6. What are the notable trends driving market growth?
OTHER KEY INDUSTRY TRENDS COVERED IN THE REPORT.
7. Are there any restraints impacting market growth?
Slow Infrastructure Development.
8. Can you provide examples of recent developments in the market?
June 2023: China Post launched its first integrated indoor and outdoor “Robot Plus” AI delivery solution in China. The intelligent delivery solution relies on a combination of unmanned vehicles outdoors and robots indoors, constructing an integrated indoor and outdoor unmanned distribution mode and developing a last-mile logistics network with AI transport capacity sharing.April 2023: China Post and the Automobile Consumption Financial Center of Ping An Bank Co. Ltd launched an intelligent archives service center in Guangdong to promote the service integration of auto finance and express and logistics businesses.March 2023: Colowide MD Co. Ltd, which oversees merchandising for the Colowide Group, and Yamato Transport Co. Ltd entered an agreement. The two companies will promote the visualization and optimization of the entire supply chain of Colowide Group, which operates multiple brands such as Gyu-Kaku, Kappa Sushi, and OOTOYA.
9. What pricing options are available for accessing the report?
Pricing options include single-user, multi-user, and enterprise licenses priced at USD 3800, USD 4500, and USD 5800 respectively.
10. Is the market size provided in terms of value or volume?
The market size is provided in terms of value, measured in Million.
11. Are there any specific market keywords associated with the report?
Yes, the market keyword associated with the report is "APAC CEP Market," which aids in identifying and referencing the specific market segment covered.
12. How do I determine which pricing option suits my needs best?
The pricing options vary based on user requirements and access needs. Individual users may opt for single-user licenses, while businesses requiring broader access may choose multi-user or enterprise licenses for cost-effective access to the report.
13. Are there any additional resources or data provided in the APAC CEP Market report?
While the report offers comprehensive insights, it's advisable to review the specific contents or supplementary materials provided to ascertain if additional resources or data are available.
14. How can I stay updated on further developments or reports in the APAC CEP Market?
To stay informed about further developments, trends, and reports in the APAC CEP Market, consider subscribing to industry newsletters, following relevant companies and organizations, or regularly checking reputable industry news sources and publications.
Methodology
Step 1 - Identification of Relevant Samples Size from Population Database


Step 2 - Approaches for Defining Global Market Size (Value, Volume* & Price*)

Note*: In applicable scenarios
Step 3 - Data Sources
Primary Research
- Web Analytics
- Survey Reports
- Research Institute
- Latest Research Reports
- Opinion Leaders
Secondary Research
- Annual Reports
- White Paper
- Latest Press Release
- Industry Association
- Paid Database
- Investor Presentations

Step 4 - Data Triangulation
Involves using different sources of information in order to increase the validity of a study
These sources are likely to be stakeholders in a program - participants, other researchers, program staff, other community members, and so on.
Then we put all data in single framework & apply various statistical tools to find out the dynamic on the market.
During the analysis stage, feedback from the stakeholder groups would be compared to determine areas of agreement as well as areas of divergence