
Key Insights
The Asia-Pacific (APAC) electric bus market is experiencing robust growth, driven by government initiatives promoting sustainable transportation, increasing environmental concerns, and the declining cost of electric vehicle (EV) technology. The region's substantial population density and expanding urban areas create a significant demand for efficient and eco-friendly public transportation solutions. China, India, and other Southeast Asian nations are leading this charge, with substantial investments in EV infrastructure and supportive policies incentivizing electric bus adoption. Key market drivers include stringent emission regulations, improving battery technology resulting in extended range and faster charging times, and the rising operational cost-effectiveness of electric buses compared to diesel counterparts. The market segmentation reveals a strong preference for battery electric buses over plug-in hybrid variants, reflecting a clear push toward zero-emission transportation. While the initial investment cost remains a restraint for some fleet operators, government subsidies and long-term operational savings are mitigating this challenge. Furthermore, technological advancements in areas like battery management systems and fast-charging infrastructure are further accelerating market expansion. The diverse range of manufacturers, including both established global players and regional companies, fosters competition and innovation within the APAC electric bus sector, ensuring a dynamic and rapidly evolving market landscape.
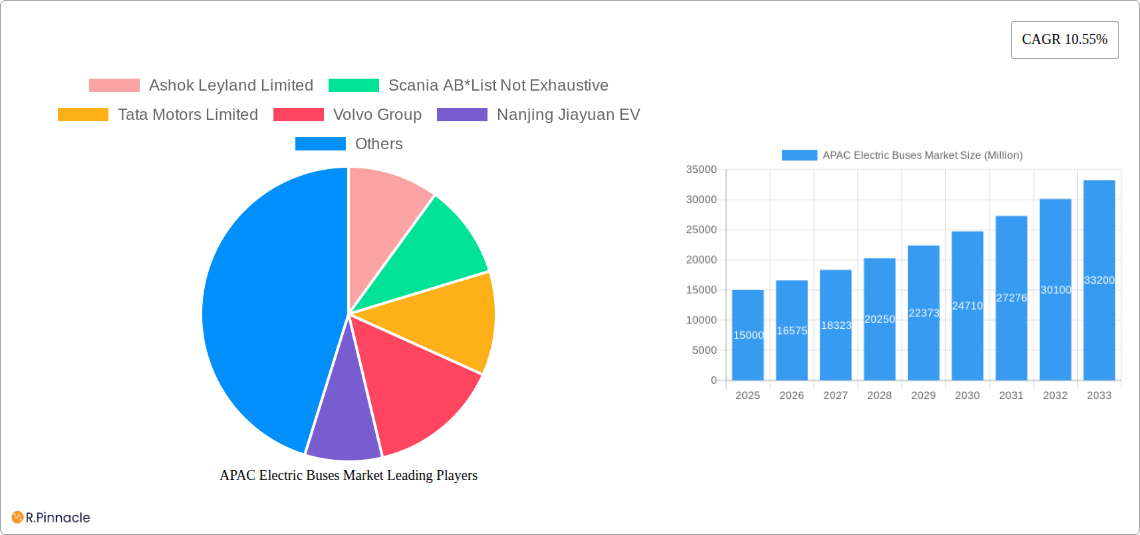
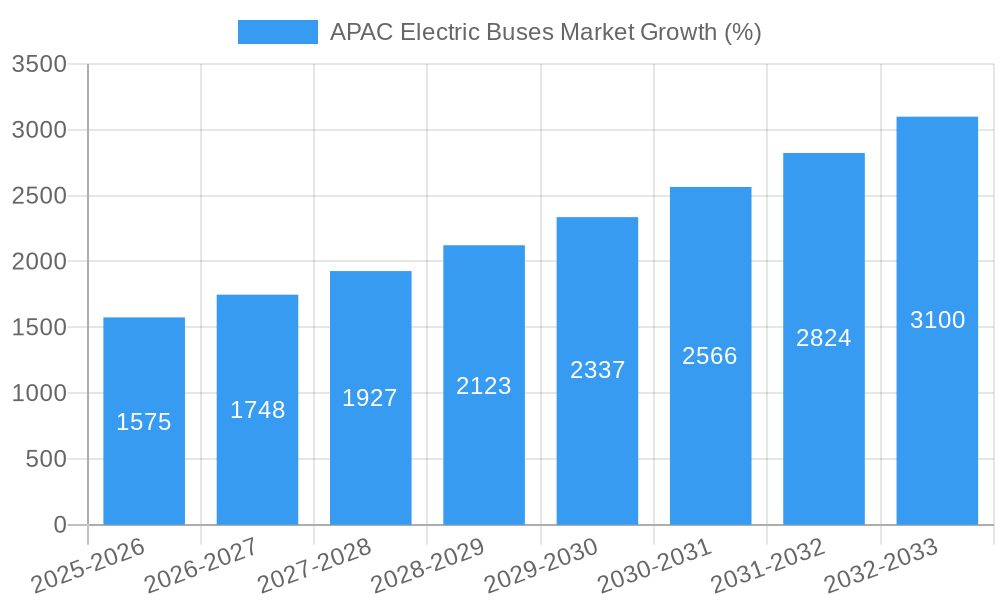
The forecast period (2025-2033) projects continued growth, fueled by expanding charging infrastructure, increasing consumer awareness of environmental sustainability, and ongoing technological improvements. The market is segmented by vehicle type (Battery Electric Bus, Plug-in Hybrid Electric Bus), power source (DC/AC Inverter, DC/DC Converter, DC/DC Boost Converter, E-Motor, AC/DC Charger, Motor Controller), consumer (Government, Fleet Operators), and country (China, India, Japan, South Korea, Rest of Asia-Pacific). While China currently holds the largest market share, significant growth potential exists in India and other rapidly developing economies within the region. The sustained high CAGR of 10.55% suggests a significant expansion of the APAC electric bus market over the forecast period, transforming urban transportation and contributing to a greener future. This growth is likely to be further fueled by collaborative efforts between governments, manufacturers, and private investors, driving innovation and wider adoption of electric bus technology.
APAC Electric Buses Market: A Comprehensive Report (2019-2033)
This in-depth report provides a comprehensive analysis of the Asia-Pacific (APAC) electric buses market, covering the period from 2019 to 2033. It delves into market dynamics, growth drivers, challenges, and opportunities, offering valuable insights for industry professionals, investors, and policymakers. The report leverages extensive data analysis, including market size estimations and forecasts (in Millions), to present a clear picture of the current landscape and future trajectory of this rapidly evolving sector.
APAC Electric Buses Market Structure & Innovation Trends
The APAC electric bus market exhibits a dynamic interplay of established players and emerging innovators. Market concentration varies significantly across countries, with China holding a dominant share. Innovation is fueled by government incentives promoting sustainable transportation, stringent emission regulations, and the increasing adoption of advanced battery technologies. The regulatory framework plays a crucial role, shaping market entry, product standards, and investment decisions. Product substitutes, primarily traditional diesel buses, face increasing pressure due to rising fuel costs and environmental concerns. End-user demographics are shifting towards government agencies and fleet operators prioritizing eco-friendly options. Mergers and acquisitions (M&A) activity is significant, with deal values exceeding xx Million in recent years, reflecting industry consolidation and expansion strategies.
- Market Share: China holds the largest market share, followed by India and other countries. Precise figures vary across segments and years; the report provides detailed breakdowns.
- M&A Activity: Significant M&A activity observed with xx Million in total deal value in the last three years (report provides detailed transaction data).
- Innovation Drivers: Government subsidies, stringent emission norms, technological advancements in battery technology and charging infrastructure.
- Regulatory Frameworks: Vary across countries impacting market access and standards.
APAC Electric Buses Market Dynamics & Trends
The APAC electric bus market is experiencing robust growth, driven by several key factors. Government initiatives promoting electric mobility, coupled with rising environmental awareness, are accelerating market penetration. Technological advancements in battery technology, charging infrastructure, and vehicle design are continuously improving efficiency and reducing costs. Consumer preferences are shifting towards electric buses due to their environmental benefits and lower operating costs. Competitive dynamics are intense, with both domestic and international players vying for market share. This leads to innovation and price competition, benefiting consumers. The Compound Annual Growth Rate (CAGR) during the forecast period (2025-2033) is projected to be xx%, with market penetration rates expected to reach xx% by 2033. Specific country-level analyses and segment-specific CAGRs are detailed within the report.
Dominant Regions & Segments in APAC Electric Buses Market
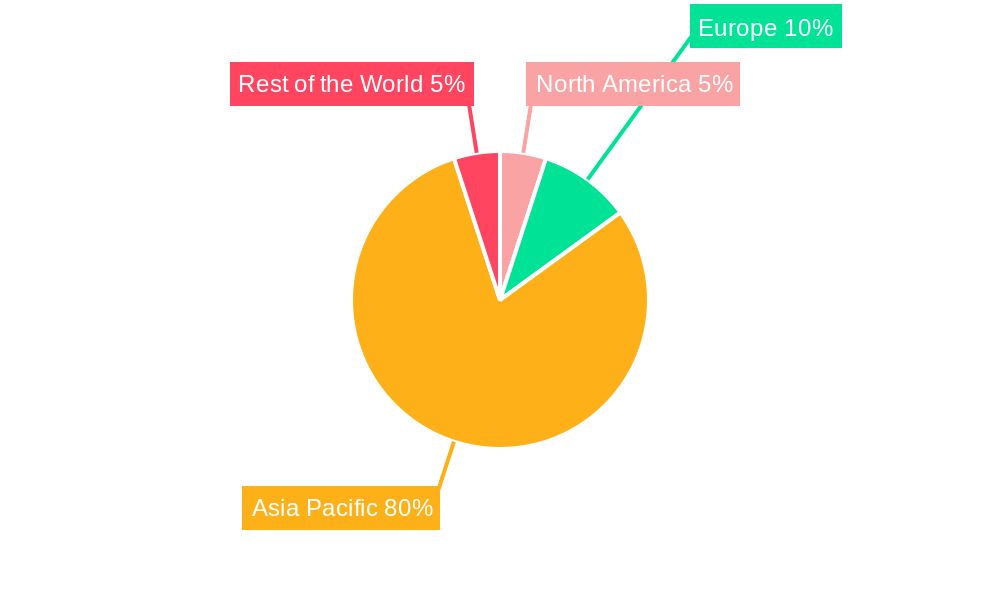
China dominates the APAC electric bus market, primarily due to its massive scale of public transport, strong government support for electric vehicles, and a well-established domestic manufacturing base. India is experiencing rapid growth, driven by increasing urbanization and government initiatives to improve air quality. Other key markets include Japan and South Korea, where electric bus adoption is steadily growing.
By Vehicle Type: Battery Electric Buses (BEBs) constitute the largest segment, driven by technological advancements and improved battery performance. Plug-in Hybrid Electric Buses (PHEBs) represent a smaller but growing segment.
By Power Source: DC/AC Inverters hold the largest market share among power sources, but other technologies such as DC/DC converters and e-motors are seeing adoption growth.
By Consumer: Governments account for the largest share of electric bus purchases, followed by fleet operators.
Key Drivers by Country:
- China: Strong government support, established domestic manufacturing base, massive public transportation network.
- India: Government initiatives focusing on clean transport, large urban population, and rising environmental concerns.
- Japan: Focus on technological advancement and energy efficiency, supportive government policies.
- South Korea: Investment in advanced technologies, supportive government policies and strong public transport systems.
APAC Electric Buses Market Product Innovations
Recent product innovations focus on increasing battery capacity, improving charging infrastructure, enhancing safety features, and optimizing vehicle design for better energy efficiency and passenger comfort. The market is witnessing the introduction of technologically advanced electric buses featuring innovative battery management systems, advanced driver-assistance systems, and connected technologies. These advancements are enhancing the overall appeal and market competitiveness of electric buses within the APAC region.
Report Scope & Segmentation Analysis
This report segments the APAC electric bus market by vehicle type (Battery Electric Bus, Plug-in Hybrid Electric Bus), power source (DC/AC Inverter, DC/DC Converter, DC/DC Boost Converter, E-Motor, AC/DC Charger, Motor Controller), consumer (Government, Fleet Operators), and country (China, India, Japan, South Korea, Rest of Asia-Pacific). Each segment's growth projection, market size, and competitive dynamics are meticulously analyzed, providing a granular understanding of the market landscape. The report provides detailed estimations and forecasts (in Millions) for each segment throughout the study period (2019-2033).
Key Drivers of APAC Electric Buses Market Growth
The APAC electric bus market's growth is primarily propelled by supportive government policies, including subsidies and tax incentives to encourage adoption. Stringent emission regulations are pushing the transition away from diesel buses. Technological improvements in battery technology are improving range and reducing charging times, while decreasing costs make electric buses increasingly competitive. The rising environmental awareness among consumers and businesses is further supporting this shift.
Challenges in the APAC Electric Buses Market Sector
Challenges include the high initial cost of electric buses compared to diesel counterparts, concerns regarding battery life and charging infrastructure limitations. Supply chain disruptions and the availability of critical raw materials for battery manufacturing are additional obstacles. Furthermore, variations in government policies and regulatory frameworks across different APAC countries present complexity for manufacturers and investors.
Emerging Opportunities in APAC Electric Buses Market
Significant opportunities exist in expanding charging infrastructure, particularly in less developed regions. The development of innovative battery technologies and advancements in autonomous driving systems offer immense potential. Moreover, the growing demand for electric buses in rapidly urbanizing areas and the increasing focus on integrating electric buses with smart city initiatives represent substantial avenues for growth.
Leading Players in the APAC Electric Buses Market Market
- Ashok Leyland Limited
- Scania AB
- Tata Motors Limited
- Volvo Group
- Nanjing Jiayuan EV
- King Long United Automotive Co Limited
- Zhongtong Bus Holding Co Limited
- BYD Auto Co Limited
- Anhui Ankai Automobile Industries Co Limited
Key Developments in APAC Electric Buses Market Industry
- August 2022: Ashok Leyland's Switch Mobility secures a 200-unit electric double-decker bus order from BEST in Mumbai.
- August 2022: CAUSIS E-Mobility secures a 700-unit electric bus order from BEST in India.
- May 2022: Olectra Greentech secures a 2100-unit electric bus order from BEST in Mumbai, worth INR 3675 Million.
- August 2022: Switch Mobility wins a 5000-unit electric bus order from Chalo.
- July 2022: Tata Motors wins a 1500-unit electric bus order from Delhi Transport Corporation (DTC).
- August 2022: Volvo Eicher forms VE Electro Mobility to expand in the electric bus market.
- January 2022: CRRC Electric delivers 30 electric buses to Seoul, South Korea.
- February 2022: Toyota, Isuzu, and Hino announce a joint electric bus launch in Japan by 2024.
Future Outlook for APAC Electric Buses Market Market
The future of the APAC electric bus market looks promising, driven by sustained government support, technological advancements, and rising environmental awareness. The market is poised for significant expansion as more cities adopt electric buses as a key component of their sustainable transportation strategies. Strategic partnerships and collaborations among manufacturers, technology providers, and governments will be critical for accelerating market growth and realizing the full potential of this sector.
APAC Electric Buses Market Segmentation
-
1. Vehicle Type
- 1.1. Battery Electric Bus
- 1.2. Plug-in Hybrid Electric Bus
-
2. Power Source
- 2.1. DC/AC Inverter
- 2.2. DC/DC Converter
- 2.3. DC/DC Boost Converter
- 2.4. E-Motor
- 2.5. AC/DC Charger
- 2.6. Motor Controller
-
3. Consumer
- 3.1. Government
- 3.2. Fleet Operators
APAC Electric Buses Market Segmentation By Geography
-
1. North America
- 1.1. United States
- 1.2. Canada
- 1.3. Mexico
-
2. South America
- 2.1. Brazil
- 2.2. Argentina
- 2.3. Rest of South America
-
3. Europe
- 3.1. United Kingdom
- 3.2. Germany
- 3.3. France
- 3.4. Italy
- 3.5. Spain
- 3.6. Russia
- 3.7. Benelux
- 3.8. Nordics
- 3.9. Rest of Europe
-
4. Middle East & Africa
- 4.1. Turkey
- 4.2. Israel
- 4.3. GCC
- 4.4. North Africa
- 4.5. South Africa
- 4.6. Rest of Middle East & Africa
-
5. Asia Pacific
- 5.1. China
- 5.2. India
- 5.3. Japan
- 5.4. South Korea
- 5.5. ASEAN
- 5.6. Oceania
- 5.7. Rest of Asia Pacific
APAC Electric Buses Market REPORT HIGHLIGHTS
| Aspects | Details |
|---|---|
| Study Period | 2019-2033 |
| Base Year | 2024 |
| Estimated Year | 2025 |
| Forecast Period | 2025-2033 |
| Historical Period | 2019-2024 |
| Growth Rate | CAGR of 10.55% from 2019-2033 |
| Segmentation |
|
Table of Contents
- 1. Introduction
- 1.1. Research Scope
- 1.2. Market Segmentation
- 1.3. Research Methodology
- 1.4. Definitions and Assumptions
- 2. Executive Summary
- 2.1. Introduction
- 3. Market Dynamics
- 3.1. Introduction
- 3.2. Market Drivers
- 3.2.1. Growing Travel and Tourism Industry is Driving the Car Rental Market
- 3.3. Market Restrains
- 3.3.1. Increasing Popularity of Ride-Sharing Services Pose Challenges for the Conventional Car Rental Market
- 3.4. Market Trends
- 3.4.1. Battery Electric Bus Segment to Play Prominent Role in the Market
- 4. Market Factor Analysis
- 4.1. Porters Five Forces
- 4.2. Supply/Value Chain
- 4.3. PESTEL analysis
- 4.4. Market Entropy
- 4.5. Patent/Trademark Analysis
- 5. Global APAC Electric Buses Market Analysis, Insights and Forecast, 2019-2031
- 5.1. Market Analysis, Insights and Forecast - by Vehicle Type
- 5.1.1. Battery Electric Bus
- 5.1.2. Plug-in Hybrid Electric Bus
- 5.2. Market Analysis, Insights and Forecast - by Power Source
- 5.2.1. DC/AC Inverter
- 5.2.2. DC/DC Converter
- 5.2.3. DC/DC Boost Converter
- 5.2.4. E-Motor
- 5.2.5. AC/DC Charger
- 5.2.6. Motor Controller
- 5.3. Market Analysis, Insights and Forecast - by Consumer
- 5.3.1. Government
- 5.3.2. Fleet Operators
- 5.4. Market Analysis, Insights and Forecast - by Region
- 5.4.1. North America
- 5.4.2. South America
- 5.4.3. Europe
- 5.4.4. Middle East & Africa
- 5.4.5. Asia Pacific
- 5.1. Market Analysis, Insights and Forecast - by Vehicle Type
- 6. North America APAC Electric Buses Market Analysis, Insights and Forecast, 2019-2031
- 6.1. Market Analysis, Insights and Forecast - by Vehicle Type
- 6.1.1. Battery Electric Bus
- 6.1.2. Plug-in Hybrid Electric Bus
- 6.2. Market Analysis, Insights and Forecast - by Power Source
- 6.2.1. DC/AC Inverter
- 6.2.2. DC/DC Converter
- 6.2.3. DC/DC Boost Converter
- 6.2.4. E-Motor
- 6.2.5. AC/DC Charger
- 6.2.6. Motor Controller
- 6.3. Market Analysis, Insights and Forecast - by Consumer
- 6.3.1. Government
- 6.3.2. Fleet Operators
- 6.1. Market Analysis, Insights and Forecast - by Vehicle Type
- 7. South America APAC Electric Buses Market Analysis, Insights and Forecast, 2019-2031
- 7.1. Market Analysis, Insights and Forecast - by Vehicle Type
- 7.1.1. Battery Electric Bus
- 7.1.2. Plug-in Hybrid Electric Bus
- 7.2. Market Analysis, Insights and Forecast - by Power Source
- 7.2.1. DC/AC Inverter
- 7.2.2. DC/DC Converter
- 7.2.3. DC/DC Boost Converter
- 7.2.4. E-Motor
- 7.2.5. AC/DC Charger
- 7.2.6. Motor Controller
- 7.3. Market Analysis, Insights and Forecast - by Consumer
- 7.3.1. Government
- 7.3.2. Fleet Operators
- 7.1. Market Analysis, Insights and Forecast - by Vehicle Type
- 8. Europe APAC Electric Buses Market Analysis, Insights and Forecast, 2019-2031
- 8.1. Market Analysis, Insights and Forecast - by Vehicle Type
- 8.1.1. Battery Electric Bus
- 8.1.2. Plug-in Hybrid Electric Bus
- 8.2. Market Analysis, Insights and Forecast - by Power Source
- 8.2.1. DC/AC Inverter
- 8.2.2. DC/DC Converter
- 8.2.3. DC/DC Boost Converter
- 8.2.4. E-Motor
- 8.2.5. AC/DC Charger
- 8.2.6. Motor Controller
- 8.3. Market Analysis, Insights and Forecast - by Consumer
- 8.3.1. Government
- 8.3.2. Fleet Operators
- 8.1. Market Analysis, Insights and Forecast - by Vehicle Type
- 9. Middle East & Africa APAC Electric Buses Market Analysis, Insights and Forecast, 2019-2031
- 9.1. Market Analysis, Insights and Forecast - by Vehicle Type
- 9.1.1. Battery Electric Bus
- 9.1.2. Plug-in Hybrid Electric Bus
- 9.2. Market Analysis, Insights and Forecast - by Power Source
- 9.2.1. DC/AC Inverter
- 9.2.2. DC/DC Converter
- 9.2.3. DC/DC Boost Converter
- 9.2.4. E-Motor
- 9.2.5. AC/DC Charger
- 9.2.6. Motor Controller
- 9.3. Market Analysis, Insights and Forecast - by Consumer
- 9.3.1. Government
- 9.3.2. Fleet Operators
- 9.1. Market Analysis, Insights and Forecast - by Vehicle Type
- 10. Asia Pacific APAC Electric Buses Market Analysis, Insights and Forecast, 2019-2031
- 10.1. Market Analysis, Insights and Forecast - by Vehicle Type
- 10.1.1. Battery Electric Bus
- 10.1.2. Plug-in Hybrid Electric Bus
- 10.2. Market Analysis, Insights and Forecast - by Power Source
- 10.2.1. DC/AC Inverter
- 10.2.2. DC/DC Converter
- 10.2.3. DC/DC Boost Converter
- 10.2.4. E-Motor
- 10.2.5. AC/DC Charger
- 10.2.6. Motor Controller
- 10.3. Market Analysis, Insights and Forecast - by Consumer
- 10.3.1. Government
- 10.3.2. Fleet Operators
- 10.1. Market Analysis, Insights and Forecast - by Vehicle Type
- 11. North America APAC Electric Buses Market Analysis, Insights and Forecast, 2019-2031
- 11.1. Market Analysis, Insights and Forecast - By Country/Sub-region
- 11.1.1 United States
- 11.1.2 Canada
- 11.1.3 Rest of North America
- 12. Europe APAC Electric Buses Market Analysis, Insights and Forecast, 2019-2031
- 12.1. Market Analysis, Insights and Forecast - By Country/Sub-region
- 12.1.1 Germany
- 12.1.2 United Kingdom
- 12.1.3 France
- 12.1.4 Rest of Europe
- 13. Asia Pacific APAC Electric Buses Market Analysis, Insights and Forecast, 2019-2031
- 13.1. Market Analysis, Insights and Forecast - By Country/Sub-region
- 13.1.1 India
- 13.1.2 China
- 13.1.3 Japan
- 13.1.4 South Korea
- 13.1.5 Rest of Asia Pacific
- 14. Rest of the World APAC Electric Buses Market Analysis, Insights and Forecast, 2019-2031
- 14.1. Market Analysis, Insights and Forecast - By Country/Sub-region
- 14.1.1 Brazil
- 14.1.2 Mexico
- 14.1.3 United Arab Emirates
- 14.1.4 Other Countries
- 15. Competitive Analysis
- 15.1. Global Market Share Analysis 2024
- 15.2. Company Profiles
- 15.2.1 Ashok Leyland Limited
- 15.2.1.1. Overview
- 15.2.1.2. Products
- 15.2.1.3. SWOT Analysis
- 15.2.1.4. Recent Developments
- 15.2.1.5. Financials (Based on Availability)
- 15.2.2 Scania AB*List Not Exhaustive
- 15.2.2.1. Overview
- 15.2.2.2. Products
- 15.2.2.3. SWOT Analysis
- 15.2.2.4. Recent Developments
- 15.2.2.5. Financials (Based on Availability)
- 15.2.3 Tata Motors Limited
- 15.2.3.1. Overview
- 15.2.3.2. Products
- 15.2.3.3. SWOT Analysis
- 15.2.3.4. Recent Developments
- 15.2.3.5. Financials (Based on Availability)
- 15.2.4 Volvo Group
- 15.2.4.1. Overview
- 15.2.4.2. Products
- 15.2.4.3. SWOT Analysis
- 15.2.4.4. Recent Developments
- 15.2.4.5. Financials (Based on Availability)
- 15.2.5 Nanjing Jiayuan EV
- 15.2.5.1. Overview
- 15.2.5.2. Products
- 15.2.5.3. SWOT Analysis
- 15.2.5.4. Recent Developments
- 15.2.5.5. Financials (Based on Availability)
- 15.2.6 King Long United Automotive Co Limited
- 15.2.6.1. Overview
- 15.2.6.2. Products
- 15.2.6.3. SWOT Analysis
- 15.2.6.4. Recent Developments
- 15.2.6.5. Financials (Based on Availability)
- 15.2.7 Zhongtong Bus Holding Co Limited
- 15.2.7.1. Overview
- 15.2.7.2. Products
- 15.2.7.3. SWOT Analysis
- 15.2.7.4. Recent Developments
- 15.2.7.5. Financials (Based on Availability)
- 15.2.8 BYD Auto Co Limited
- 15.2.8.1. Overview
- 15.2.8.2. Products
- 15.2.8.3. SWOT Analysis
- 15.2.8.4. Recent Developments
- 15.2.8.5. Financials (Based on Availability)
- 15.2.9 Anhui Ankai Automobile Industries Co Limited
- 15.2.9.1. Overview
- 15.2.9.2. Products
- 15.2.9.3. SWOT Analysis
- 15.2.9.4. Recent Developments
- 15.2.9.5. Financials (Based on Availability)
- 15.2.1 Ashok Leyland Limited
List of Figures
- Figure 1: Global APAC Electric Buses Market Revenue Breakdown (Million, %) by Region 2024 & 2032
- Figure 2: North America APAC Electric Buses Market Revenue (Million), by Country 2024 & 2032
- Figure 3: North America APAC Electric Buses Market Revenue Share (%), by Country 2024 & 2032
- Figure 4: Europe APAC Electric Buses Market Revenue (Million), by Country 2024 & 2032
- Figure 5: Europe APAC Electric Buses Market Revenue Share (%), by Country 2024 & 2032
- Figure 6: Asia Pacific APAC Electric Buses Market Revenue (Million), by Country 2024 & 2032
- Figure 7: Asia Pacific APAC Electric Buses Market Revenue Share (%), by Country 2024 & 2032
- Figure 8: Rest of the World APAC Electric Buses Market Revenue (Million), by Country 2024 & 2032
- Figure 9: Rest of the World APAC Electric Buses Market Revenue Share (%), by Country 2024 & 2032
- Figure 10: North America APAC Electric Buses Market Revenue (Million), by Vehicle Type 2024 & 2032
- Figure 11: North America APAC Electric Buses Market Revenue Share (%), by Vehicle Type 2024 & 2032
- Figure 12: North America APAC Electric Buses Market Revenue (Million), by Power Source 2024 & 2032
- Figure 13: North America APAC Electric Buses Market Revenue Share (%), by Power Source 2024 & 2032
- Figure 14: North America APAC Electric Buses Market Revenue (Million), by Consumer 2024 & 2032
- Figure 15: North America APAC Electric Buses Market Revenue Share (%), by Consumer 2024 & 2032
- Figure 16: North America APAC Electric Buses Market Revenue (Million), by Country 2024 & 2032
- Figure 17: North America APAC Electric Buses Market Revenue Share (%), by Country 2024 & 2032
- Figure 18: South America APAC Electric Buses Market Revenue (Million), by Vehicle Type 2024 & 2032
- Figure 19: South America APAC Electric Buses Market Revenue Share (%), by Vehicle Type 2024 & 2032
- Figure 20: South America APAC Electric Buses Market Revenue (Million), by Power Source 2024 & 2032
- Figure 21: South America APAC Electric Buses Market Revenue Share (%), by Power Source 2024 & 2032
- Figure 22: South America APAC Electric Buses Market Revenue (Million), by Consumer 2024 & 2032
- Figure 23: South America APAC Electric Buses Market Revenue Share (%), by Consumer 2024 & 2032
- Figure 24: South America APAC Electric Buses Market Revenue (Million), by Country 2024 & 2032
- Figure 25: South America APAC Electric Buses Market Revenue Share (%), by Country 2024 & 2032
- Figure 26: Europe APAC Electric Buses Market Revenue (Million), by Vehicle Type 2024 & 2032
- Figure 27: Europe APAC Electric Buses Market Revenue Share (%), by Vehicle Type 2024 & 2032
- Figure 28: Europe APAC Electric Buses Market Revenue (Million), by Power Source 2024 & 2032
- Figure 29: Europe APAC Electric Buses Market Revenue Share (%), by Power Source 2024 & 2032
- Figure 30: Europe APAC Electric Buses Market Revenue (Million), by Consumer 2024 & 2032
- Figure 31: Europe APAC Electric Buses Market Revenue Share (%), by Consumer 2024 & 2032
- Figure 32: Europe APAC Electric Buses Market Revenue (Million), by Country 2024 & 2032
- Figure 33: Europe APAC Electric Buses Market Revenue Share (%), by Country 2024 & 2032
- Figure 34: Middle East & Africa APAC Electric Buses Market Revenue (Million), by Vehicle Type 2024 & 2032
- Figure 35: Middle East & Africa APAC Electric Buses Market Revenue Share (%), by Vehicle Type 2024 & 2032
- Figure 36: Middle East & Africa APAC Electric Buses Market Revenue (Million), by Power Source 2024 & 2032
- Figure 37: Middle East & Africa APAC Electric Buses Market Revenue Share (%), by Power Source 2024 & 2032
- Figure 38: Middle East & Africa APAC Electric Buses Market Revenue (Million), by Consumer 2024 & 2032
- Figure 39: Middle East & Africa APAC Electric Buses Market Revenue Share (%), by Consumer 2024 & 2032
- Figure 40: Middle East & Africa APAC Electric Buses Market Revenue (Million), by Country 2024 & 2032
- Figure 41: Middle East & Africa APAC Electric Buses Market Revenue Share (%), by Country 2024 & 2032
- Figure 42: Asia Pacific APAC Electric Buses Market Revenue (Million), by Vehicle Type 2024 & 2032
- Figure 43: Asia Pacific APAC Electric Buses Market Revenue Share (%), by Vehicle Type 2024 & 2032
- Figure 44: Asia Pacific APAC Electric Buses Market Revenue (Million), by Power Source 2024 & 2032
- Figure 45: Asia Pacific APAC Electric Buses Market Revenue Share (%), by Power Source 2024 & 2032
- Figure 46: Asia Pacific APAC Electric Buses Market Revenue (Million), by Consumer 2024 & 2032
- Figure 47: Asia Pacific APAC Electric Buses Market Revenue Share (%), by Consumer 2024 & 2032
- Figure 48: Asia Pacific APAC Electric Buses Market Revenue (Million), by Country 2024 & 2032
- Figure 49: Asia Pacific APAC Electric Buses Market Revenue Share (%), by Country 2024 & 2032
List of Tables
- Table 1: Global APAC Electric Buses Market Revenue Million Forecast, by Region 2019 & 2032
- Table 2: Global APAC Electric Buses Market Revenue Million Forecast, by Vehicle Type 2019 & 2032
- Table 3: Global APAC Electric Buses Market Revenue Million Forecast, by Power Source 2019 & 2032
- Table 4: Global APAC Electric Buses Market Revenue Million Forecast, by Consumer 2019 & 2032
- Table 5: Global APAC Electric Buses Market Revenue Million Forecast, by Region 2019 & 2032
- Table 6: Global APAC Electric Buses Market Revenue Million Forecast, by Country 2019 & 2032
- Table 7: United States APAC Electric Buses Market Revenue (Million) Forecast, by Application 2019 & 2032
- Table 8: Canada APAC Electric Buses Market Revenue (Million) Forecast, by Application 2019 & 2032
- Table 9: Rest of North America APAC Electric Buses Market Revenue (Million) Forecast, by Application 2019 & 2032
- Table 10: Global APAC Electric Buses Market Revenue Million Forecast, by Country 2019 & 2032
- Table 11: Germany APAC Electric Buses Market Revenue (Million) Forecast, by Application 2019 & 2032
- Table 12: United Kingdom APAC Electric Buses Market Revenue (Million) Forecast, by Application 2019 & 2032
- Table 13: France APAC Electric Buses Market Revenue (Million) Forecast, by Application 2019 & 2032
- Table 14: Rest of Europe APAC Electric Buses Market Revenue (Million) Forecast, by Application 2019 & 2032
- Table 15: Global APAC Electric Buses Market Revenue Million Forecast, by Country 2019 & 2032
- Table 16: India APAC Electric Buses Market Revenue (Million) Forecast, by Application 2019 & 2032
- Table 17: China APAC Electric Buses Market Revenue (Million) Forecast, by Application 2019 & 2032
- Table 18: Japan APAC Electric Buses Market Revenue (Million) Forecast, by Application 2019 & 2032
- Table 19: South Korea APAC Electric Buses Market Revenue (Million) Forecast, by Application 2019 & 2032
- Table 20: Rest of Asia Pacific APAC Electric Buses Market Revenue (Million) Forecast, by Application 2019 & 2032
- Table 21: Global APAC Electric Buses Market Revenue Million Forecast, by Country 2019 & 2032
- Table 22: Brazil APAC Electric Buses Market Revenue (Million) Forecast, by Application 2019 & 2032
- Table 23: Mexico APAC Electric Buses Market Revenue (Million) Forecast, by Application 2019 & 2032
- Table 24: United Arab Emirates APAC Electric Buses Market Revenue (Million) Forecast, by Application 2019 & 2032
- Table 25: Other Countries APAC Electric Buses Market Revenue (Million) Forecast, by Application 2019 & 2032
- Table 26: Global APAC Electric Buses Market Revenue Million Forecast, by Vehicle Type 2019 & 2032
- Table 27: Global APAC Electric Buses Market Revenue Million Forecast, by Power Source 2019 & 2032
- Table 28: Global APAC Electric Buses Market Revenue Million Forecast, by Consumer 2019 & 2032
- Table 29: Global APAC Electric Buses Market Revenue Million Forecast, by Country 2019 & 2032
- Table 30: United States APAC Electric Buses Market Revenue (Million) Forecast, by Application 2019 & 2032
- Table 31: Canada APAC Electric Buses Market Revenue (Million) Forecast, by Application 2019 & 2032
- Table 32: Mexico APAC Electric Buses Market Revenue (Million) Forecast, by Application 2019 & 2032
- Table 33: Global APAC Electric Buses Market Revenue Million Forecast, by Vehicle Type 2019 & 2032
- Table 34: Global APAC Electric Buses Market Revenue Million Forecast, by Power Source 2019 & 2032
- Table 35: Global APAC Electric Buses Market Revenue Million Forecast, by Consumer 2019 & 2032
- Table 36: Global APAC Electric Buses Market Revenue Million Forecast, by Country 2019 & 2032
- Table 37: Brazil APAC Electric Buses Market Revenue (Million) Forecast, by Application 2019 & 2032
- Table 38: Argentina APAC Electric Buses Market Revenue (Million) Forecast, by Application 2019 & 2032
- Table 39: Rest of South America APAC Electric Buses Market Revenue (Million) Forecast, by Application 2019 & 2032
- Table 40: Global APAC Electric Buses Market Revenue Million Forecast, by Vehicle Type 2019 & 2032
- Table 41: Global APAC Electric Buses Market Revenue Million Forecast, by Power Source 2019 & 2032
- Table 42: Global APAC Electric Buses Market Revenue Million Forecast, by Consumer 2019 & 2032
- Table 43: Global APAC Electric Buses Market Revenue Million Forecast, by Country 2019 & 2032
- Table 44: United Kingdom APAC Electric Buses Market Revenue (Million) Forecast, by Application 2019 & 2032
- Table 45: Germany APAC Electric Buses Market Revenue (Million) Forecast, by Application 2019 & 2032
- Table 46: France APAC Electric Buses Market Revenue (Million) Forecast, by Application 2019 & 2032
- Table 47: Italy APAC Electric Buses Market Revenue (Million) Forecast, by Application 2019 & 2032
- Table 48: Spain APAC Electric Buses Market Revenue (Million) Forecast, by Application 2019 & 2032
- Table 49: Russia APAC Electric Buses Market Revenue (Million) Forecast, by Application 2019 & 2032
- Table 50: Benelux APAC Electric Buses Market Revenue (Million) Forecast, by Application 2019 & 2032
- Table 51: Nordics APAC Electric Buses Market Revenue (Million) Forecast, by Application 2019 & 2032
- Table 52: Rest of Europe APAC Electric Buses Market Revenue (Million) Forecast, by Application 2019 & 2032
- Table 53: Global APAC Electric Buses Market Revenue Million Forecast, by Vehicle Type 2019 & 2032
- Table 54: Global APAC Electric Buses Market Revenue Million Forecast, by Power Source 2019 & 2032
- Table 55: Global APAC Electric Buses Market Revenue Million Forecast, by Consumer 2019 & 2032
- Table 56: Global APAC Electric Buses Market Revenue Million Forecast, by Country 2019 & 2032
- Table 57: Turkey APAC Electric Buses Market Revenue (Million) Forecast, by Application 2019 & 2032
- Table 58: Israel APAC Electric Buses Market Revenue (Million) Forecast, by Application 2019 & 2032
- Table 59: GCC APAC Electric Buses Market Revenue (Million) Forecast, by Application 2019 & 2032
- Table 60: North Africa APAC Electric Buses Market Revenue (Million) Forecast, by Application 2019 & 2032
- Table 61: South Africa APAC Electric Buses Market Revenue (Million) Forecast, by Application 2019 & 2032
- Table 62: Rest of Middle East & Africa APAC Electric Buses Market Revenue (Million) Forecast, by Application 2019 & 2032
- Table 63: Global APAC Electric Buses Market Revenue Million Forecast, by Vehicle Type 2019 & 2032
- Table 64: Global APAC Electric Buses Market Revenue Million Forecast, by Power Source 2019 & 2032
- Table 65: Global APAC Electric Buses Market Revenue Million Forecast, by Consumer 2019 & 2032
- Table 66: Global APAC Electric Buses Market Revenue Million Forecast, by Country 2019 & 2032
- Table 67: China APAC Electric Buses Market Revenue (Million) Forecast, by Application 2019 & 2032
- Table 68: India APAC Electric Buses Market Revenue (Million) Forecast, by Application 2019 & 2032
- Table 69: Japan APAC Electric Buses Market Revenue (Million) Forecast, by Application 2019 & 2032
- Table 70: South Korea APAC Electric Buses Market Revenue (Million) Forecast, by Application 2019 & 2032
- Table 71: ASEAN APAC Electric Buses Market Revenue (Million) Forecast, by Application 2019 & 2032
- Table 72: Oceania APAC Electric Buses Market Revenue (Million) Forecast, by Application 2019 & 2032
- Table 73: Rest of Asia Pacific APAC Electric Buses Market Revenue (Million) Forecast, by Application 2019 & 2032
Frequently Asked Questions
1. What is the projected Compound Annual Growth Rate (CAGR) of the APAC Electric Buses Market?
The projected CAGR is approximately 10.55%.
2. Which companies are prominent players in the APAC Electric Buses Market?
Key companies in the market include Ashok Leyland Limited, Scania AB*List Not Exhaustive, Tata Motors Limited, Volvo Group, Nanjing Jiayuan EV, King Long United Automotive Co Limited, Zhongtong Bus Holding Co Limited, BYD Auto Co Limited, Anhui Ankai Automobile Industries Co Limited.
3. What are the main segments of the APAC Electric Buses Market?
The market segments include Vehicle Type, Power Source, Consumer.
4. Can you provide details about the market size?
The market size is estimated to be USD 44.74 Million as of 2022.
5. What are some drivers contributing to market growth?
Growing Travel and Tourism Industry is Driving the Car Rental Market.
6. What are the notable trends driving market growth?
Battery Electric Bus Segment to Play Prominent Role in the Market.
7. Are there any restraints impacting market growth?
Increasing Popularity of Ride-Sharing Services Pose Challenges for the Conventional Car Rental Market.
8. Can you provide examples of recent developments in the market?
In August 2022, Ashok Leyland's subsidiary Switch Mobility Ltd. secured an order to supply 200 air-conditioned electric double-decker buses from BEST in Mumbai. The double-decker buses are from EiV22 family and are powered by a 231 kWh battery, The buses will replace the existing fossil fuel powered double-decker buses in the BEST fleet.
9. What pricing options are available for accessing the report?
Pricing options include single-user, multi-user, and enterprise licenses priced at USD 4750, USD 4950, and USD 6800 respectively.
10. Is the market size provided in terms of value or volume?
The market size is provided in terms of value, measured in Million.
11. Are there any specific market keywords associated with the report?
Yes, the market keyword associated with the report is "APAC Electric Buses Market," which aids in identifying and referencing the specific market segment covered.
12. How do I determine which pricing option suits my needs best?
The pricing options vary based on user requirements and access needs. Individual users may opt for single-user licenses, while businesses requiring broader access may choose multi-user or enterprise licenses for cost-effective access to the report.
13. Are there any additional resources or data provided in the APAC Electric Buses Market report?
While the report offers comprehensive insights, it's advisable to review the specific contents or supplementary materials provided to ascertain if additional resources or data are available.
14. How can I stay updated on further developments or reports in the APAC Electric Buses Market?
To stay informed about further developments, trends, and reports in the APAC Electric Buses Market, consider subscribing to industry newsletters, following relevant companies and organizations, or regularly checking reputable industry news sources and publications.
Methodology
Step 1 - Identification of Relevant Samples Size from Population Database


Step 2 - Approaches for Defining Global Market Size (Value, Volume* & Price*)

Note*: In applicable scenarios
Step 3 - Data Sources
Primary Research
- Web Analytics
- Survey Reports
- Research Institute
- Latest Research Reports
- Opinion Leaders
Secondary Research
- Annual Reports
- White Paper
- Latest Press Release
- Industry Association
- Paid Database
- Investor Presentations

Step 4 - Data Triangulation
Involves using different sources of information in order to increase the validity of a study
These sources are likely to be stakeholders in a program - participants, other researchers, program staff, other community members, and so on.
Then we put all data in single framework & apply various statistical tools to find out the dynamic on the market.
During the analysis stage, feedback from the stakeholder groups would be compared to determine areas of agreement as well as areas of divergence


