Key Insights
The Asia-Pacific (APAC) floating production market is poised for substantial expansion, driven by escalating demand for offshore oil and gas. With a projected Compound Annual Growth Rate (CAGR) of 7.2%, the market size is estimated to reach $8.2 billion by 2033, building on a base year of 2023. Exploration and development in deepwater fields across Southeast Asia and Australia are key growth catalysts, supported by favorable government policies encouraging energy self-sufficiency. Advancements in Floating Production Storage and Offloading (FPSO) units, SPAR platforms, and other floating production systems are enhancing efficiency and accessing previously untapped reserves. Despite regulatory and environmental considerations, the market benefits from persistent energy demand and significant offshore resource potential.
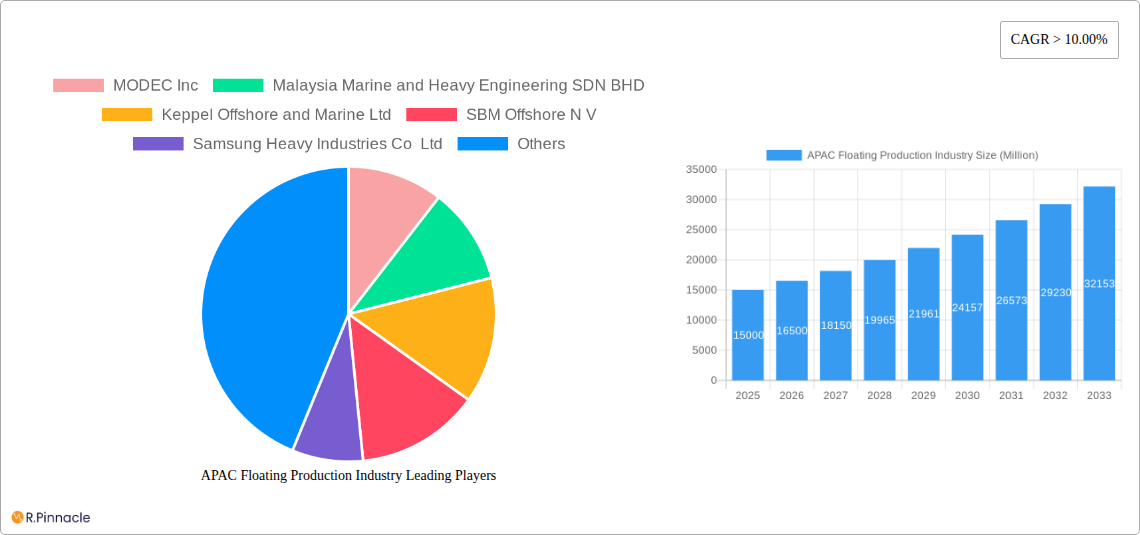
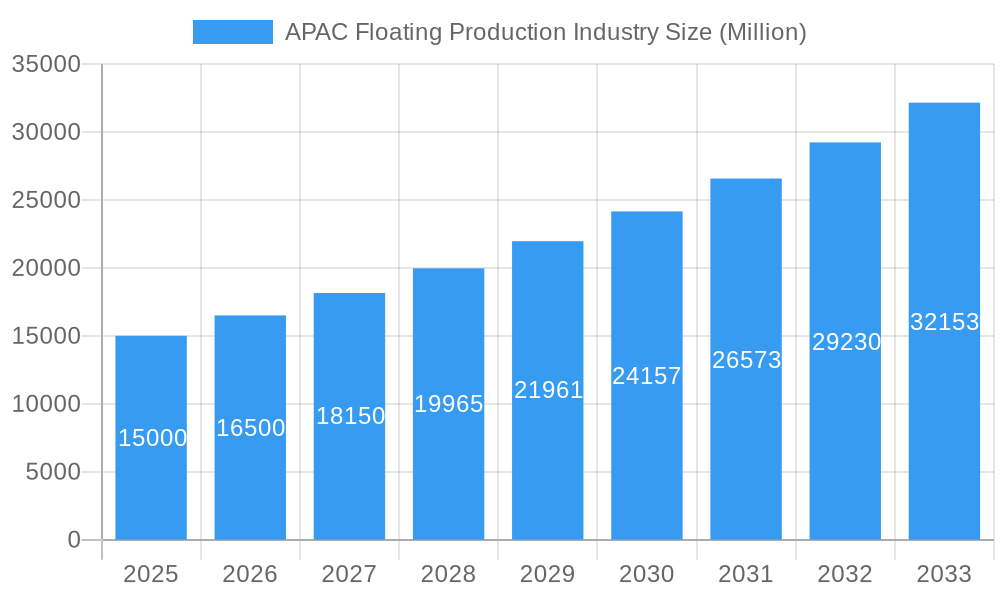
APAC Floating Production Industry Market Size (In Billion)
Key industry players, including MODEC, Keppel Offshore & Marine, and Samsung Heavy Industries, demonstrate the capital-intensive nature of this sector. The emergence of specialized companies signals market maturity and service diversification. Growth is expected to be particularly robust in deepwater and ultra-deepwater installations, aligning with exploration priorities in Australia and Indonesia. The APAC floating production market forecast through 2033 anticipates continued growth, influenced by global energy prices and geopolitical dynamics. Opportunities abound in technological innovation for sustainable floating production systems. Collaboration between international and local operators is vital for maximizing regional potential. Expanding energy infrastructure and the pursuit of energy security in APAC nations will sustain demand for adaptable floating production solutions. While project financing and skilled labor present challenges, the long-term outlook remains exceptionally strong, supported by abundant resources and a growing commitment to offshore energy development.
APAC Floating Production Industry Company Market Share
APAC Floating Production Industry: A Comprehensive Market Analysis (2019-2033)
This in-depth report provides a comprehensive analysis of the Asia-Pacific (APAC) floating production industry, offering invaluable insights for industry professionals, investors, and strategic decision-makers. Covering the period from 2019 to 2033, with a base year of 2025 and a forecast period of 2025-2033, this report delivers actionable intelligence on market trends, key players, and future growth potential. The study meticulously segments the market by type (FPSO, Tension Leg Platform, SPAR, Barge) and water depth (Shallow Water, Deepwater, Ultra-Deepwater), providing granular market sizing and growth projections. Millions (M) are used for all values.
APAC Floating Production Industry Market Structure & Innovation Trends
This section analyzes the APAC floating production industry's competitive landscape, focusing on market concentration, innovation drivers, regulatory frameworks, and M&A activities. The report delves into the market share of key players like MODEC Inc, Malaysia Marine and Heavy Engineering SDN BHD, Keppel Offshore and Marine Ltd, SBM Offshore N V, Samsung Heavy Industries Co Ltd, Teekay Corporation, Hyundai Heavy Industries Co Ltd, TechnipFMC PLC, Bumi Armada Berhad, and Mitsubishi Heavy Industries Ltd. The analysis includes an assessment of market concentration using metrics such as the Herfindahl-Hirschman Index (HHI) and a review of significant M&A activities during the study period (2019-2024), including deal values (estimated at xx M). The report also examines the influence of regulatory frameworks, technological advancements driving innovation (e.g., automation, digitalization), and the impact of substitute products on market dynamics. End-user demographics and their evolving needs are also considered within this analysis.
- Market Share Analysis of Top 10 Players (2025): Data will be presented in the report.
- M&A Activity Summary (2019-2024): Details of major mergers and acquisitions with estimated deal values will be provided.
- Regulatory Landscape Analysis: A summary of key regulations and their impact on market dynamics.
APAC Floating Production Industry Market Dynamics & Trends
This section examines the key factors influencing the growth and evolution of the APAC floating production market. The report analyzes market growth drivers, including increasing energy demand, exploration and production activities in deepwater areas, and government initiatives promoting energy security. Technological disruptions, such as advancements in subsea technologies and automation, are also explored, along with their impact on market penetration and competitive dynamics. The report estimates the Compound Annual Growth Rate (CAGR) for the forecast period (2025-2033) and projects market size for the estimated year (2025) at xx M. Consumer preferences and their impact on the demand for specific floating production systems are also assessed. Competitive dynamics are reviewed, including strategies employed by major players to maintain or enhance their market positions.
Dominant Regions & Segments in APAC Floating Production Industry
This section identifies the leading regions, countries, and segments within the APAC floating production market. The analysis focuses on market size, growth drivers, and competitive dynamics for each segment (FPSO, Tension Leg Platform, SPAR, Barge) and water depth category (Shallow Water, Deepwater, Ultra-Deepwater). The report highlights the dominance of specific regions or countries based on factors such as resource availability, government policies, and infrastructure development.
- Key Drivers for Dominant Regions/Segments: Bullet points will outline the key economic policies, infrastructure investments, and technological advancements driving growth in specific regions and segments.
- Dominance Analysis: Paragraphs will provide a detailed analysis of the factors contributing to the dominance of specific regions and segments, including competitive intensity and market share distribution.
APAC Floating Production Industry Product Innovations
This section provides a concise overview of recent product developments and innovations in the APAC floating production industry. It highlights technological trends influencing product design, applications, and the competitive advantages offered by various types of floating production systems. Emphasis is placed on emerging technologies that enhance efficiency, reduce environmental impact, and address the specific challenges of operating in challenging environments.
Report Scope & Segmentation Analysis
This report provides a comprehensive market segmentation analysis by type (FPSO, Tension Leg Platform, SPAR, Barge) and water depth (Shallow Water, Deepwater, Ultra-Deepwater). For each segment, the report presents market size estimations, growth projections, and an analysis of competitive dynamics. Each segment’s description will include a detailed analysis. For example, the FPSO segment will detail its market size, growth projections, competitive landscape, and key challenges. Similar analyses are provided for all other segments.
Key Drivers of APAC Floating Production Industry Growth
This section outlines the key factors driving growth in the APAC floating production industry. These factors include rising energy demand, increasing investment in offshore exploration and production, technological advancements, supportive government policies, and the development of new offshore oil and gas fields. Specific examples of each driver will be provided with quantifiable metrics.
Challenges in the APAC Floating Production Industry Sector
This section identifies the key challenges and restraints facing the APAC floating production industry. These include regulatory hurdles, supply chain complexities, environmental concerns, fluctuations in oil and gas prices, and intense competition. The impact of these challenges on market growth and profitability is also analyzed with quantitative data whenever available.
Emerging Opportunities in APAC Floating Production Industry
This section highlights emerging opportunities within the APAP floating production industry. This involves exploration of new markets, technological advancements, changing consumer preferences, and potential for innovation within the sector. Specific examples will illustrate the potential of these opportunities.
Leading Players in the APAC Floating Production Industry Market
- MODEC Inc
- Malaysia Marine and Heavy Engineering SDN BHD
- Keppel Offshore and Marine Ltd
- SBM Offshore N V
- Samsung Heavy Industries Co Ltd
- Teekay Corporation
- Hyundai Heavy Industries Co Ltd
- TechnipFMC PLC
- Bumi Armada Berhad
- Mitsubishi Heavy Industries Ltd
Key Developments in APAC Floating Production Industry
This section details key developments in the APAC floating production industry, including new product launches, mergers and acquisitions, and significant contract awards. Each development will be presented with the year and month of occurrence, along with an analysis of its impact on market dynamics.
Future Outlook for APAC Floating Production Industry Market
This section summarizes the future outlook for the APAC floating production industry, focusing on growth accelerators and strategic opportunities. The analysis incorporates market trends, technological advancements, and expected regulatory changes to project market potential and identify key areas for investment and innovation.
APAC Floating Production Industry Segmentation
-
1. Type
- 1.1. FPSO
- 1.2. Tension Leg Platform
- 1.3. SPAR
- 1.4. Barge
-
2. Water Depth
- 2.1. Shallow Water
- 2.2. Deepwater and Ultra-Deepwater
-
3. Geography
- 3.1. China
- 3.2. Australia
- 3.3. India
- 3.4. Malaysia
- 3.5. Rest of Asia-Pacific
APAC Floating Production Industry Segmentation By Geography
- 1. China
- 2. Australia
- 3. India
- 4. Malaysia
- 5. Rest of Asia Pacific
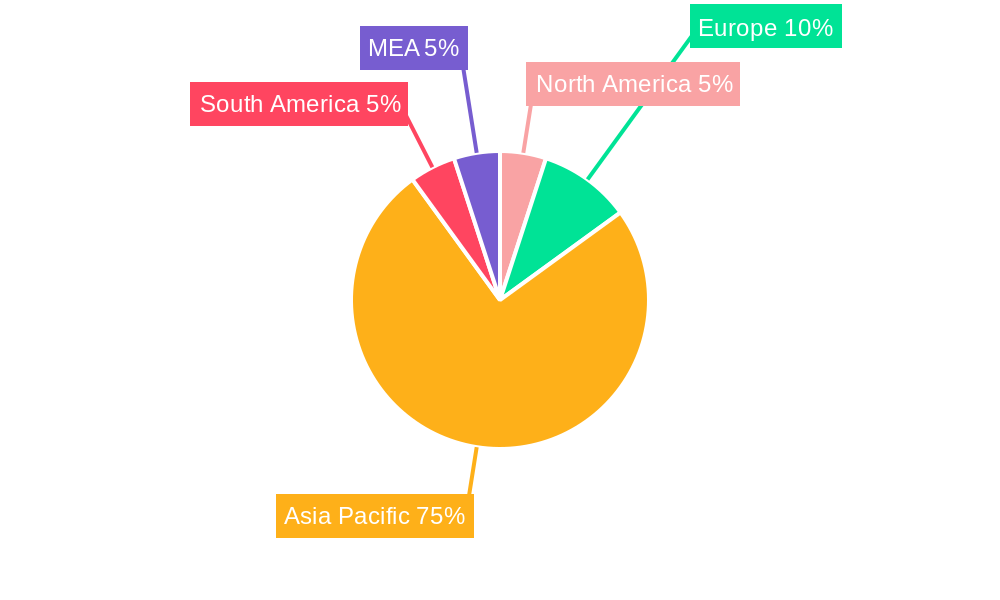
APAC Floating Production Industry Regional Market Share
Geographic Coverage of APAC Floating Production Industry
APAC Floating Production Industry REPORT HIGHLIGHTS
| Aspects | Details |
|---|---|
| Study Period | 2020-2034 |
| Base Year | 2025 |
| Estimated Year | 2026 |
| Forecast Period | 2026-2034 |
| Historical Period | 2020-2025 |
| Growth Rate | CAGR of 7.2% from 2020-2034 |
| Segmentation |
|
Table of Contents
- 1. Introduction
- 1.1. Research Scope
- 1.2. Market Segmentation
- 1.3. Research Objective
- 1.4. Definitions and Assumptions
- 2. Executive Summary
- 2.1. Market Snapshot
- 3. Market Dynamics
- 3.1. Market Drivers
- 3.2. Market Restrains
- 3.3. Market Trends
- 3.4. Market Opportunities
- 4. Market Factor Analysis
- 4.1. Porters Five Forces
- 4.1.1. Bargaining Power of Suppliers
- 4.1.2. Bargaining Power of Buyers
- 4.1.3. Threat of New Entrants
- 4.1.4. Threat of Substitutes
- 4.1.5. Competitive Rivalry
- 4.2. PESTEL analysis
- 4.3. BCG Analysis
- 4.3.1. Stars (High Growth, High Market Share)
- 4.3.2. Cash Cows (Low Growth, High Market Share)
- 4.3.3. Question Mark (High Growth, Low Market Share)
- 4.3.4. Dogs (Low Growth, Low Market Share)
- 4.4. Ansoff Matrix Analysis
- 4.5. Supply Chain Analysis
- 4.6. Regulatory Landscape
- 4.7. Current Market Potential and Opportunity Assessment (TAM–SAM–SOM Framework)
- 4.8. PRI Analyst Note
- 4.1. Porters Five Forces
- 5. Market Analysis, Insights and Forecast 2021-2033
- 5.1. Market Analysis, Insights and Forecast - by Type
- 5.1.1. FPSO
- 5.1.2. Tension Leg Platform
- 5.1.3. SPAR
- 5.1.4. Barge
- 5.2. Market Analysis, Insights and Forecast - by Water Depth
- 5.2.1. Shallow Water
- 5.2.2. Deepwater and Ultra-Deepwater
- 5.3. Market Analysis, Insights and Forecast - by Geography
- 5.3.1. China
- 5.3.2. Australia
- 5.3.3. India
- 5.3.4. Malaysia
- 5.3.5. Rest of Asia-Pacific
- 5.4. Market Analysis, Insights and Forecast - by Region
- 5.4.1. China
- 5.4.2. Australia
- 5.4.3. India
- 5.4.4. Malaysia
- 5.4.5. Rest of Asia Pacific
- 5.1. Market Analysis, Insights and Forecast - by Type
- 6. Global APAC Floating Production Industry Analysis, Insights and Forecast, 2021-2033
- 6.1. Market Analysis, Insights and Forecast - by Type
- 6.1.1. FPSO
- 6.1.2. Tension Leg Platform
- 6.1.3. SPAR
- 6.1.4. Barge
- 6.2. Market Analysis, Insights and Forecast - by Water Depth
- 6.2.1. Shallow Water
- 6.2.2. Deepwater and Ultra-Deepwater
- 6.3. Market Analysis, Insights and Forecast - by Geography
- 6.3.1. China
- 6.3.2. Australia
- 6.3.3. India
- 6.3.4. Malaysia
- 6.3.5. Rest of Asia-Pacific
- 6.1. Market Analysis, Insights and Forecast - by Type
- 7. China APAC Floating Production Industry Analysis, Insights and Forecast, 2020-2032
- 7.1. Market Analysis, Insights and Forecast - by Type
- 7.1.1. FPSO
- 7.1.2. Tension Leg Platform
- 7.1.3. SPAR
- 7.1.4. Barge
- 7.2. Market Analysis, Insights and Forecast - by Water Depth
- 7.2.1. Shallow Water
- 7.2.2. Deepwater and Ultra-Deepwater
- 7.3. Market Analysis, Insights and Forecast - by Geography
- 7.3.1. China
- 7.3.2. Australia
- 7.3.3. India
- 7.3.4. Malaysia
- 7.3.5. Rest of Asia-Pacific
- 7.1. Market Analysis, Insights and Forecast - by Type
- 8. Australia APAC Floating Production Industry Analysis, Insights and Forecast, 2020-2032
- 8.1. Market Analysis, Insights and Forecast - by Type
- 8.1.1. FPSO
- 8.1.2. Tension Leg Platform
- 8.1.3. SPAR
- 8.1.4. Barge
- 8.2. Market Analysis, Insights and Forecast - by Water Depth
- 8.2.1. Shallow Water
- 8.2.2. Deepwater and Ultra-Deepwater
- 8.3. Market Analysis, Insights and Forecast - by Geography
- 8.3.1. China
- 8.3.2. Australia
- 8.3.3. India
- 8.3.4. Malaysia
- 8.3.5. Rest of Asia-Pacific
- 8.1. Market Analysis, Insights and Forecast - by Type
- 9. India APAC Floating Production Industry Analysis, Insights and Forecast, 2020-2032
- 9.1. Market Analysis, Insights and Forecast - by Type
- 9.1.1. FPSO
- 9.1.2. Tension Leg Platform
- 9.1.3. SPAR
- 9.1.4. Barge
- 9.2. Market Analysis, Insights and Forecast - by Water Depth
- 9.2.1. Shallow Water
- 9.2.2. Deepwater and Ultra-Deepwater
- 9.3. Market Analysis, Insights and Forecast - by Geography
- 9.3.1. China
- 9.3.2. Australia
- 9.3.3. India
- 9.3.4. Malaysia
- 9.3.5. Rest of Asia-Pacific
- 9.1. Market Analysis, Insights and Forecast - by Type
- 10. Malaysia APAC Floating Production Industry Analysis, Insights and Forecast, 2020-2032
- 10.1. Market Analysis, Insights and Forecast - by Type
- 10.1.1. FPSO
- 10.1.2. Tension Leg Platform
- 10.1.3. SPAR
- 10.1.4. Barge
- 10.2. Market Analysis, Insights and Forecast - by Water Depth
- 10.2.1. Shallow Water
- 10.2.2. Deepwater and Ultra-Deepwater
- 10.3. Market Analysis, Insights and Forecast - by Geography
- 10.3.1. China
- 10.3.2. Australia
- 10.3.3. India
- 10.3.4. Malaysia
- 10.3.5. Rest of Asia-Pacific
- 10.1. Market Analysis, Insights and Forecast - by Type
- 11. Rest of Asia Pacific APAC Floating Production Industry Analysis, Insights and Forecast, 2020-2032
- 11.1. Market Analysis, Insights and Forecast - by Type
- 11.1.1. FPSO
- 11.1.2. Tension Leg Platform
- 11.1.3. SPAR
- 11.1.4. Barge
- 11.2. Market Analysis, Insights and Forecast - by Water Depth
- 11.2.1. Shallow Water
- 11.2.2. Deepwater and Ultra-Deepwater
- 11.3. Market Analysis, Insights and Forecast - by Geography
- 11.3.1. China
- 11.3.2. Australia
- 11.3.3. India
- 11.3.4. Malaysia
- 11.3.5. Rest of Asia-Pacific
- 11.1. Market Analysis, Insights and Forecast - by Type
- 12. Competitive Analysis
- 12.1. Company Profiles
- 12.1.1 MODEC Inc
- 12.1.1.1. Company Overview
- 12.1.1.2. Products
- 12.1.1.3. Company Financials
- 12.1.1.4. SWOT Analysis
- 12.1.2 Malaysia Marine and Heavy Engineering SDN BHD
- 12.1.2.1. Company Overview
- 12.1.2.2. Products
- 12.1.2.3. Company Financials
- 12.1.2.4. SWOT Analysis
- 12.1.3 Keppel Offshore and Marine Ltd
- 12.1.3.1. Company Overview
- 12.1.3.2. Products
- 12.1.3.3. Company Financials
- 12.1.3.4. SWOT Analysis
- 12.1.4 SBM Offshore N V
- 12.1.4.1. Company Overview
- 12.1.4.2. Products
- 12.1.4.3. Company Financials
- 12.1.4.4. SWOT Analysis
- 12.1.5 Samsung Heavy Industries Co Ltd
- 12.1.5.1. Company Overview
- 12.1.5.2. Products
- 12.1.5.3. Company Financials
- 12.1.5.4. SWOT Analysis
- 12.1.6 Teekay Corporation
- 12.1.6.1. Company Overview
- 12.1.6.2. Products
- 12.1.6.3. Company Financials
- 12.1.6.4. SWOT Analysis
- 12.1.7 Hyundai Heavy Industries Co Ltd
- 12.1.7.1. Company Overview
- 12.1.7.2. Products
- 12.1.7.3. Company Financials
- 12.1.7.4. SWOT Analysis
- 12.1.8 TechnipFMC PLC
- 12.1.8.1. Company Overview
- 12.1.8.2. Products
- 12.1.8.3. Company Financials
- 12.1.8.4. SWOT Analysis
- 12.1.9 Bumi Armada Berhad
- 12.1.9.1. Company Overview
- 12.1.9.2. Products
- 12.1.9.3. Company Financials
- 12.1.9.4. SWOT Analysis
- 12.1.10 Mitsubishi Heavy Industries Ltd
- 12.1.10.1. Company Overview
- 12.1.10.2. Products
- 12.1.10.3. Company Financials
- 12.1.10.4. SWOT Analysis
- 12.1.1 MODEC Inc
- 12.2. Market Entropy
- 12.2.1 Company's Key Areas Served
- 12.2.2 Recent Developments
- 12.3. Company Market Share Analysis 2025
- 12.3.1 Top 5 Companies Market Share Analysis
- 12.3.2 Top 3 Companies Market Share Analysis
- 12.4. List of Potential Customers
- 13. Research Methodology
List of Figures
- Figure 1: Global APAC Floating Production Industry Revenue Breakdown (billion, %) by Region 2025 & 2033
- Figure 2: China APAC Floating Production Industry Revenue (billion), by Type 2025 & 2033
- Figure 3: China APAC Floating Production Industry Revenue Share (%), by Type 2025 & 2033
- Figure 4: China APAC Floating Production Industry Revenue (billion), by Water Depth 2025 & 2033
- Figure 5: China APAC Floating Production Industry Revenue Share (%), by Water Depth 2025 & 2033
- Figure 6: China APAC Floating Production Industry Revenue (billion), by Geography 2025 & 2033
- Figure 7: China APAC Floating Production Industry Revenue Share (%), by Geography 2025 & 2033
- Figure 8: China APAC Floating Production Industry Revenue (billion), by Country 2025 & 2033
- Figure 9: China APAC Floating Production Industry Revenue Share (%), by Country 2025 & 2033
- Figure 10: Australia APAC Floating Production Industry Revenue (billion), by Type 2025 & 2033
- Figure 11: Australia APAC Floating Production Industry Revenue Share (%), by Type 2025 & 2033
- Figure 12: Australia APAC Floating Production Industry Revenue (billion), by Water Depth 2025 & 2033
- Figure 13: Australia APAC Floating Production Industry Revenue Share (%), by Water Depth 2025 & 2033
- Figure 14: Australia APAC Floating Production Industry Revenue (billion), by Geography 2025 & 2033
- Figure 15: Australia APAC Floating Production Industry Revenue Share (%), by Geography 2025 & 2033
- Figure 16: Australia APAC Floating Production Industry Revenue (billion), by Country 2025 & 2033
- Figure 17: Australia APAC Floating Production Industry Revenue Share (%), by Country 2025 & 2033
- Figure 18: India APAC Floating Production Industry Revenue (billion), by Type 2025 & 2033
- Figure 19: India APAC Floating Production Industry Revenue Share (%), by Type 2025 & 2033
- Figure 20: India APAC Floating Production Industry Revenue (billion), by Water Depth 2025 & 2033
- Figure 21: India APAC Floating Production Industry Revenue Share (%), by Water Depth 2025 & 2033
- Figure 22: India APAC Floating Production Industry Revenue (billion), by Geography 2025 & 2033
- Figure 23: India APAC Floating Production Industry Revenue Share (%), by Geography 2025 & 2033
- Figure 24: India APAC Floating Production Industry Revenue (billion), by Country 2025 & 2033
- Figure 25: India APAC Floating Production Industry Revenue Share (%), by Country 2025 & 2033
- Figure 26: Malaysia APAC Floating Production Industry Revenue (billion), by Type 2025 & 2033
- Figure 27: Malaysia APAC Floating Production Industry Revenue Share (%), by Type 2025 & 2033
- Figure 28: Malaysia APAC Floating Production Industry Revenue (billion), by Water Depth 2025 & 2033
- Figure 29: Malaysia APAC Floating Production Industry Revenue Share (%), by Water Depth 2025 & 2033
- Figure 30: Malaysia APAC Floating Production Industry Revenue (billion), by Geography 2025 & 2033
- Figure 31: Malaysia APAC Floating Production Industry Revenue Share (%), by Geography 2025 & 2033
- Figure 32: Malaysia APAC Floating Production Industry Revenue (billion), by Country 2025 & 2033
- Figure 33: Malaysia APAC Floating Production Industry Revenue Share (%), by Country 2025 & 2033
- Figure 34: Rest of Asia Pacific APAC Floating Production Industry Revenue (billion), by Type 2025 & 2033
- Figure 35: Rest of Asia Pacific APAC Floating Production Industry Revenue Share (%), by Type 2025 & 2033
- Figure 36: Rest of Asia Pacific APAC Floating Production Industry Revenue (billion), by Water Depth 2025 & 2033
- Figure 37: Rest of Asia Pacific APAC Floating Production Industry Revenue Share (%), by Water Depth 2025 & 2033
- Figure 38: Rest of Asia Pacific APAC Floating Production Industry Revenue (billion), by Geography 2025 & 2033
- Figure 39: Rest of Asia Pacific APAC Floating Production Industry Revenue Share (%), by Geography 2025 & 2033
- Figure 40: Rest of Asia Pacific APAC Floating Production Industry Revenue (billion), by Country 2025 & 2033
- Figure 41: Rest of Asia Pacific APAC Floating Production Industry Revenue Share (%), by Country 2025 & 2033
List of Tables
- Table 1: Global APAC Floating Production Industry Revenue billion Forecast, by Type 2020 & 2033
- Table 2: Global APAC Floating Production Industry Revenue billion Forecast, by Water Depth 2020 & 2033
- Table 3: Global APAC Floating Production Industry Revenue billion Forecast, by Geography 2020 & 2033
- Table 4: Global APAC Floating Production Industry Revenue billion Forecast, by Region 2020 & 2033
- Table 5: Global APAC Floating Production Industry Revenue billion Forecast, by Type 2020 & 2033
- Table 6: Global APAC Floating Production Industry Revenue billion Forecast, by Water Depth 2020 & 2033
- Table 7: Global APAC Floating Production Industry Revenue billion Forecast, by Geography 2020 & 2033
- Table 8: Global APAC Floating Production Industry Revenue billion Forecast, by Country 2020 & 2033
- Table 9: Global APAC Floating Production Industry Revenue billion Forecast, by Type 2020 & 2033
- Table 10: Global APAC Floating Production Industry Revenue billion Forecast, by Water Depth 2020 & 2033
- Table 11: Global APAC Floating Production Industry Revenue billion Forecast, by Geography 2020 & 2033
- Table 12: Global APAC Floating Production Industry Revenue billion Forecast, by Country 2020 & 2033
- Table 13: Global APAC Floating Production Industry Revenue billion Forecast, by Type 2020 & 2033
- Table 14: Global APAC Floating Production Industry Revenue billion Forecast, by Water Depth 2020 & 2033
- Table 15: Global APAC Floating Production Industry Revenue billion Forecast, by Geography 2020 & 2033
- Table 16: Global APAC Floating Production Industry Revenue billion Forecast, by Country 2020 & 2033
- Table 17: Global APAC Floating Production Industry Revenue billion Forecast, by Type 2020 & 2033
- Table 18: Global APAC Floating Production Industry Revenue billion Forecast, by Water Depth 2020 & 2033
- Table 19: Global APAC Floating Production Industry Revenue billion Forecast, by Geography 2020 & 2033
- Table 20: Global APAC Floating Production Industry Revenue billion Forecast, by Country 2020 & 2033
- Table 21: Global APAC Floating Production Industry Revenue billion Forecast, by Type 2020 & 2033
- Table 22: Global APAC Floating Production Industry Revenue billion Forecast, by Water Depth 2020 & 2033
- Table 23: Global APAC Floating Production Industry Revenue billion Forecast, by Geography 2020 & 2033
- Table 24: Global APAC Floating Production Industry Revenue billion Forecast, by Country 2020 & 2033
Frequently Asked Questions
1. What is the projected Compound Annual Growth Rate (CAGR) of the APAC Floating Production Industry?
The projected CAGR is approximately 7.2%.
2. Which companies are prominent players in the APAC Floating Production Industry?
Key companies in the market include MODEC Inc, Malaysia Marine and Heavy Engineering SDN BHD, Keppel Offshore and Marine Ltd, SBM Offshore N V, Samsung Heavy Industries Co Ltd, Teekay Corporation, Hyundai Heavy Industries Co Ltd, TechnipFMC PLC, Bumi Armada Berhad, Mitsubishi Heavy Industries Ltd.
3. What are the main segments of the APAC Floating Production Industry?
The market segments include Type, Water Depth, Geography.
4. Can you provide details about the market size?
The market size is estimated to be USD 8.2 billion as of 2022.
5. What are some drivers contributing to market growth?
4.; An Increase in the Use of LNG as an Energy Source.
6. What are the notable trends driving market growth?
Floating Production. Storage and Offloading (FPSO) to Dominate the Market.
7. Are there any restraints impacting market growth?
4.; Increasing Adoption of Solar and Wind Energy.
8. Can you provide examples of recent developments in the market?
N/A
9. What pricing options are available for accessing the report?
Pricing options include single-user, multi-user, and enterprise licenses priced at USD 4750, USD 5250, and USD 8750 respectively.
10. Is the market size provided in terms of value or volume?
The market size is provided in terms of value, measured in billion.
11. Are there any specific market keywords associated with the report?
Yes, the market keyword associated with the report is "APAC Floating Production Industry," which aids in identifying and referencing the specific market segment covered.
12. How do I determine which pricing option suits my needs best?
The pricing options vary based on user requirements and access needs. Individual users may opt for single-user licenses, while businesses requiring broader access may choose multi-user or enterprise licenses for cost-effective access to the report.
13. Are there any additional resources or data provided in the APAC Floating Production Industry report?
While the report offers comprehensive insights, it's advisable to review the specific contents or supplementary materials provided to ascertain if additional resources or data are available.
14. How can I stay updated on further developments or reports in the APAC Floating Production Industry?
To stay informed about further developments, trends, and reports in the APAC Floating Production Industry, consider subscribing to industry newsletters, following relevant companies and organizations, or regularly checking reputable industry news sources and publications.
Methodology
Step 1 - Identification of Relevant Samples Size from Population Database


Step 2 - Approaches for Defining Global Market Size (Value, Volume* & Price*)

Note*: In applicable scenarios
Step 3 - Data Sources
Primary Research
- Web Analytics
- Survey Reports
- Research Institute
- Latest Research Reports
- Opinion Leaders
Secondary Research
- Annual Reports
- White Paper
- Latest Press Release
- Industry Association
- Paid Database
- Investor Presentations

Step 4 - Data Triangulation
Involves using different sources of information in order to increase the validity of a study
These sources are likely to be stakeholders in a program - participants, other researchers, program staff, other community members, and so on.
Then we put all data in single framework & apply various statistical tools to find out the dynamic on the market.
During the analysis stage, feedback from the stakeholder groups would be compared to determine areas of agreement as well as areas of divergence

