

Key Insights
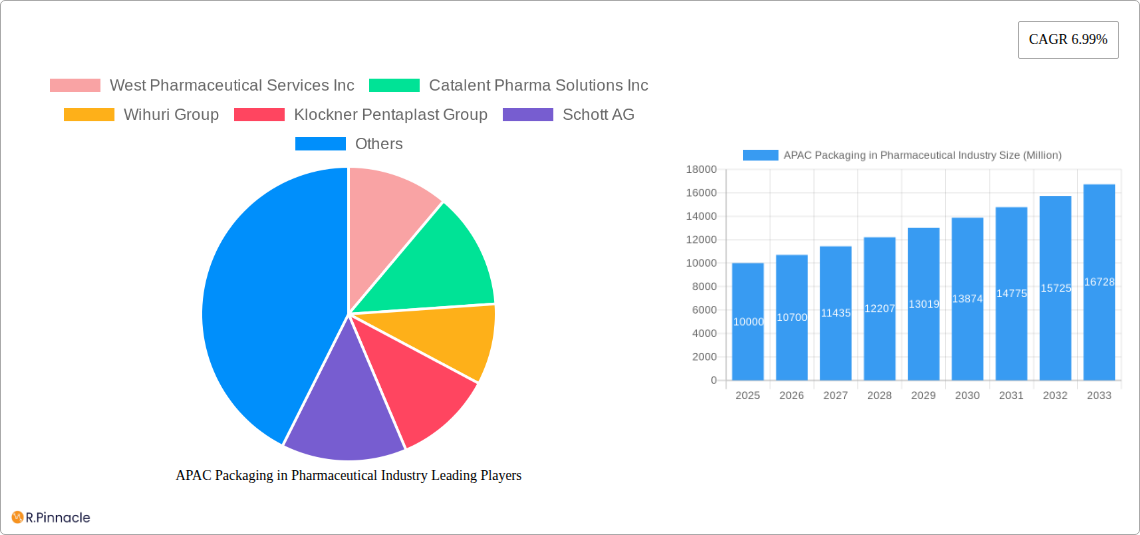
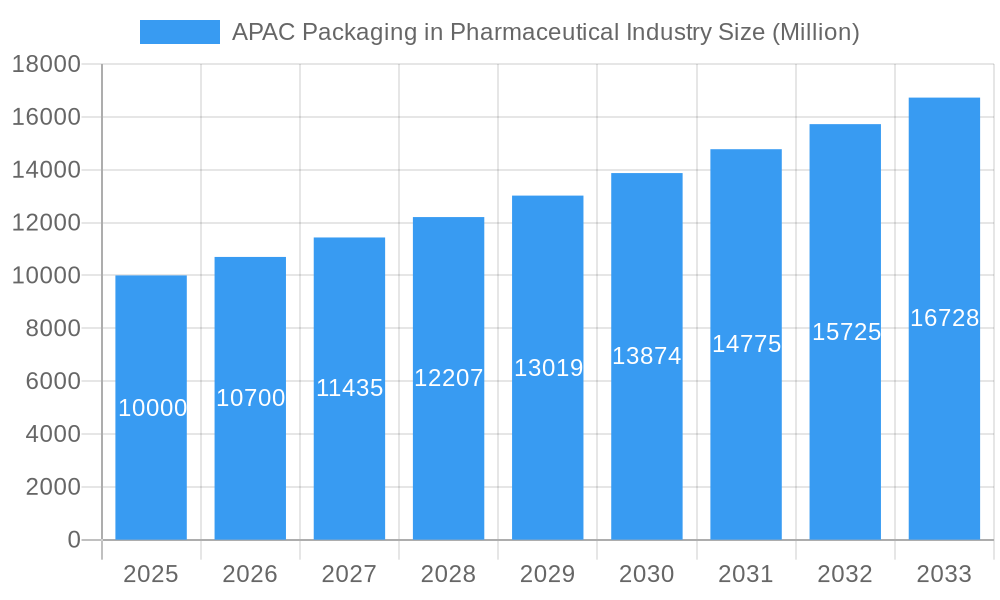
The Asia-Pacific (APAC) pharmaceutical packaging market, valued at approximately $10 billion in 2025, is experiencing robust growth, projected to reach $17 billion by 2033, exhibiting a Compound Annual Growth Rate (CAGR) of 6.99%. This expansion is driven by several key factors. Firstly, the rising prevalence of chronic diseases and an aging population across the region are fueling demand for pharmaceutical products, consequently increasing the need for effective and safe packaging solutions. Secondly, stringent regulatory requirements regarding drug safety and efficacy are driving adoption of advanced packaging technologies, such as blister packs and specialized containers for temperature-sensitive drugs. Furthermore, the burgeoning pharmaceutical industry in countries like India and China, coupled with increasing investments in healthcare infrastructure, are creating significant opportunities for growth. The market is segmented by drug delivery mode (oral, injectable, pulmonary), material (plastic, paper, glass, aluminum), and packaging type (ampoules, blisters, bottles, syringes). The dominance of plastic packaging is expected to continue, although eco-friendly alternatives are gaining traction due to growing environmental concerns. Competitive intensity is high, with both multinational and regional players vying for market share, leading to innovation in packaging design and materials.
APAC Packaging in Pharmaceutical Industry Market Size (In Billion)
Despite the positive outlook, challenges remain. Fluctuations in raw material prices, particularly for plastics and aluminum, can impact profitability. Moreover, counterfeiting remains a significant concern, necessitating the adoption of advanced anti-counterfeiting technologies in pharmaceutical packaging. Stringent regulations and compliance requirements across different countries in the region add complexity to operations. However, the long-term growth prospects remain promising, particularly with ongoing investments in research and development of innovative packaging solutions that address patient convenience, drug stability, and environmental sustainability. The focus on personalized medicine and increasing demand for pre-filled syringes and other advanced delivery systems are expected to further drive market growth throughout the forecast period.
APAC Packaging in Pharmaceutical Industry Company Market Share
APAC Packaging in Pharmaceutical Industry: A Comprehensive Market Report (2019-2033)
This in-depth report provides a comprehensive analysis of the Asia-Pacific (APAC) pharmaceutical packaging market, offering invaluable insights for industry professionals, investors, and strategic planners. With a detailed examination of market dynamics, segment performance, key players, and future trends, this report covers the period from 2019 to 2033, with a focus on the estimated year 2025. The market is projected to reach xx Million by 2033, exhibiting a robust CAGR of xx% during the forecast period (2025-2033).
APAC Packaging in Pharmaceutical Industry Market Structure & Innovation Trends
The APAC pharmaceutical packaging market is characterized by a moderately concentrated structure, with several multinational corporations and regional players dominating different segments. Key players include West Pharmaceutical Services Inc, Catalent Pharma Solutions Inc, Wihuri Group, Klockner Pentaplast Group, Schott AG, NIPRO Corporation, CCL Industries Inc, Gerresheimer AG, Berry Global Group Inc, and Amcor Ltd, although the market also supports a significant number of smaller, specialized firms. The market share held by the top five players is estimated to be around xx%.
Innovation is driven by factors such as:
- Stringent regulatory requirements: Growing emphasis on drug safety and efficacy drives innovation in packaging materials and designs.
- Advancements in drug delivery: The development of novel drug delivery systems necessitates the creation of specialized packaging solutions.
- Sustainability concerns: Growing pressure to reduce environmental impact is fostering the adoption of eco-friendly packaging materials.
Mergers and acquisitions (M&A) are common, with deal values totaling an estimated xx Million in the past five years. Recent examples include Gerresheimer AG's collaboration with Corning Incorporated, enhancing vial production and efficiency. The competitive landscape is dynamic, with companies investing heavily in R&D to develop innovative and cost-effective packaging solutions.
APAC Packaging in Pharmaceutical Industry Market Dynamics & Trends
The APAC pharmaceutical packaging market is experiencing significant growth fueled by several key factors. Rising healthcare expenditure across the region, coupled with a growing geriatric population and increasing prevalence of chronic diseases, are driving demand for pharmaceutical products and consequently, their packaging. Technological advancements such as the introduction of smart packaging and enhanced barrier materials are also contributing to market expansion. Consumer preferences are shifting towards convenient and tamper-evident packaging, influencing product innovation. The market is further shaped by intense competition among existing and emerging players, leading to price pressures and the need for continuous product differentiation.
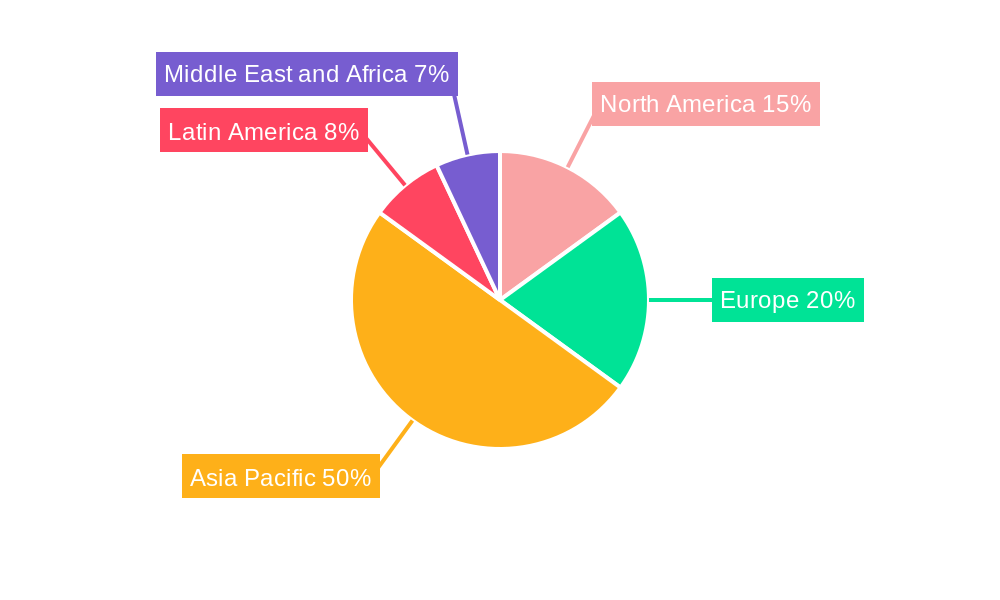
Dominant Regions & Segments in APAC Packaging in Pharmaceutical Industry
Dominant Regions:
- India: Booming pharmaceutical industry, large population, and increasing healthcare spending contribute to India's dominance. Key drivers include supportive government policies and robust infrastructure development in certain areas.
- China: Massive market size, substantial pharmaceutical production, and growing demand for advanced packaging solutions make China another significant market. Economic growth and increasing disposable incomes further propel growth.
- Japan: High per capita healthcare expenditure and stringent regulatory standards drive demand for high-quality pharmaceutical packaging. Well-established infrastructure and technological advancements support the market.
Dominant Segments:
- By Drug Delivery Mode: Injectable drug packaging holds a significant market share due to the large volume of injectable medications used.
- By Material: Plastic remains the dominant material due to its versatility, cost-effectiveness, and ease of processing. However, glass continues to hold importance for specific applications where barrier properties and sterility are paramount.
- By Type: Vials and ampoules dominate due to their widespread use for injectable drugs, while blister packs are widely used for oral medications.
APAC Packaging in Pharmaceutical Industry Product Innovations
Recent innovations include the development of eco-friendly packaging materials made from biodegradable plastics and recycled content, smart packaging incorporating RFID technology for tracking and tracing, and tamper-evident closures enhancing product security. These innovations reflect a trend towards sustainable, secure, and intelligent packaging solutions tailored to the evolving needs of pharmaceutical companies and consumers.
Report Scope & Segmentation Analysis
This report segments the APAC pharmaceutical packaging market by drug delivery mode (oral, injectable, pulmonary, others), country (India, Japan, China, Australia, Rest of APAC), material (plastic, paper & paperboard, glass, aluminum foil), and type (ampoules, blister packs, plastic bottles, syringes, vials, IV fluids, others). Each segment's growth projections, market sizes, and competitive dynamics are analyzed in detail, offering a granular understanding of market opportunities across different segments. For instance, the injectable drug packaging segment is expected to exhibit a CAGR of xx%, driven by the growth of biologics and advanced therapies.
Key Drivers of APAC Packaging in Pharmaceutical Industry Growth
The market's growth is propelled by several factors: the expansion of the pharmaceutical industry in APAC, increasing healthcare spending, rising prevalence of chronic diseases, and technological advancements in packaging materials and design. Regulatory changes emphasizing drug safety and efficacy also stimulate the demand for sophisticated packaging solutions.
Challenges in the APAC Packaging in Pharmaceutical Industry Sector
The industry faces challenges such as stringent regulatory compliance requirements, supply chain disruptions impacting raw material availability and transportation costs, and intense competition from both domestic and international players. These factors can impact production costs and market access, requiring companies to implement efficient strategies to mitigate these risks.
Emerging Opportunities in APAC Packaging in Pharmaceutical Industry
Emerging opportunities include the increasing demand for sustainable packaging solutions, the growing adoption of smart packaging technologies, and the expansion of the biologics and specialized drug delivery systems markets. These present significant growth prospects for companies willing to invest in innovative and eco-friendly solutions.
Leading Players in the APAC Packaging in Pharmaceutical Industry Market
- West Pharmaceutical Services Inc
- Catalent Pharma Solutions Inc
- Wihuri Group
- Klockner Pentaplast Group
- Schott AG
- NIPRO Corporation
- CCL Industries Inc
- Gerresheimer AG
- Berry Global Group Inc
- Amcor Ltd
Key Developments in APAC Packaging in Pharmaceutical Industry Industry
- October 2023: Sonoco ThermoSafe's Pegasus ULD significantly improves pharmaceutical shipments across APAC, offering 13 days of temperature-controlled transport without human intervention.
- February 2023: Gerresheimer AG's partnership with Corning Incorporated enhances vial production, improving quality, lowering costs, and accelerating injectable therapy delivery across various regions, including APAC.
Future Outlook for APAC Packaging in Pharmaceutical Industry Market
The APAC pharmaceutical packaging market is poised for robust growth over the next decade, driven by a confluence of factors including technological advancements, rising healthcare expenditure, and growing demand for pharmaceutical products. Companies that embrace innovation, prioritize sustainability, and effectively navigate the regulatory landscape are well-positioned to capitalize on the numerous growth opportunities that lie ahead.
APAC Packaging in Pharmaceutical Industry Segmentation
-
1. Material
- 1.1. Plastic
- 1.2. Paper and Paper Board
- 1.3. Glass
- 1.4. Aluminum Foil
-
2. Type
- 2.1. Ampoules
- 2.2. Blister Packs
- 2.3. Plastic Bottles
- 2.4. Syringes
- 2.5. Vials
- 2.6. IV fluids
- 2.7. Other Types
-
3. Drug Delivery Mode
- 3.1. Oral Drug packaging
- 3.2. Injectable Drug packaging
- 3.3. Pulmonary Drug Packaging
- 3.4. Other Drug Delivery Modes
APAC Packaging in Pharmaceutical Industry Segmentation By Geography
-
1. North America
- 1.1. United States
- 1.2. Canada
- 1.3. Mexico
-
2. South America
- 2.1. Brazil
- 2.2. Argentina
- 2.3. Rest of South America
-
3. Europe
- 3.1. United Kingdom
- 3.2. Germany
- 3.3. France
- 3.4. Italy
- 3.5. Spain
- 3.6. Russia
- 3.7. Benelux
- 3.8. Nordics
- 3.9. Rest of Europe
-
4. Middle East & Africa
- 4.1. Turkey
- 4.2. Israel
- 4.3. GCC
- 4.4. North Africa
- 4.5. South Africa
- 4.6. Rest of Middle East & Africa
-
5. Asia Pacific
- 5.1. China
- 5.2. India
- 5.3. Japan
- 5.4. South Korea
- 5.5. ASEAN
- 5.6. Oceania
- 5.7. Rest of Asia Pacific
APAC Packaging in Pharmaceutical Industry Regional Market Share
Geographic Coverage of APAC Packaging in Pharmaceutical Industry
APAC Packaging in Pharmaceutical Industry REPORT HIGHLIGHTS
| Aspects | Details |
|---|---|
| Study Period | 2020-2034 |
| Base Year | 2025 |
| Estimated Year | 2026 |
| Forecast Period | 2026-2034 |
| Historical Period | 2020-2025 |
| Growth Rate | CAGR of 6.99% from 2020-2034 |
| Segmentation |
|
Table of Contents
- 1. Introduction
- 1.1. Research Scope
- 1.2. Market Segmentation
- 1.3. Research Objective
- 1.4. Definitions and Assumptions
- 2. Executive Summary
- 2.1. Market Snapshot
- 3. Market Dynamics
- 3.1. Market Drivers
- 3.2. Market Restrains
- 3.3. Market Trends
- 3.4. Market Opportunities
- 4. Market Factor Analysis
- 4.1. Porters Five Forces
- 4.1.1. Bargaining Power of Suppliers
- 4.1.2. Bargaining Power of Buyers
- 4.1.3. Threat of New Entrants
- 4.1.4. Threat of Substitutes
- 4.1.5. Competitive Rivalry
- 4.2. PESTEL analysis
- 4.3. BCG Analysis
- 4.3.1. Stars (High Growth, High Market Share)
- 4.3.2. Cash Cows (Low Growth, High Market Share)
- 4.3.3. Question Mark (High Growth, Low Market Share)
- 4.3.4. Dogs (Low Growth, Low Market Share)
- 4.4. Ansoff Matrix Analysis
- 4.5. Supply Chain Analysis
- 4.6. Regulatory Landscape
- 4.7. Current Market Potential and Opportunity Assessment (TAM–SAM–SOM Framework)
- 4.8. PRI Analyst Note
- 4.1. Porters Five Forces
- 5. Market Analysis, Insights and Forecast 2021-2033
- 5.1. Market Analysis, Insights and Forecast - by Material
- 5.1.1. Plastic
- 5.1.2. Paper and Paper Board
- 5.1.3. Glass
- 5.1.4. Aluminum Foil
- 5.2. Market Analysis, Insights and Forecast - by Type
- 5.2.1. Ampoules
- 5.2.2. Blister Packs
- 5.2.3. Plastic Bottles
- 5.2.4. Syringes
- 5.2.5. Vials
- 5.2.6. IV fluids
- 5.2.7. Other Types
- 5.3. Market Analysis, Insights and Forecast - by Drug Delivery Mode
- 5.3.1. Oral Drug packaging
- 5.3.2. Injectable Drug packaging
- 5.3.3. Pulmonary Drug Packaging
- 5.3.4. Other Drug Delivery Modes
- 5.4. Market Analysis, Insights and Forecast - by Region
- 5.4.1. North America
- 5.4.2. South America
- 5.4.3. Europe
- 5.4.4. Middle East & Africa
- 5.4.5. Asia Pacific
- 5.1. Market Analysis, Insights and Forecast - by Material
- 6. Global APAC Packaging in Pharmaceutical Industry Analysis, Insights and Forecast, 2021-2033
- 6.1. Market Analysis, Insights and Forecast - by Material
- 6.1.1. Plastic
- 6.1.2. Paper and Paper Board
- 6.1.3. Glass
- 6.1.4. Aluminum Foil
- 6.2. Market Analysis, Insights and Forecast - by Type
- 6.2.1. Ampoules
- 6.2.2. Blister Packs
- 6.2.3. Plastic Bottles
- 6.2.4. Syringes
- 6.2.5. Vials
- 6.2.6. IV fluids
- 6.2.7. Other Types
- 6.3. Market Analysis, Insights and Forecast - by Drug Delivery Mode
- 6.3.1. Oral Drug packaging
- 6.3.2. Injectable Drug packaging
- 6.3.3. Pulmonary Drug Packaging
- 6.3.4. Other Drug Delivery Modes
- 6.1. Market Analysis, Insights and Forecast - by Material
- 7. North America APAC Packaging in Pharmaceutical Industry Analysis, Insights and Forecast, 2020-2032
- 7.1. Market Analysis, Insights and Forecast - by Material
- 7.1.1. Plastic
- 7.1.2. Paper and Paper Board
- 7.1.3. Glass
- 7.1.4. Aluminum Foil
- 7.2. Market Analysis, Insights and Forecast - by Type
- 7.2.1. Ampoules
- 7.2.2. Blister Packs
- 7.2.3. Plastic Bottles
- 7.2.4. Syringes
- 7.2.5. Vials
- 7.2.6. IV fluids
- 7.2.7. Other Types
- 7.3. Market Analysis, Insights and Forecast - by Drug Delivery Mode
- 7.3.1. Oral Drug packaging
- 7.3.2. Injectable Drug packaging
- 7.3.3. Pulmonary Drug Packaging
- 7.3.4. Other Drug Delivery Modes
- 7.1. Market Analysis, Insights and Forecast - by Material
- 8. South America APAC Packaging in Pharmaceutical Industry Analysis, Insights and Forecast, 2020-2032
- 8.1. Market Analysis, Insights and Forecast - by Material
- 8.1.1. Plastic
- 8.1.2. Paper and Paper Board
- 8.1.3. Glass
- 8.1.4. Aluminum Foil
- 8.2. Market Analysis, Insights and Forecast - by Type
- 8.2.1. Ampoules
- 8.2.2. Blister Packs
- 8.2.3. Plastic Bottles
- 8.2.4. Syringes
- 8.2.5. Vials
- 8.2.6. IV fluids
- 8.2.7. Other Types
- 8.3. Market Analysis, Insights and Forecast - by Drug Delivery Mode
- 8.3.1. Oral Drug packaging
- 8.3.2. Injectable Drug packaging
- 8.3.3. Pulmonary Drug Packaging
- 8.3.4. Other Drug Delivery Modes
- 8.1. Market Analysis, Insights and Forecast - by Material
- 9. Europe APAC Packaging in Pharmaceutical Industry Analysis, Insights and Forecast, 2020-2032
- 9.1. Market Analysis, Insights and Forecast - by Material
- 9.1.1. Plastic
- 9.1.2. Paper and Paper Board
- 9.1.3. Glass
- 9.1.4. Aluminum Foil
- 9.2. Market Analysis, Insights and Forecast - by Type
- 9.2.1. Ampoules
- 9.2.2. Blister Packs
- 9.2.3. Plastic Bottles
- 9.2.4. Syringes
- 9.2.5. Vials
- 9.2.6. IV fluids
- 9.2.7. Other Types
- 9.3. Market Analysis, Insights and Forecast - by Drug Delivery Mode
- 9.3.1. Oral Drug packaging
- 9.3.2. Injectable Drug packaging
- 9.3.3. Pulmonary Drug Packaging
- 9.3.4. Other Drug Delivery Modes
- 9.1. Market Analysis, Insights and Forecast - by Material
- 10. Middle East & Africa APAC Packaging in Pharmaceutical Industry Analysis, Insights and Forecast, 2020-2032
- 10.1. Market Analysis, Insights and Forecast - by Material
- 10.1.1. Plastic
- 10.1.2. Paper and Paper Board
- 10.1.3. Glass
- 10.1.4. Aluminum Foil
- 10.2. Market Analysis, Insights and Forecast - by Type
- 10.2.1. Ampoules
- 10.2.2. Blister Packs
- 10.2.3. Plastic Bottles
- 10.2.4. Syringes
- 10.2.5. Vials
- 10.2.6. IV fluids
- 10.2.7. Other Types
- 10.3. Market Analysis, Insights and Forecast - by Drug Delivery Mode
- 10.3.1. Oral Drug packaging
- 10.3.2. Injectable Drug packaging
- 10.3.3. Pulmonary Drug Packaging
- 10.3.4. Other Drug Delivery Modes
- 10.1. Market Analysis, Insights and Forecast - by Material
- 11. Asia Pacific APAC Packaging in Pharmaceutical Industry Analysis, Insights and Forecast, 2020-2032
- 11.1. Market Analysis, Insights and Forecast - by Material
- 11.1.1. Plastic
- 11.1.2. Paper and Paper Board
- 11.1.3. Glass
- 11.1.4. Aluminum Foil
- 11.2. Market Analysis, Insights and Forecast - by Type
- 11.2.1. Ampoules
- 11.2.2. Blister Packs
- 11.2.3. Plastic Bottles
- 11.2.4. Syringes
- 11.2.5. Vials
- 11.2.6. IV fluids
- 11.2.7. Other Types
- 11.3. Market Analysis, Insights and Forecast - by Drug Delivery Mode
- 11.3.1. Oral Drug packaging
- 11.3.2. Injectable Drug packaging
- 11.3.3. Pulmonary Drug Packaging
- 11.3.4. Other Drug Delivery Modes
- 11.1. Market Analysis, Insights and Forecast - by Material
- 12. Competitive Analysis
- 12.1. Company Profiles
- 12.1.1 West Pharmaceutical Services Inc
- 12.1.1.1. Company Overview
- 12.1.1.2. Products
- 12.1.1.3. Company Financials
- 12.1.1.4. SWOT Analysis
- 12.1.2 Catalent Pharma Solutions Inc
- 12.1.2.1. Company Overview
- 12.1.2.2. Products
- 12.1.2.3. Company Financials
- 12.1.2.4. SWOT Analysis
- 12.1.3 Wihuri Group
- 12.1.3.1. Company Overview
- 12.1.3.2. Products
- 12.1.3.3. Company Financials
- 12.1.3.4. SWOT Analysis
- 12.1.4 Klockner Pentaplast Group
- 12.1.4.1. Company Overview
- 12.1.4.2. Products
- 12.1.4.3. Company Financials
- 12.1.4.4. SWOT Analysis
- 12.1.5 Schott AG
- 12.1.5.1. Company Overview
- 12.1.5.2. Products
- 12.1.5.3. Company Financials
- 12.1.5.4. SWOT Analysis
- 12.1.6 NIPRO Corporation
- 12.1.6.1. Company Overview
- 12.1.6.2. Products
- 12.1.6.3. Company Financials
- 12.1.6.4. SWOT Analysis
- 12.1.7 CCL Industries Inc
- 12.1.7.1. Company Overview
- 12.1.7.2. Products
- 12.1.7.3. Company Financials
- 12.1.7.4. SWOT Analysis
- 12.1.8 Gerresheimer AG
- 12.1.8.1. Company Overview
- 12.1.8.2. Products
- 12.1.8.3. Company Financials
- 12.1.8.4. SWOT Analysis
- 12.1.9 Berry Global Group Inc *List Not Exhaustive
- 12.1.9.1. Company Overview
- 12.1.9.2. Products
- 12.1.9.3. Company Financials
- 12.1.9.4. SWOT Analysis
- 12.1.10 Amcor Ltd
- 12.1.10.1. Company Overview
- 12.1.10.2. Products
- 12.1.10.3. Company Financials
- 12.1.10.4. SWOT Analysis
- 12.1.1 West Pharmaceutical Services Inc
- 12.2. Market Entropy
- 12.2.1 Company's Key Areas Served
- 12.2.2 Recent Developments
- 12.3. Company Market Share Analysis 2025
- 12.3.1 Top 5 Companies Market Share Analysis
- 12.3.2 Top 3 Companies Market Share Analysis
- 12.4. List of Potential Customers
- 13. Research Methodology
List of Figures
- Figure 1: Global APAC Packaging in Pharmaceutical Industry Revenue Breakdown (Million, %) by Region 2025 & 2033
- Figure 2: North America APAC Packaging in Pharmaceutical Industry Revenue (Million), by Material 2025 & 2033
- Figure 3: North America APAC Packaging in Pharmaceutical Industry Revenue Share (%), by Material 2025 & 2033
- Figure 4: North America APAC Packaging in Pharmaceutical Industry Revenue (Million), by Type 2025 & 2033
- Figure 5: North America APAC Packaging in Pharmaceutical Industry Revenue Share (%), by Type 2025 & 2033
- Figure 6: North America APAC Packaging in Pharmaceutical Industry Revenue (Million), by Drug Delivery Mode 2025 & 2033
- Figure 7: North America APAC Packaging in Pharmaceutical Industry Revenue Share (%), by Drug Delivery Mode 2025 & 2033
- Figure 8: North America APAC Packaging in Pharmaceutical Industry Revenue (Million), by Country 2025 & 2033
- Figure 9: North America APAC Packaging in Pharmaceutical Industry Revenue Share (%), by Country 2025 & 2033
- Figure 10: South America APAC Packaging in Pharmaceutical Industry Revenue (Million), by Material 2025 & 2033
- Figure 11: South America APAC Packaging in Pharmaceutical Industry Revenue Share (%), by Material 2025 & 2033
- Figure 12: South America APAC Packaging in Pharmaceutical Industry Revenue (Million), by Type 2025 & 2033
- Figure 13: South America APAC Packaging in Pharmaceutical Industry Revenue Share (%), by Type 2025 & 2033
- Figure 14: South America APAC Packaging in Pharmaceutical Industry Revenue (Million), by Drug Delivery Mode 2025 & 2033
- Figure 15: South America APAC Packaging in Pharmaceutical Industry Revenue Share (%), by Drug Delivery Mode 2025 & 2033
- Figure 16: South America APAC Packaging in Pharmaceutical Industry Revenue (Million), by Country 2025 & 2033
- Figure 17: South America APAC Packaging in Pharmaceutical Industry Revenue Share (%), by Country 2025 & 2033
- Figure 18: Europe APAC Packaging in Pharmaceutical Industry Revenue (Million), by Material 2025 & 2033
- Figure 19: Europe APAC Packaging in Pharmaceutical Industry Revenue Share (%), by Material 2025 & 2033
- Figure 20: Europe APAC Packaging in Pharmaceutical Industry Revenue (Million), by Type 2025 & 2033
- Figure 21: Europe APAC Packaging in Pharmaceutical Industry Revenue Share (%), by Type 2025 & 2033
- Figure 22: Europe APAC Packaging in Pharmaceutical Industry Revenue (Million), by Drug Delivery Mode 2025 & 2033
- Figure 23: Europe APAC Packaging in Pharmaceutical Industry Revenue Share (%), by Drug Delivery Mode 2025 & 2033
- Figure 24: Europe APAC Packaging in Pharmaceutical Industry Revenue (Million), by Country 2025 & 2033
- Figure 25: Europe APAC Packaging in Pharmaceutical Industry Revenue Share (%), by Country 2025 & 2033
- Figure 26: Middle East & Africa APAC Packaging in Pharmaceutical Industry Revenue (Million), by Material 2025 & 2033
- Figure 27: Middle East & Africa APAC Packaging in Pharmaceutical Industry Revenue Share (%), by Material 2025 & 2033
- Figure 28: Middle East & Africa APAC Packaging in Pharmaceutical Industry Revenue (Million), by Type 2025 & 2033
- Figure 29: Middle East & Africa APAC Packaging in Pharmaceutical Industry Revenue Share (%), by Type 2025 & 2033
- Figure 30: Middle East & Africa APAC Packaging in Pharmaceutical Industry Revenue (Million), by Drug Delivery Mode 2025 & 2033
- Figure 31: Middle East & Africa APAC Packaging in Pharmaceutical Industry Revenue Share (%), by Drug Delivery Mode 2025 & 2033
- Figure 32: Middle East & Africa APAC Packaging in Pharmaceutical Industry Revenue (Million), by Country 2025 & 2033
- Figure 33: Middle East & Africa APAC Packaging in Pharmaceutical Industry Revenue Share (%), by Country 2025 & 2033
- Figure 34: Asia Pacific APAC Packaging in Pharmaceutical Industry Revenue (Million), by Material 2025 & 2033
- Figure 35: Asia Pacific APAC Packaging in Pharmaceutical Industry Revenue Share (%), by Material 2025 & 2033
- Figure 36: Asia Pacific APAC Packaging in Pharmaceutical Industry Revenue (Million), by Type 2025 & 2033
- Figure 37: Asia Pacific APAC Packaging in Pharmaceutical Industry Revenue Share (%), by Type 2025 & 2033
- Figure 38: Asia Pacific APAC Packaging in Pharmaceutical Industry Revenue (Million), by Drug Delivery Mode 2025 & 2033
- Figure 39: Asia Pacific APAC Packaging in Pharmaceutical Industry Revenue Share (%), by Drug Delivery Mode 2025 & 2033
- Figure 40: Asia Pacific APAC Packaging in Pharmaceutical Industry Revenue (Million), by Country 2025 & 2033
- Figure 41: Asia Pacific APAC Packaging in Pharmaceutical Industry Revenue Share (%), by Country 2025 & 2033
List of Tables
- Table 1: Global APAC Packaging in Pharmaceutical Industry Revenue Million Forecast, by Material 2020 & 2033
- Table 2: Global APAC Packaging in Pharmaceutical Industry Revenue Million Forecast, by Type 2020 & 2033
- Table 3: Global APAC Packaging in Pharmaceutical Industry Revenue Million Forecast, by Drug Delivery Mode 2020 & 2033
- Table 4: Global APAC Packaging in Pharmaceutical Industry Revenue Million Forecast, by Region 2020 & 2033
- Table 5: Global APAC Packaging in Pharmaceutical Industry Revenue Million Forecast, by Material 2020 & 2033
- Table 6: Global APAC Packaging in Pharmaceutical Industry Revenue Million Forecast, by Type 2020 & 2033
- Table 7: Global APAC Packaging in Pharmaceutical Industry Revenue Million Forecast, by Drug Delivery Mode 2020 & 2033
- Table 8: Global APAC Packaging in Pharmaceutical Industry Revenue Million Forecast, by Country 2020 & 2033
- Table 9: United States APAC Packaging in Pharmaceutical Industry Revenue (Million) Forecast, by Application 2020 & 2033
- Table 10: Canada APAC Packaging in Pharmaceutical Industry Revenue (Million) Forecast, by Application 2020 & 2033
- Table 11: Mexico APAC Packaging in Pharmaceutical Industry Revenue (Million) Forecast, by Application 2020 & 2033
- Table 12: Global APAC Packaging in Pharmaceutical Industry Revenue Million Forecast, by Material 2020 & 2033
- Table 13: Global APAC Packaging in Pharmaceutical Industry Revenue Million Forecast, by Type 2020 & 2033
- Table 14: Global APAC Packaging in Pharmaceutical Industry Revenue Million Forecast, by Drug Delivery Mode 2020 & 2033
- Table 15: Global APAC Packaging in Pharmaceutical Industry Revenue Million Forecast, by Country 2020 & 2033
- Table 16: Brazil APAC Packaging in Pharmaceutical Industry Revenue (Million) Forecast, by Application 2020 & 2033
- Table 17: Argentina APAC Packaging in Pharmaceutical Industry Revenue (Million) Forecast, by Application 2020 & 2033
- Table 18: Rest of South America APAC Packaging in Pharmaceutical Industry Revenue (Million) Forecast, by Application 2020 & 2033
- Table 19: Global APAC Packaging in Pharmaceutical Industry Revenue Million Forecast, by Material 2020 & 2033
- Table 20: Global APAC Packaging in Pharmaceutical Industry Revenue Million Forecast, by Type 2020 & 2033
- Table 21: Global APAC Packaging in Pharmaceutical Industry Revenue Million Forecast, by Drug Delivery Mode 2020 & 2033
- Table 22: Global APAC Packaging in Pharmaceutical Industry Revenue Million Forecast, by Country 2020 & 2033
- Table 23: United Kingdom APAC Packaging in Pharmaceutical Industry Revenue (Million) Forecast, by Application 2020 & 2033
- Table 24: Germany APAC Packaging in Pharmaceutical Industry Revenue (Million) Forecast, by Application 2020 & 2033
- Table 25: France APAC Packaging in Pharmaceutical Industry Revenue (Million) Forecast, by Application 2020 & 2033
- Table 26: Italy APAC Packaging in Pharmaceutical Industry Revenue (Million) Forecast, by Application 2020 & 2033
- Table 27: Spain APAC Packaging in Pharmaceutical Industry Revenue (Million) Forecast, by Application 2020 & 2033
- Table 28: Russia APAC Packaging in Pharmaceutical Industry Revenue (Million) Forecast, by Application 2020 & 2033
- Table 29: Benelux APAC Packaging in Pharmaceutical Industry Revenue (Million) Forecast, by Application 2020 & 2033
- Table 30: Nordics APAC Packaging in Pharmaceutical Industry Revenue (Million) Forecast, by Application 2020 & 2033
- Table 31: Rest of Europe APAC Packaging in Pharmaceutical Industry Revenue (Million) Forecast, by Application 2020 & 2033
- Table 32: Global APAC Packaging in Pharmaceutical Industry Revenue Million Forecast, by Material 2020 & 2033
- Table 33: Global APAC Packaging in Pharmaceutical Industry Revenue Million Forecast, by Type 2020 & 2033
- Table 34: Global APAC Packaging in Pharmaceutical Industry Revenue Million Forecast, by Drug Delivery Mode 2020 & 2033
- Table 35: Global APAC Packaging in Pharmaceutical Industry Revenue Million Forecast, by Country 2020 & 2033
- Table 36: Turkey APAC Packaging in Pharmaceutical Industry Revenue (Million) Forecast, by Application 2020 & 2033
- Table 37: Israel APAC Packaging in Pharmaceutical Industry Revenue (Million) Forecast, by Application 2020 & 2033
- Table 38: GCC APAC Packaging in Pharmaceutical Industry Revenue (Million) Forecast, by Application 2020 & 2033
- Table 39: North Africa APAC Packaging in Pharmaceutical Industry Revenue (Million) Forecast, by Application 2020 & 2033
- Table 40: South Africa APAC Packaging in Pharmaceutical Industry Revenue (Million) Forecast, by Application 2020 & 2033
- Table 41: Rest of Middle East & Africa APAC Packaging in Pharmaceutical Industry Revenue (Million) Forecast, by Application 2020 & 2033
- Table 42: Global APAC Packaging in Pharmaceutical Industry Revenue Million Forecast, by Material 2020 & 2033
- Table 43: Global APAC Packaging in Pharmaceutical Industry Revenue Million Forecast, by Type 2020 & 2033
- Table 44: Global APAC Packaging in Pharmaceutical Industry Revenue Million Forecast, by Drug Delivery Mode 2020 & 2033
- Table 45: Global APAC Packaging in Pharmaceutical Industry Revenue Million Forecast, by Country 2020 & 2033
- Table 46: China APAC Packaging in Pharmaceutical Industry Revenue (Million) Forecast, by Application 2020 & 2033
- Table 47: India APAC Packaging in Pharmaceutical Industry Revenue (Million) Forecast, by Application 2020 & 2033
- Table 48: Japan APAC Packaging in Pharmaceutical Industry Revenue (Million) Forecast, by Application 2020 & 2033
- Table 49: South Korea APAC Packaging in Pharmaceutical Industry Revenue (Million) Forecast, by Application 2020 & 2033
- Table 50: ASEAN APAC Packaging in Pharmaceutical Industry Revenue (Million) Forecast, by Application 2020 & 2033
- Table 51: Oceania APAC Packaging in Pharmaceutical Industry Revenue (Million) Forecast, by Application 2020 & 2033
- Table 52: Rest of Asia Pacific APAC Packaging in Pharmaceutical Industry Revenue (Million) Forecast, by Application 2020 & 2033
Frequently Asked Questions
1. What is the projected Compound Annual Growth Rate (CAGR) of the APAC Packaging in Pharmaceutical Industry?
The projected CAGR is approximately 6.99%.
2. Which companies are prominent players in the APAC Packaging in Pharmaceutical Industry?
Key companies in the market include West Pharmaceutical Services Inc, Catalent Pharma Solutions Inc, Wihuri Group, Klockner Pentaplast Group, Schott AG, NIPRO Corporation, CCL Industries Inc, Gerresheimer AG, Berry Global Group Inc *List Not Exhaustive, Amcor Ltd.
3. What are the main segments of the APAC Packaging in Pharmaceutical Industry?
The market segments include Material, Type, Drug Delivery Mode.
4. Can you provide details about the market size?
The market size is estimated to be USD 41.66 Million as of 2022.
5. What are some drivers contributing to market growth?
Increasing Adoption of Pharmaceutical Packaging in Emerging Economies.
6. What are the notable trends driving market growth?
Glass Packaging is Expected to Witness Significant Growth.
7. Are there any restraints impacting market growth?
Fluctuations in Raw Material Cost.
8. Can you provide examples of recent developments in the market?
October 2023 - Sonoco ThermoSafe’s branded product has played a role in increasing pharmaceutical shipments in/out of the Asia Pacific (APAC) region. According to the temperature assurance packaging company, the Pegasus ULD performs up to 300+ hours, equivalent to 13 days without human intervention, providing temperature control for 2-8°C payloads.
9. What pricing options are available for accessing the report?
Pricing options include single-user, multi-user, and enterprise licenses priced at USD 4750, USD 4950, and USD 6800 respectively.
10. Is the market size provided in terms of value or volume?
The market size is provided in terms of value, measured in Million.
11. Are there any specific market keywords associated with the report?
Yes, the market keyword associated with the report is "APAC Packaging in Pharmaceutical Industry," which aids in identifying and referencing the specific market segment covered.
12. How do I determine which pricing option suits my needs best?
The pricing options vary based on user requirements and access needs. Individual users may opt for single-user licenses, while businesses requiring broader access may choose multi-user or enterprise licenses for cost-effective access to the report.
13. Are there any additional resources or data provided in the APAC Packaging in Pharmaceutical Industry report?
While the report offers comprehensive insights, it's advisable to review the specific contents or supplementary materials provided to ascertain if additional resources or data are available.
14. How can I stay updated on further developments or reports in the APAC Packaging in Pharmaceutical Industry?
To stay informed about further developments, trends, and reports in the APAC Packaging in Pharmaceutical Industry, consider subscribing to industry newsletters, following relevant companies and organizations, or regularly checking reputable industry news sources and publications.
Methodology
Step 1 - Identification of Relevant Samples Size from Population Database


Step 2 - Approaches for Defining Global Market Size (Value, Volume* & Price*)

Note*: In applicable scenarios
Step 3 - Data Sources
Primary Research
- Web Analytics
- Survey Reports
- Research Institute
- Latest Research Reports
- Opinion Leaders
Secondary Research
- Annual Reports
- White Paper
- Latest Press Release
- Industry Association
- Paid Database
- Investor Presentations

Step 4 - Data Triangulation
Involves using different sources of information in order to increase the validity of a study
These sources are likely to be stakeholders in a program - participants, other researchers, program staff, other community members, and so on.
Then we put all data in single framework & apply various statistical tools to find out the dynamic on the market.
During the analysis stage, feedback from the stakeholder groups would be compared to determine areas of agreement as well as areas of divergence