

Key Insights
The Asia-Pacific (APAC) wireless charging market is experiencing substantial growth, propelled by the expanding electric vehicle (EV) sector and rising consumer preference for convenient charging. With a projected Compound Annual Growth Rate (CAGR) of 36.2%, the market is set to reach a size of 24.4 billion by 2025. This expansion is attributed to supportive government initiatives for EV adoption, particularly in key markets like China, Japan, and India, alongside increasing disposable incomes and advancements in wireless charging technology. Key trends include component miniaturization, integration with smart home systems, and the development of high-power charging solutions to mitigate EV range anxiety. Ongoing research and development are actively addressing challenges such as initial infrastructure costs and safety concerns.
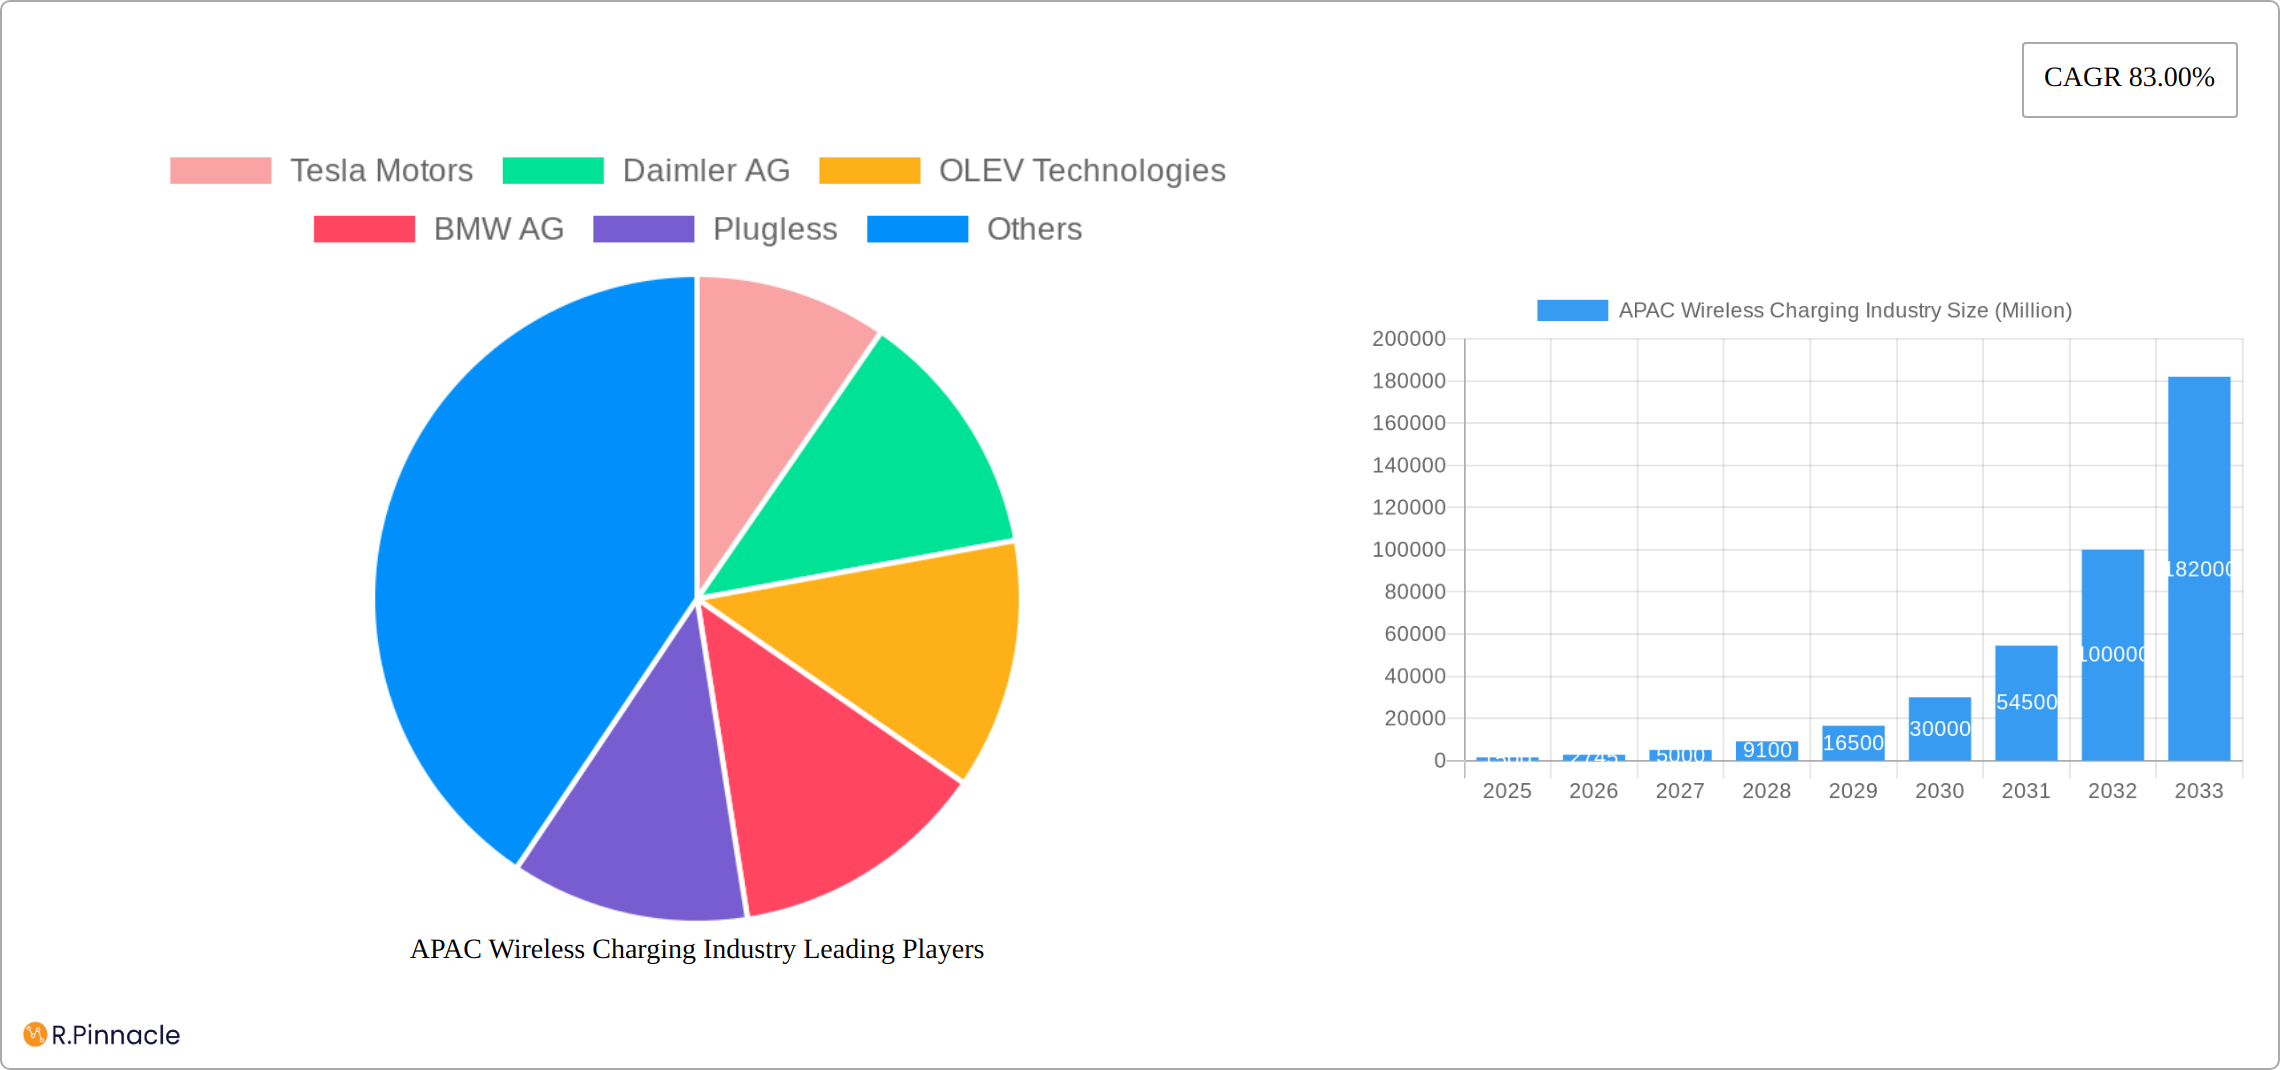
APAC Wireless Charging Industry Market Size (In Billion)
This robust growth trajectory is expected to continue throughout the forecast period. China is anticipated to maintain its leading position due to its significant EV market and favorable policies, while India and other Southeast Asian nations present considerable growth potential as EV adoption accelerates. Segmentation by vehicle type shows that Battery Electric Vehicles (BEVs) are expected to drive a larger share of wireless charging adoption compared to Plug-in Hybrid Vehicles (PHEVs). The sustained expansion of the APAC EV industry, coupled with technological innovations in wireless charging, positions the region as a pivotal growth engine for the global market. Intense competition among established automotive manufacturers and specialized technology firms will foster further innovation and market expansion.
APAC Wireless Charging Industry Company Market Share
This report offers a comprehensive analysis of the APAC wireless charging industry, providing critical insights for industry professionals, investors, and strategists. Covering the period from 2019 to 2033, with a specific focus on 2025, this report meticulously examines market dynamics, technological advancements, and key players. Expect detailed segmentation by vehicle type (Battery Electric Vehicle, Plug-in Hybrid Vehicle) and country (China, Japan, India, Australia, Rest of Asia-Pacific), alongside robust financial projections.
APAC Wireless Charging Industry Market Structure & Innovation Trends
The APAC wireless charging market is characterized by a dynamic interplay of established automotive giants and innovative technology companies. Market concentration is moderate, with key players like Tesla Motors, Daimler AG, and BMW AG holding significant shares, but a competitive landscape is emerging with companies like Qualcomm and WiTricity driving innovation. The market share of these leading companies fluctuates depending on successful product launches and strategic partnerships. For example, Tesla’s market share in 2025 is estimated at xx%, while Daimler AG holds approximately xx%. Innovation is driven by advancements in wireless power transfer technology, increasing demand for electric vehicles (EVs), and supportive government policies promoting sustainable transportation. Regulatory frameworks vary across countries, influencing adoption rates. Product substitutes, such as wired charging, continue to compete, but wireless charging offers convenience and aesthetics that are driving adoption. The sector has seen several significant mergers and acquisitions (M&A) in recent years, with deal values totaling approximately $xx Million in the last five years. This activity highlights the strategic importance of wireless charging technology.
- Key Players Market Share (2025 Estimate): Tesla Motors (xx%), Daimler AG (xx%), BMW AG (xx%), Qualcomm (xx%), Others (xx%).
- M&A Activity (2019-2024): Total deal value: $xx Million. Number of deals: xx.
APAC Wireless Charging Industry Market Dynamics & Trends
The APAC wireless charging market is experiencing robust growth, driven by several key factors. The rising adoption of electric vehicles (EVs) across the region is a primary catalyst, fueling demand for convenient and efficient charging solutions. Technological advancements leading to higher power transfer efficiencies and improved range are also contributing to market expansion. Consumer preferences are shifting towards seamless and user-friendly charging experiences, further propelling market growth. The competitive landscape is intense, with companies vying for market share through product innovation and strategic partnerships. The Compound Annual Growth Rate (CAGR) for the APAC wireless charging market is projected to be xx% during the forecast period (2025-2033). Market penetration is expected to increase from xx% in 2025 to xx% by 2033. Technological disruptions, such as advancements in resonant inductive coupling and magnetic resonance coupling, are continuously improving the efficiency and range of wireless charging systems. These technological advancements significantly contribute to the overall market growth and enhance the user experience.
Dominant Regions & Segments in APAC Wireless Charging Industry
China dominates the APAC wireless charging market, driven by its large EV market and supportive government policies promoting electric mobility. Japan follows as a significant market, owing to its advanced technology sector and established automotive industry. India and Australia exhibit promising growth potential, with increasing EV adoption and government initiatives.
- China: Large EV market, supportive government policies, robust manufacturing base.
- Japan: Advanced technology sector, established automotive industry, high consumer adoption rate.
- India: Growing EV market, government incentives, large population base.
- Australia: Increasing EV adoption, government investments in charging infrastructure.
- Rest of Asia-Pacific: Variable growth rates depending on individual country policies and market maturity.
The Battery Electric Vehicle (BEV) segment currently holds the largest market share within the vehicle type segment, reflecting the global trend toward fully electric vehicles. However, the Plug-in Hybrid Vehicle (PHEV) segment is also showing significant growth, as consumers seek a balance between electric driving and fuel efficiency.
APAC Wireless Charging Industry Product Innovations
The APAC wireless charging market is experiencing a surge in product innovation, driven by the increasing demand for efficient, convenient, and safe charging solutions. Recent advancements focus on significantly boosting charging efficiency and power delivery, expanding charging range, and enhancing safety protocols. A key trend is the development of higher-power wireless charging systems specifically designed to meet the needs of electric vehicles (EVs) with larger battery capacities. This involves notable progress in both resonant and non-resonant inductive coupling techniques, coupled with refined coil designs and improved power electronics. Furthermore, designers are prioritizing seamless integration into vehicle interiors, prioritizing aesthetics and an enhanced user experience. This includes advancements in thermal management to prevent overheating and ensure long-term reliability.
Report Scope & Segmentation Analysis
This report segments the APAC wireless charging market by vehicle type (Battery Electric Vehicle and Plug-in Hybrid Vehicle) and by country (China, Japan, India, Australia, and Rest of Asia-Pacific). Each segment’s growth projections, market size, and competitive dynamics are analyzed in detail. The BEV segment is projected to experience faster growth than the PHEV segment due to increasing BEV sales. China continues to lead in market size among all countries, primarily driven by its large and rapidly developing EV market. Market size forecasts for each segment are provided for the period 2025-2033.
Key Drivers of APAC Wireless Charging Industry Growth
The robust growth of the APAC wireless charging industry is fueled by a convergence of powerful factors. The explosive expansion of the EV market in the region is a primary driver, creating significant demand for convenient charging infrastructure. Government initiatives promoting sustainable transportation and actively reducing carbon emissions are providing crucial support through subsidies, tax incentives, and supportive regulations. The inherent convenience and user-friendly nature of wireless charging are also key attractors, appealing to consumers seeking a hassle-free charging experience. Finally, the continuous stream of technological advancements, resulting in improved efficiency, increased power delivery, and extended charging range, are further propelling market expansion.
Challenges in the APAC Wireless Charging Industry Sector
The industry faces challenges such as the relatively high cost of wireless charging systems compared to wired charging, concerns about the efficiency and range of wireless charging technology, and the need for standardization across different wireless charging systems. Supply chain disruptions and the potential for interoperability issues between different systems also pose challenges.
Emerging Opportunities in APAP Wireless Charging Industry
Emerging opportunities exist in the development of higher-power wireless charging systems, the integration of wireless charging into public spaces and charging stations, and the expansion of wireless charging into new applications beyond the automotive sector. This includes opportunities in consumer electronics, medical devices, and industrial applications.
Leading Players in the APAP Wireless Charging Industry Market
- Tesla Motors
- Daimler AG
- OLEV Technologies
- BMW AG
- Plugless
- Bombardier
- Toyota Motor Corporation
- Nissan
- Hella Aglaia
- HEVO Powe
- WiTricity
- Qualcomm
Key Developments in APAC Wireless Charging Industry
- June 2023: STMicroelectronics NV unveiled a 100W Wireless Charging Solution at MWC Shanghai, showcasing cutting-edge advancements in wireless power transfer technology and highlighting the industry's commitment to higher power capabilities.
- June 2023: SAIC-GM launched the Buick Electra E5, incorporating an innovative battery management system with integrated wireless connectivity, signifying a significant leap in system integration and user experience.
- May 2023: EVE Energy invested USD 422.3 Million in a Malaysian project, underscoring the substantial investments flowing into the APAC wireless charging ecosystem and reflecting the positive impact of supportive government policies on attracting foreign direct investment.
- [Add another recent development here with date and brief description]
Future Outlook for APAC Wireless Charging Industry Market
The future of the APAC wireless charging market is exceptionally promising, with significant growth projected in the coming years. This positive outlook is firmly grounded in the continued expansion of the EV market, the ongoing development of more efficient and powerful wireless charging technologies, and the sustained support of government policies promoting sustainable transportation. Strategic collaborations between industry players, a relentless focus on product innovation, and the expansion of wireless charging applications beyond EVs (e.g., consumer electronics, wearables) will be crucial in shaping the industry's trajectory. The ultimate success of the market hinges on the development and widespread adoption of highly efficient, high-power wireless charging solutions that seamlessly integrate into consumers' lives, thereby accelerating the global shift towards electric mobility and a more sustainable future.
APAC Wireless Charging Industry Segmentation
-
1. Vehicle Type
- 1.1. Battery Electric Vehicle
- 1.2. Plug-in Hybrid Vehicle
APAC Wireless Charging Industry Segmentation By Geography
-
1. North America
- 1.1. United States
- 1.2. Canada
- 1.3. Mexico
-
2. South America
- 2.1. Brazil
- 2.2. Argentina
- 2.3. Rest of South America
-
3. Europe
- 3.1. United Kingdom
- 3.2. Germany
- 3.3. France
- 3.4. Italy
- 3.5. Spain
- 3.6. Russia
- 3.7. Benelux
- 3.8. Nordics
- 3.9. Rest of Europe
-
4. Middle East & Africa
- 4.1. Turkey
- 4.2. Israel
- 4.3. GCC
- 4.4. North Africa
- 4.5. South Africa
- 4.6. Rest of Middle East & Africa
-
5. Asia Pacific
- 5.1. China
- 5.2. India
- 5.3. Japan
- 5.4. South Korea
- 5.5. ASEAN
- 5.6. Oceania
- 5.7. Rest of Asia Pacific
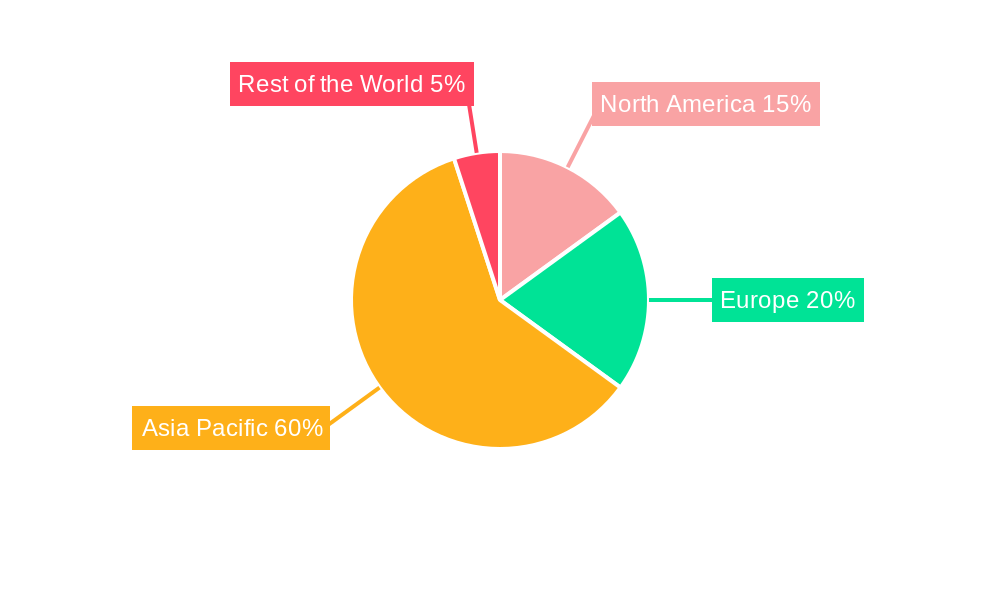
APAC Wireless Charging Industry Regional Market Share
Geographic Coverage of APAC Wireless Charging Industry
APAC Wireless Charging Industry REPORT HIGHLIGHTS
| Aspects | Details |
|---|---|
| Study Period | 2020-2034 |
| Base Year | 2025 |
| Estimated Year | 2026 |
| Forecast Period | 2026-2034 |
| Historical Period | 2020-2025 |
| Growth Rate | CAGR of 36.2% from 2020-2034 |
| Segmentation |
|
Table of Contents
- 1. Introduction
- 1.1. Research Scope
- 1.2. Market Segmentation
- 1.3. Research Objective
- 1.4. Definitions and Assumptions
- 2. Executive Summary
- 2.1. Market Snapshot
- 3. Market Dynamics
- 3.1. Market Drivers
- 3.2. Market Restrains
- 3.3. Market Trends
- 3.4. Market Opportunities
- 4. Market Factor Analysis
- 4.1. Porters Five Forces
- 4.1.1. Bargaining Power of Suppliers
- 4.1.2. Bargaining Power of Buyers
- 4.1.3. Threat of New Entrants
- 4.1.4. Threat of Substitutes
- 4.1.5. Competitive Rivalry
- 4.2. PESTEL analysis
- 4.3. BCG Analysis
- 4.3.1. Stars (High Growth, High Market Share)
- 4.3.2. Cash Cows (Low Growth, High Market Share)
- 4.3.3. Question Mark (High Growth, Low Market Share)
- 4.3.4. Dogs (Low Growth, Low Market Share)
- 4.4. Ansoff Matrix Analysis
- 4.5. Supply Chain Analysis
- 4.6. Regulatory Landscape
- 4.7. Current Market Potential and Opportunity Assessment (TAM–SAM–SOM Framework)
- 4.8. PRI Analyst Note
- 4.1. Porters Five Forces
- 5. Market Analysis, Insights and Forecast 2021-2033
- 5.1. Market Analysis, Insights and Forecast - by Vehicle Type
- 5.1.1. Battery Electric Vehicle
- 5.1.2. Plug-in Hybrid Vehicle
- 5.2. Market Analysis, Insights and Forecast - by Region
- 5.2.1. North America
- 5.2.2. South America
- 5.2.3. Europe
- 5.2.4. Middle East & Africa
- 5.2.5. Asia Pacific
- 5.1. Market Analysis, Insights and Forecast - by Vehicle Type
- 6. Global APAC Wireless Charging Industry Analysis, Insights and Forecast, 2021-2033
- 6.1. Market Analysis, Insights and Forecast - by Vehicle Type
- 6.1.1. Battery Electric Vehicle
- 6.1.2. Plug-in Hybrid Vehicle
- 6.1. Market Analysis, Insights and Forecast - by Vehicle Type
- 7. North America APAC Wireless Charging Industry Analysis, Insights and Forecast, 2020-2032
- 7.1. Market Analysis, Insights and Forecast - by Vehicle Type
- 7.1.1. Battery Electric Vehicle
- 7.1.2. Plug-in Hybrid Vehicle
- 7.1. Market Analysis, Insights and Forecast - by Vehicle Type
- 8. South America APAC Wireless Charging Industry Analysis, Insights and Forecast, 2020-2032
- 8.1. Market Analysis, Insights and Forecast - by Vehicle Type
- 8.1.1. Battery Electric Vehicle
- 8.1.2. Plug-in Hybrid Vehicle
- 8.1. Market Analysis, Insights and Forecast - by Vehicle Type
- 9. Europe APAC Wireless Charging Industry Analysis, Insights and Forecast, 2020-2032
- 9.1. Market Analysis, Insights and Forecast - by Vehicle Type
- 9.1.1. Battery Electric Vehicle
- 9.1.2. Plug-in Hybrid Vehicle
- 9.1. Market Analysis, Insights and Forecast - by Vehicle Type
- 10. Middle East & Africa APAC Wireless Charging Industry Analysis, Insights and Forecast, 2020-2032
- 10.1. Market Analysis, Insights and Forecast - by Vehicle Type
- 10.1.1. Battery Electric Vehicle
- 10.1.2. Plug-in Hybrid Vehicle
- 10.1. Market Analysis, Insights and Forecast - by Vehicle Type
- 11. Asia Pacific APAC Wireless Charging Industry Analysis, Insights and Forecast, 2020-2032
- 11.1. Market Analysis, Insights and Forecast - by Vehicle Type
- 11.1.1. Battery Electric Vehicle
- 11.1.2. Plug-in Hybrid Vehicle
- 11.1. Market Analysis, Insights and Forecast - by Vehicle Type
- 12. Competitive Analysis
- 12.1. Company Profiles
- 12.1.1 Tesla Motors
- 12.1.1.1. Company Overview
- 12.1.1.2. Products
- 12.1.1.3. Company Financials
- 12.1.1.4. SWOT Analysis
- 12.1.2 Daimler AG
- 12.1.2.1. Company Overview
- 12.1.2.2. Products
- 12.1.2.3. Company Financials
- 12.1.2.4. SWOT Analysis
- 12.1.3 OLEV Technologies
- 12.1.3.1. Company Overview
- 12.1.3.2. Products
- 12.1.3.3. Company Financials
- 12.1.3.4. SWOT Analysis
- 12.1.4 BMW AG
- 12.1.4.1. Company Overview
- 12.1.4.2. Products
- 12.1.4.3. Company Financials
- 12.1.4.4. SWOT Analysis
- 12.1.5 Plugless
- 12.1.5.1. Company Overview
- 12.1.5.2. Products
- 12.1.5.3. Company Financials
- 12.1.5.4. SWOT Analysis
- 12.1.6 Bombardier
- 12.1.6.1. Company Overview
- 12.1.6.2. Products
- 12.1.6.3. Company Financials
- 12.1.6.4. SWOT Analysis
- 12.1.7 Toyota Motor Corporation
- 12.1.7.1. Company Overview
- 12.1.7.2. Products
- 12.1.7.3. Company Financials
- 12.1.7.4. SWOT Analysis
- 12.1.8 Nissan
- 12.1.8.1. Company Overview
- 12.1.8.2. Products
- 12.1.8.3. Company Financials
- 12.1.8.4. SWOT Analysis
- 12.1.9 Hella Aglaia
- 12.1.9.1. Company Overview
- 12.1.9.2. Products
- 12.1.9.3. Company Financials
- 12.1.9.4. SWOT Analysis
- 12.1.10 HEVO Powe
- 12.1.10.1. Company Overview
- 12.1.10.2. Products
- 12.1.10.3. Company Financials
- 12.1.10.4. SWOT Analysis
- 12.1.11 WiTricity
- 12.1.11.1. Company Overview
- 12.1.11.2. Products
- 12.1.11.3. Company Financials
- 12.1.11.4. SWOT Analysis
- 12.1.12 Qualcomm
- 12.1.12.1. Company Overview
- 12.1.12.2. Products
- 12.1.12.3. Company Financials
- 12.1.12.4. SWOT Analysis
- 12.1.1 Tesla Motors
- 12.2. Market Entropy
- 12.2.1 Company's Key Areas Served
- 12.2.2 Recent Developments
- 12.3. Company Market Share Analysis 2025
- 12.3.1 Top 5 Companies Market Share Analysis
- 12.3.2 Top 3 Companies Market Share Analysis
- 12.4. List of Potential Customers
- 13. Research Methodology
List of Figures
- Figure 1: Global APAC Wireless Charging Industry Revenue Breakdown (billion, %) by Region 2025 & 2033
- Figure 2: North America APAC Wireless Charging Industry Revenue (billion), by Vehicle Type 2025 & 2033
- Figure 3: North America APAC Wireless Charging Industry Revenue Share (%), by Vehicle Type 2025 & 2033
- Figure 4: North America APAC Wireless Charging Industry Revenue (billion), by Country 2025 & 2033
- Figure 5: North America APAC Wireless Charging Industry Revenue Share (%), by Country 2025 & 2033
- Figure 6: South America APAC Wireless Charging Industry Revenue (billion), by Vehicle Type 2025 & 2033
- Figure 7: South America APAC Wireless Charging Industry Revenue Share (%), by Vehicle Type 2025 & 2033
- Figure 8: South America APAC Wireless Charging Industry Revenue (billion), by Country 2025 & 2033
- Figure 9: South America APAC Wireless Charging Industry Revenue Share (%), by Country 2025 & 2033
- Figure 10: Europe APAC Wireless Charging Industry Revenue (billion), by Vehicle Type 2025 & 2033
- Figure 11: Europe APAC Wireless Charging Industry Revenue Share (%), by Vehicle Type 2025 & 2033
- Figure 12: Europe APAC Wireless Charging Industry Revenue (billion), by Country 2025 & 2033
- Figure 13: Europe APAC Wireless Charging Industry Revenue Share (%), by Country 2025 & 2033
- Figure 14: Middle East & Africa APAC Wireless Charging Industry Revenue (billion), by Vehicle Type 2025 & 2033
- Figure 15: Middle East & Africa APAC Wireless Charging Industry Revenue Share (%), by Vehicle Type 2025 & 2033
- Figure 16: Middle East & Africa APAC Wireless Charging Industry Revenue (billion), by Country 2025 & 2033
- Figure 17: Middle East & Africa APAC Wireless Charging Industry Revenue Share (%), by Country 2025 & 2033
- Figure 18: Asia Pacific APAC Wireless Charging Industry Revenue (billion), by Vehicle Type 2025 & 2033
- Figure 19: Asia Pacific APAC Wireless Charging Industry Revenue Share (%), by Vehicle Type 2025 & 2033
- Figure 20: Asia Pacific APAC Wireless Charging Industry Revenue (billion), by Country 2025 & 2033
- Figure 21: Asia Pacific APAC Wireless Charging Industry Revenue Share (%), by Country 2025 & 2033
List of Tables
- Table 1: Global APAC Wireless Charging Industry Revenue billion Forecast, by Vehicle Type 2020 & 2033
- Table 2: Global APAC Wireless Charging Industry Revenue billion Forecast, by Region 2020 & 2033
- Table 3: Global APAC Wireless Charging Industry Revenue billion Forecast, by Vehicle Type 2020 & 2033
- Table 4: Global APAC Wireless Charging Industry Revenue billion Forecast, by Country 2020 & 2033
- Table 5: United States APAC Wireless Charging Industry Revenue (billion) Forecast, by Application 2020 & 2033
- Table 6: Canada APAC Wireless Charging Industry Revenue (billion) Forecast, by Application 2020 & 2033
- Table 7: Mexico APAC Wireless Charging Industry Revenue (billion) Forecast, by Application 2020 & 2033
- Table 8: Global APAC Wireless Charging Industry Revenue billion Forecast, by Vehicle Type 2020 & 2033
- Table 9: Global APAC Wireless Charging Industry Revenue billion Forecast, by Country 2020 & 2033
- Table 10: Brazil APAC Wireless Charging Industry Revenue (billion) Forecast, by Application 2020 & 2033
- Table 11: Argentina APAC Wireless Charging Industry Revenue (billion) Forecast, by Application 2020 & 2033
- Table 12: Rest of South America APAC Wireless Charging Industry Revenue (billion) Forecast, by Application 2020 & 2033
- Table 13: Global APAC Wireless Charging Industry Revenue billion Forecast, by Vehicle Type 2020 & 2033
- Table 14: Global APAC Wireless Charging Industry Revenue billion Forecast, by Country 2020 & 2033
- Table 15: United Kingdom APAC Wireless Charging Industry Revenue (billion) Forecast, by Application 2020 & 2033
- Table 16: Germany APAC Wireless Charging Industry Revenue (billion) Forecast, by Application 2020 & 2033
- Table 17: France APAC Wireless Charging Industry Revenue (billion) Forecast, by Application 2020 & 2033
- Table 18: Italy APAC Wireless Charging Industry Revenue (billion) Forecast, by Application 2020 & 2033
- Table 19: Spain APAC Wireless Charging Industry Revenue (billion) Forecast, by Application 2020 & 2033
- Table 20: Russia APAC Wireless Charging Industry Revenue (billion) Forecast, by Application 2020 & 2033
- Table 21: Benelux APAC Wireless Charging Industry Revenue (billion) Forecast, by Application 2020 & 2033
- Table 22: Nordics APAC Wireless Charging Industry Revenue (billion) Forecast, by Application 2020 & 2033
- Table 23: Rest of Europe APAC Wireless Charging Industry Revenue (billion) Forecast, by Application 2020 & 2033
- Table 24: Global APAC Wireless Charging Industry Revenue billion Forecast, by Vehicle Type 2020 & 2033
- Table 25: Global APAC Wireless Charging Industry Revenue billion Forecast, by Country 2020 & 2033
- Table 26: Turkey APAC Wireless Charging Industry Revenue (billion) Forecast, by Application 2020 & 2033
- Table 27: Israel APAC Wireless Charging Industry Revenue (billion) Forecast, by Application 2020 & 2033
- Table 28: GCC APAC Wireless Charging Industry Revenue (billion) Forecast, by Application 2020 & 2033
- Table 29: North Africa APAC Wireless Charging Industry Revenue (billion) Forecast, by Application 2020 & 2033
- Table 30: South Africa APAC Wireless Charging Industry Revenue (billion) Forecast, by Application 2020 & 2033
- Table 31: Rest of Middle East & Africa APAC Wireless Charging Industry Revenue (billion) Forecast, by Application 2020 & 2033
- Table 32: Global APAC Wireless Charging Industry Revenue billion Forecast, by Vehicle Type 2020 & 2033
- Table 33: Global APAC Wireless Charging Industry Revenue billion Forecast, by Country 2020 & 2033
- Table 34: China APAC Wireless Charging Industry Revenue (billion) Forecast, by Application 2020 & 2033
- Table 35: India APAC Wireless Charging Industry Revenue (billion) Forecast, by Application 2020 & 2033
- Table 36: Japan APAC Wireless Charging Industry Revenue (billion) Forecast, by Application 2020 & 2033
- Table 37: South Korea APAC Wireless Charging Industry Revenue (billion) Forecast, by Application 2020 & 2033
- Table 38: ASEAN APAC Wireless Charging Industry Revenue (billion) Forecast, by Application 2020 & 2033
- Table 39: Oceania APAC Wireless Charging Industry Revenue (billion) Forecast, by Application 2020 & 2033
- Table 40: Rest of Asia Pacific APAC Wireless Charging Industry Revenue (billion) Forecast, by Application 2020 & 2033
Frequently Asked Questions
1. What is the projected Compound Annual Growth Rate (CAGR) of the APAC Wireless Charging Industry?
The projected CAGR is approximately 36.2%.
2. Which companies are prominent players in the APAC Wireless Charging Industry?
Key companies in the market include Tesla Motors, Daimler AG, OLEV Technologies, BMW AG, Plugless, Bombardier, Toyota Motor Corporation, Nissan, Hella Aglaia, HEVO Powe, WiTricity, Qualcomm.
3. What are the main segments of the APAC Wireless Charging Industry?
The market segments include Vehicle Type.
4. Can you provide details about the market size?
The market size is estimated to be USD 24.4 billion as of 2022.
5. What are some drivers contributing to market growth?
Growing Sales of Electric Vehicles Aiding Market Growth.
6. What are the notable trends driving market growth?
Increasing Sales of Electric Vehicles Driving the Wireless Charging Demand.
7. Are there any restraints impacting market growth?
High Cost of Installing Wireless Chargers.
8. Can you provide examples of recent developments in the market?
June 2023: ST Microelectronics NV unveiled an array of cutting-edge products and solutions for the smart mobility sector during the MWC Shanghai event. Among the highlights was the debut of the ST P-BOX Solution, a groundbreaking technology set to revolutionize autonomous driving. Additionally, the company showcased its 100W Wireless Charging Solution, built upon the STWBC2-HP and STWLC99 platforms.
9. What pricing options are available for accessing the report?
Pricing options include single-user, multi-user, and enterprise licenses priced at USD 4750, USD 4950, and USD 6800 respectively.
10. Is the market size provided in terms of value or volume?
The market size is provided in terms of value, measured in billion.
11. Are there any specific market keywords associated with the report?
Yes, the market keyword associated with the report is "APAC Wireless Charging Industry," which aids in identifying and referencing the specific market segment covered.
12. How do I determine which pricing option suits my needs best?
The pricing options vary based on user requirements and access needs. Individual users may opt for single-user licenses, while businesses requiring broader access may choose multi-user or enterprise licenses for cost-effective access to the report.
13. Are there any additional resources or data provided in the APAC Wireless Charging Industry report?
While the report offers comprehensive insights, it's advisable to review the specific contents or supplementary materials provided to ascertain if additional resources or data are available.
14. How can I stay updated on further developments or reports in the APAC Wireless Charging Industry?
To stay informed about further developments, trends, and reports in the APAC Wireless Charging Industry, consider subscribing to industry newsletters, following relevant companies and organizations, or regularly checking reputable industry news sources and publications.
Methodology
Step 1 - Identification of Relevant Samples Size from Population Database


Step 2 - Approaches for Defining Global Market Size (Value, Volume* & Price*)

Note*: In applicable scenarios
Step 3 - Data Sources
Primary Research
- Web Analytics
- Survey Reports
- Research Institute
- Latest Research Reports
- Opinion Leaders
Secondary Research
- Annual Reports
- White Paper
- Latest Press Release
- Industry Association
- Paid Database
- Investor Presentations

Step 4 - Data Triangulation
Involves using different sources of information in order to increase the validity of a study
These sources are likely to be stakeholders in a program - participants, other researchers, program staff, other community members, and so on.
Then we put all data in single framework & apply various statistical tools to find out the dynamic on the market.
During the analysis stage, feedback from the stakeholder groups would be compared to determine areas of agreement as well as areas of divergence