

Key Insights
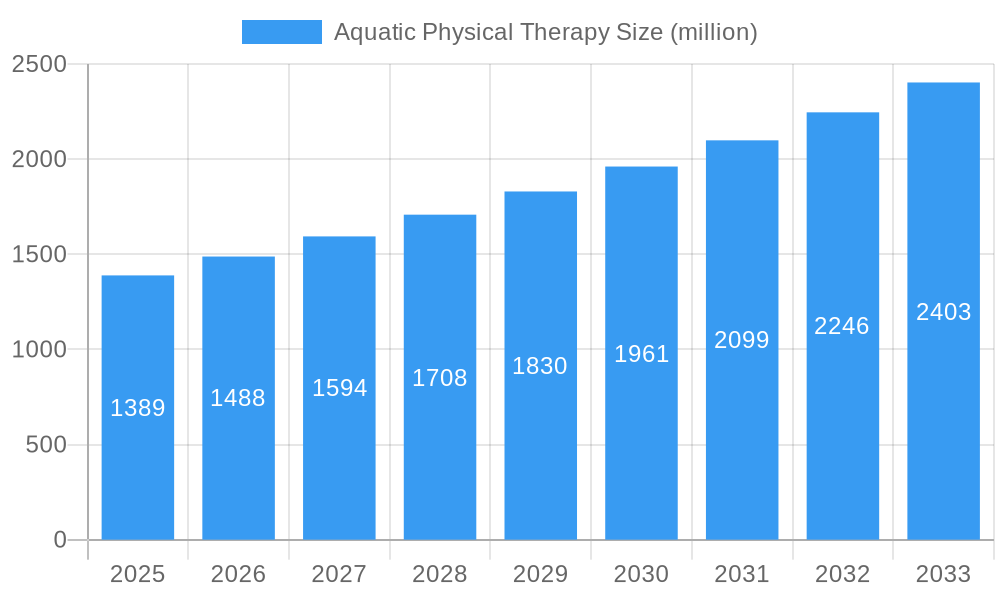
The aquatic physical therapy market, valued at $1389 million in 2025, is projected to experience robust growth, driven by a rising aging population, increasing prevalence of chronic conditions like arthritis and back pain, and a growing awareness of the benefits of aquatic therapy. This non-weight-bearing form of therapy offers gentle exercise, reducing stress on joints and improving range of motion, making it ideal for patients recovering from injuries or managing chronic conditions. The market's expansion is further fueled by technological advancements in aquatic therapy equipment, such as specialized pools and underwater treadmills, offering more precise and effective treatment options. Leading companies like SwimEx, Hydroworx, and Endless Pools are contributing to this growth through innovation and expansion into new markets. The increasing integration of aquatic therapy into mainstream healthcare settings and the development of specialized rehabilitation programs are also key contributing factors.
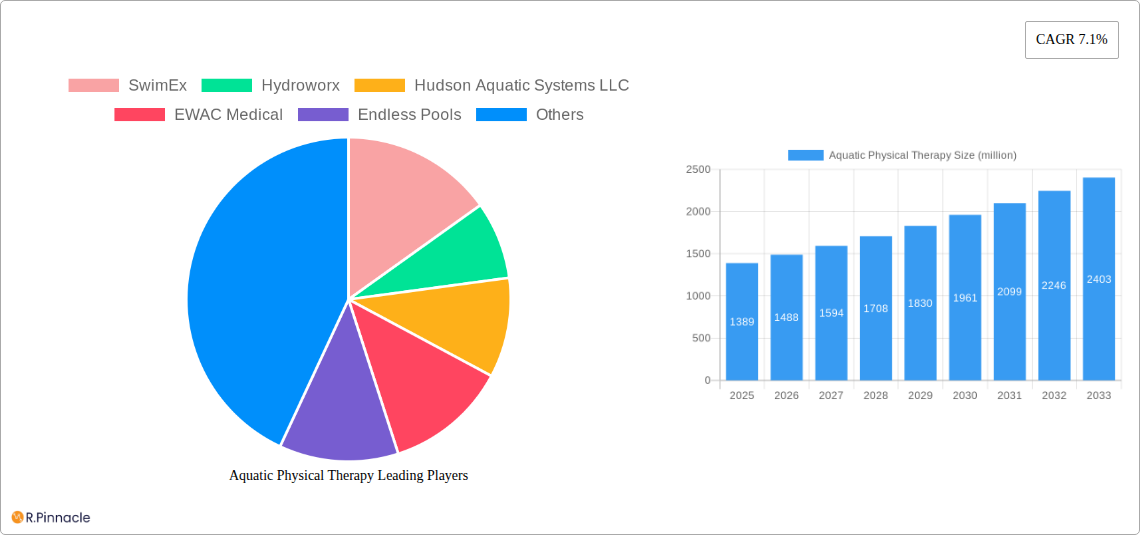
Aquatic Physical Therapy Market Size (In Billion)
The 7.1% CAGR projected through 2033 indicates a consistently expanding market. However, potential restraints include the high initial investment cost of specialized equipment, limited access to aquatic therapy facilities in certain regions, and the lack of skilled professionals trained in this specialized area. Nevertheless, the growing demand for effective and less invasive rehabilitation solutions coupled with increasing health insurance coverage for aquatic therapy suggests a positive outlook for this market segment. Future market growth will likely hinge on continued technological advancements, improved accessibility, and increased professional training and certification programs to cater to the rising demand.
Aquatic Physical Therapy Company Market Share
Aquatic Physical Therapy Market Report: 2019-2033 - A Deep Dive into a Multi-Million Dollar Industry
This comprehensive report provides an in-depth analysis of the Aquatic Physical Therapy market, offering invaluable insights for industry professionals, investors, and stakeholders. Covering the period from 2019 to 2033, with a focus on 2025, this report unveils the market's structure, dynamics, and future potential, projecting a market size exceeding xx million by 2033.
Aquatic Physical Therapy Market Structure & Innovation Trends
This section analyzes the competitive landscape, innovation drivers, and regulatory environment influencing the Aquatic Physical Therapy market. We examine market concentration, revealing a moderately fragmented market with key players such as SwimEx, Hydroworx, and Endless Pools holding significant but not dominant market share. The estimated market share for SwimEx in 2025 is xx%, while Hydroworx holds approximately xx%. We also explore innovation drivers, including technological advancements in pool designs, therapy equipment, and data analytics. Regulatory frameworks, particularly those related to healthcare and medical device approvals, are examined alongside the impact of product substitutes (e.g., land-based therapies). Furthermore, we analyze end-user demographics, focusing on the aging population and rising prevalence of chronic conditions driving market growth. Finally, the report details M&A activity, including a review of significant deals within the last 5 years with estimated values exceeding xx million in total.
Aquatic Physical Therapy Market Dynamics & Trends
This section delves into the market's growth trajectory, analyzing key drivers, disruptive technologies, consumer preferences, and competitive dynamics. The global aquatic physical therapy market is projected to experience significant growth, with a CAGR of xx% during the forecast period (2025-2033). This robust growth is fueled by several factors, including the rising prevalence of chronic diseases like arthritis and musculoskeletal disorders, increasing demand for non-invasive and effective rehabilitation methods, and growing awareness of the benefits of aquatic therapy. Technological advancements, such as the integration of virtual reality and telehealth platforms, are also transforming the market. Consumer preferences are shifting towards personalized and technologically advanced therapies, influencing the development of innovative products and services. Competitive dynamics are shaped by factors like product differentiation, pricing strategies, and technological advancements among key players. Market penetration for aquatic physical therapy within the broader rehabilitation market is estimated at xx% in 2025, with significant growth potential.
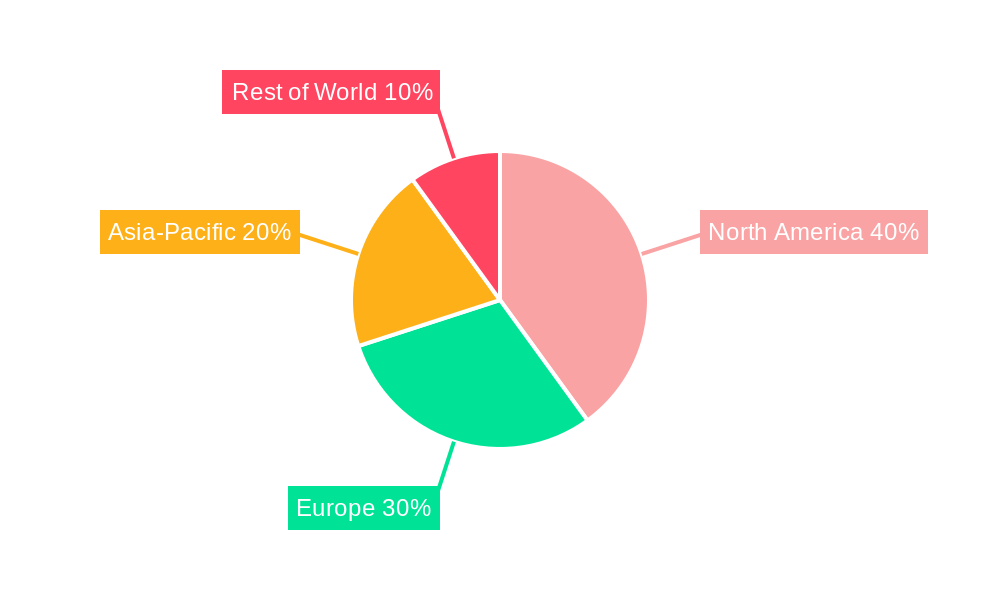
Dominant Regions & Segments in Aquatic Physical Therapy
This section identifies the leading regions and segments within the Aquatic Physical Therapy market. North America currently dominates the market, driven by factors including:
- High healthcare expenditure: Significant investments in healthcare infrastructure and technology contribute to the market’s growth.
- Aging population: A rapidly aging population with a higher prevalence of chronic conditions increases the demand for rehabilitation services.
- Strong regulatory support: Favorable regulatory frameworks promote the adoption of advanced therapeutic techniques.
Other regions such as Europe and Asia-Pacific are exhibiting substantial growth potential, fueled by rising healthcare awareness and investments in healthcare infrastructure. The market is segmented by product type (pools, equipment, software), end-user (hospitals, clinics, rehabilitation centers), and therapy type (stroke rehabilitation, arthritis management, etc.), with xx being the fastest-growing segment due to [insert reasoning].
Aquatic Physical Therapy Product Innovations
Recent product innovations focus on enhancing therapeutic effectiveness, patient comfort, and data-driven outcomes. This includes the development of more sophisticated pool designs, advanced rehabilitation equipment integrating technology, and software for personalized therapy planning and progress tracking. The emphasis is on integrating technology to enhance data analysis, improve patient engagement, and drive better treatment outcomes, creating a competitive advantage for companies that prioritize technological advancements and patient-centric designs.
Report Scope & Segmentation Analysis
The report comprehensively segments the aquatic physical therapy market across various parameters. Geographic segmentation includes North America, Europe, Asia-Pacific, and the Rest of the World. The product segment encompasses pools (residential, commercial), equipment (therapy tools, underwater treadmills), and software (treatment planning, progress tracking). End-user segmentation includes hospitals, rehabilitation centers, and private clinics. Each segment is analyzed in detail, including growth projections, market sizes for 2025 and beyond, and competitive dynamics. The market is further segmented by therapy type, covering conditions treated and specific procedures.
Key Drivers of Aquatic Physical Therapy Growth
The growth of the aquatic physical therapy market is primarily driven by several factors. The rising prevalence of chronic diseases, particularly among the aging population, creates a substantial demand for effective rehabilitation solutions. Technological advancements in pool design, therapy equipment, and data analytics are enhancing treatment outcomes and patient experience. Furthermore, favorable regulatory frameworks and increased insurance coverage are driving market adoption. Government initiatives promoting healthcare accessibility and advancements in telehealth are further fueling market expansion.
Challenges in the Aquatic Physical Therapy Sector
The aquatic physical therapy sector faces several challenges. High initial investment costs associated with establishing aquatic therapy facilities can be a barrier to entry, particularly for smaller clinics and providers. The need for specialized equipment and skilled personnel increases operating costs. Competition from alternative therapies and the complexity of insurance reimbursement processes present ongoing hurdles. Supply chain disruptions for specialized equipment can also impact market growth, leading to potential price increases or delays in project implementation. The projected impact of these factors on market growth is a reduction of xx% in overall projected market size.
Emerging Opportunities in Aquatic Physical Therapy
Emerging opportunities abound within the aquatic physical therapy market. The integration of virtual reality (VR) and augmented reality (AR) technologies holds significant promise for enhancing patient engagement and treatment effectiveness. The expansion into new geographical markets, particularly in developing economies with rising healthcare spending, presents considerable growth potential. Furthermore, the development of specialized programs targeting specific conditions (e.g., neurorehabilitation) and the rise of telehealth offer exciting avenues for market expansion. The incorporation of data analytics and AI to personalize treatments also offers significant opportunities.
Leading Players in the Aquatic Physical Therapy Market
- SwimEx
- Hydroworx
- Hudson Aquatic Systems LLC
- EWAC Medical
- Endless Pools
- Natare Pool Corporation
- Whitehall Manufacturing
- Preston Pools
- Technomex
- Aqua Product Corporation
- Aquasure UK
- BTL Corporate
- Jacuzzi Inc.
- Meden-Inmed
- Master Spas.
Key Developments in Aquatic Physical Therapy Industry
- 2022 Q3: SwimEx launched a new line of underwater treadmills with integrated data analytics capabilities.
- 2023 Q1: Hydroworx partnered with a major hospital system to expand aquatic therapy services.
- 2024 Q2: A significant merger between two leading manufacturers of aquatic therapy equipment resulted in xx million deal. (Further details on specific mergers and acquisitions are available within the full report.)
Future Outlook for Aquatic Physical Therapy Market
The aquatic physical therapy market is poised for substantial growth in the coming years. Technological advancements, coupled with rising healthcare spending and an aging global population, will continue to fuel market expansion. The focus on personalized therapies, data-driven outcomes, and the increasing adoption of telehealth platforms are key accelerators for growth. Strategic partnerships, product innovation, and expansion into new markets will be crucial for success within this dynamic and evolving industry. The market is predicted to reach xx million by 2033.
Aquatic Physical Therapy Segmentation
-
1. Application
- 1.1. Hospitals
- 1.2. Specialty Physical Therapy Clinics
- 1.3. Home Care
- 1.4. Other
-
2. Types
- 2.1. Hydrotherapy Pools
- 2.2. Whirlpool Baths
- 2.3. Hydrotherapy Tanks
- 2.4. Other
Aquatic Physical Therapy Segmentation By Geography
-
1. North America
- 1.1. United States
- 1.2. Canada
- 1.3. Mexico
-
2. South America
- 2.1. Brazil
- 2.2. Argentina
- 2.3. Rest of South America
-
3. Europe
- 3.1. United Kingdom
- 3.2. Germany
- 3.3. France
- 3.4. Italy
- 3.5. Spain
- 3.6. Russia
- 3.7. Benelux
- 3.8. Nordics
- 3.9. Rest of Europe
-
4. Middle East & Africa
- 4.1. Turkey
- 4.2. Israel
- 4.3. GCC
- 4.4. North Africa
- 4.5. South Africa
- 4.6. Rest of Middle East & Africa
-
5. Asia Pacific
- 5.1. China
- 5.2. India
- 5.3. Japan
- 5.4. South Korea
- 5.5. ASEAN
- 5.6. Oceania
- 5.7. Rest of Asia Pacific
Aquatic Physical Therapy Regional Market Share
Geographic Coverage of Aquatic Physical Therapy
Aquatic Physical Therapy REPORT HIGHLIGHTS
| Aspects | Details |
|---|---|
| Study Period | 2020-2034 |
| Base Year | 2025 |
| Estimated Year | 2026 |
| Forecast Period | 2026-2034 |
| Historical Period | 2020-2025 |
| Growth Rate | CAGR of 7.1% from 2020-2034 |
| Segmentation |
|
Table of Contents
- 1. Introduction
- 1.1. Research Scope
- 1.2. Market Segmentation
- 1.3. Research Objective
- 1.4. Definitions and Assumptions
- 2. Executive Summary
- 2.1. Market Snapshot
- 3. Market Dynamics
- 3.1. Market Drivers
- 3.2. Market Restrains
- 3.3. Market Trends
- 3.4. Market Opportunities
- 4. Market Factor Analysis
- 4.1. Porters Five Forces
- 4.1.1. Bargaining Power of Suppliers
- 4.1.2. Bargaining Power of Buyers
- 4.1.3. Threat of New Entrants
- 4.1.4. Threat of Substitutes
- 4.1.5. Competitive Rivalry
- 4.2. PESTEL analysis
- 4.3. BCG Analysis
- 4.3.1. Stars (High Growth, High Market Share)
- 4.3.2. Cash Cows (Low Growth, High Market Share)
- 4.3.3. Question Mark (High Growth, Low Market Share)
- 4.3.4. Dogs (Low Growth, Low Market Share)
- 4.4. Ansoff Matrix Analysis
- 4.5. Supply Chain Analysis
- 4.6. Regulatory Landscape
- 4.7. Current Market Potential and Opportunity Assessment (TAM–SAM–SOM Framework)
- 4.8. PRI Analyst Note
- 4.1. Porters Five Forces
- 5. Market Analysis, Insights and Forecast 2021-2033
- 5.1. Market Analysis, Insights and Forecast - by Application
- 5.1.1. Hospitals
- 5.1.2. Specialty Physical Therapy Clinics
- 5.1.3. Home Care
- 5.1.4. Other
- 5.2. Market Analysis, Insights and Forecast - by Types
- 5.2.1. Hydrotherapy Pools
- 5.2.2. Whirlpool Baths
- 5.2.3. Hydrotherapy Tanks
- 5.2.4. Other
- 5.3. Market Analysis, Insights and Forecast - by Region
- 5.3.1. North America
- 5.3.2. South America
- 5.3.3. Europe
- 5.3.4. Middle East & Africa
- 5.3.5. Asia Pacific
- 5.1. Market Analysis, Insights and Forecast - by Application
- 6. Global Aquatic Physical Therapy Analysis, Insights and Forecast, 2021-2033
- 6.1. Market Analysis, Insights and Forecast - by Application
- 6.1.1. Hospitals
- 6.1.2. Specialty Physical Therapy Clinics
- 6.1.3. Home Care
- 6.1.4. Other
- 6.2. Market Analysis, Insights and Forecast - by Types
- 6.2.1. Hydrotherapy Pools
- 6.2.2. Whirlpool Baths
- 6.2.3. Hydrotherapy Tanks
- 6.2.4. Other
- 6.1. Market Analysis, Insights and Forecast - by Application
- 7. North America Aquatic Physical Therapy Analysis, Insights and Forecast, 2020-2032
- 7.1. Market Analysis, Insights and Forecast - by Application
- 7.1.1. Hospitals
- 7.1.2. Specialty Physical Therapy Clinics
- 7.1.3. Home Care
- 7.1.4. Other
- 7.2. Market Analysis, Insights and Forecast - by Types
- 7.2.1. Hydrotherapy Pools
- 7.2.2. Whirlpool Baths
- 7.2.3. Hydrotherapy Tanks
- 7.2.4. Other
- 7.1. Market Analysis, Insights and Forecast - by Application
- 8. South America Aquatic Physical Therapy Analysis, Insights and Forecast, 2020-2032
- 8.1. Market Analysis, Insights and Forecast - by Application
- 8.1.1. Hospitals
- 8.1.2. Specialty Physical Therapy Clinics
- 8.1.3. Home Care
- 8.1.4. Other
- 8.2. Market Analysis, Insights and Forecast - by Types
- 8.2.1. Hydrotherapy Pools
- 8.2.2. Whirlpool Baths
- 8.2.3. Hydrotherapy Tanks
- 8.2.4. Other
- 8.1. Market Analysis, Insights and Forecast - by Application
- 9. Europe Aquatic Physical Therapy Analysis, Insights and Forecast, 2020-2032
- 9.1. Market Analysis, Insights and Forecast - by Application
- 9.1.1. Hospitals
- 9.1.2. Specialty Physical Therapy Clinics
- 9.1.3. Home Care
- 9.1.4. Other
- 9.2. Market Analysis, Insights and Forecast - by Types
- 9.2.1. Hydrotherapy Pools
- 9.2.2. Whirlpool Baths
- 9.2.3. Hydrotherapy Tanks
- 9.2.4. Other
- 9.1. Market Analysis, Insights and Forecast - by Application
- 10. Middle East & Africa Aquatic Physical Therapy Analysis, Insights and Forecast, 2020-2032
- 10.1. Market Analysis, Insights and Forecast - by Application
- 10.1.1. Hospitals
- 10.1.2. Specialty Physical Therapy Clinics
- 10.1.3. Home Care
- 10.1.4. Other
- 10.2. Market Analysis, Insights and Forecast - by Types
- 10.2.1. Hydrotherapy Pools
- 10.2.2. Whirlpool Baths
- 10.2.3. Hydrotherapy Tanks
- 10.2.4. Other
- 10.1. Market Analysis, Insights and Forecast - by Application
- 11. Asia Pacific Aquatic Physical Therapy Analysis, Insights and Forecast, 2020-2032
- 11.1. Market Analysis, Insights and Forecast - by Application
- 11.1.1. Hospitals
- 11.1.2. Specialty Physical Therapy Clinics
- 11.1.3. Home Care
- 11.1.4. Other
- 11.2. Market Analysis, Insights and Forecast - by Types
- 11.2.1. Hydrotherapy Pools
- 11.2.2. Whirlpool Baths
- 11.2.3. Hydrotherapy Tanks
- 11.2.4. Other
- 11.1. Market Analysis, Insights and Forecast - by Application
- 12. Competitive Analysis
- 12.1. Company Profiles
- 12.1.1 SwimEx
- 12.1.1.1. Company Overview
- 12.1.1.2. Products
- 12.1.1.3. Company Financials
- 12.1.1.4. SWOT Analysis
- 12.1.2 Hydroworx
- 12.1.2.1. Company Overview
- 12.1.2.2. Products
- 12.1.2.3. Company Financials
- 12.1.2.4. SWOT Analysis
- 12.1.3 Hudson Aquatic Systems LLC
- 12.1.3.1. Company Overview
- 12.1.3.2. Products
- 12.1.3.3. Company Financials
- 12.1.3.4. SWOT Analysis
- 12.1.4 EWAC Medical
- 12.1.4.1. Company Overview
- 12.1.4.2. Products
- 12.1.4.3. Company Financials
- 12.1.4.4. SWOT Analysis
- 12.1.5 Endless Pools
- 12.1.5.1. Company Overview
- 12.1.5.2. Products
- 12.1.5.3. Company Financials
- 12.1.5.4. SWOT Analysis
- 12.1.6 Natare Pool Corporation
- 12.1.6.1. Company Overview
- 12.1.6.2. Products
- 12.1.6.3. Company Financials
- 12.1.6.4. SWOT Analysis
- 12.1.7 Whitehall Manufacturing
- 12.1.7.1. Company Overview
- 12.1.7.2. Products
- 12.1.7.3. Company Financials
- 12.1.7.4. SWOT Analysis
- 12.1.8 Preston Pools
- 12.1.8.1. Company Overview
- 12.1.8.2. Products
- 12.1.8.3. Company Financials
- 12.1.8.4. SWOT Analysis
- 12.1.9 Technomex
- 12.1.9.1. Company Overview
- 12.1.9.2. Products
- 12.1.9.3. Company Financials
- 12.1.9.4. SWOT Analysis
- 12.1.10 Aqua Product Corporation
- 12.1.10.1. Company Overview
- 12.1.10.2. Products
- 12.1.10.3. Company Financials
- 12.1.10.4. SWOT Analysis
- 12.1.11 Aquasure UK
- 12.1.11.1. Company Overview
- 12.1.11.2. Products
- 12.1.11.3. Company Financials
- 12.1.11.4. SWOT Analysis
- 12.1.12 BTL Corporate
- 12.1.12.1. Company Overview
- 12.1.12.2. Products
- 12.1.12.3. Company Financials
- 12.1.12.4. SWOT Analysis
- 12.1.13 Jacuzzi Inc.
- 12.1.13.1. Company Overview
- 12.1.13.2. Products
- 12.1.13.3. Company Financials
- 12.1.13.4. SWOT Analysis
- 12.1.14 Meden-Inmed
- 12.1.14.1. Company Overview
- 12.1.14.2. Products
- 12.1.14.3. Company Financials
- 12.1.14.4. SWOT Analysis
- 12.1.15 Master Spas.
- 12.1.15.1. Company Overview
- 12.1.15.2. Products
- 12.1.15.3. Company Financials
- 12.1.15.4. SWOT Analysis
- 12.1.1 SwimEx
- 12.2. Market Entropy
- 12.2.1 Company's Key Areas Served
- 12.2.2 Recent Developments
- 12.3. Company Market Share Analysis 2025
- 12.3.1 Top 5 Companies Market Share Analysis
- 12.3.2 Top 3 Companies Market Share Analysis
- 12.4. List of Potential Customers
- 13. Research Methodology
List of Figures
- Figure 1: Global Aquatic Physical Therapy Revenue Breakdown (million, %) by Region 2025 & 2033
- Figure 2: Global Aquatic Physical Therapy Volume Breakdown (K, %) by Region 2025 & 2033
- Figure 3: North America Aquatic Physical Therapy Revenue (million), by Application 2025 & 2033
- Figure 4: North America Aquatic Physical Therapy Volume (K), by Application 2025 & 2033
- Figure 5: North America Aquatic Physical Therapy Revenue Share (%), by Application 2025 & 2033
- Figure 6: North America Aquatic Physical Therapy Volume Share (%), by Application 2025 & 2033
- Figure 7: North America Aquatic Physical Therapy Revenue (million), by Types 2025 & 2033
- Figure 8: North America Aquatic Physical Therapy Volume (K), by Types 2025 & 2033
- Figure 9: North America Aquatic Physical Therapy Revenue Share (%), by Types 2025 & 2033
- Figure 10: North America Aquatic Physical Therapy Volume Share (%), by Types 2025 & 2033
- Figure 11: North America Aquatic Physical Therapy Revenue (million), by Country 2025 & 2033
- Figure 12: North America Aquatic Physical Therapy Volume (K), by Country 2025 & 2033
- Figure 13: North America Aquatic Physical Therapy Revenue Share (%), by Country 2025 & 2033
- Figure 14: North America Aquatic Physical Therapy Volume Share (%), by Country 2025 & 2033
- Figure 15: South America Aquatic Physical Therapy Revenue (million), by Application 2025 & 2033
- Figure 16: South America Aquatic Physical Therapy Volume (K), by Application 2025 & 2033
- Figure 17: South America Aquatic Physical Therapy Revenue Share (%), by Application 2025 & 2033
- Figure 18: South America Aquatic Physical Therapy Volume Share (%), by Application 2025 & 2033
- Figure 19: South America Aquatic Physical Therapy Revenue (million), by Types 2025 & 2033
- Figure 20: South America Aquatic Physical Therapy Volume (K), by Types 2025 & 2033
- Figure 21: South America Aquatic Physical Therapy Revenue Share (%), by Types 2025 & 2033
- Figure 22: South America Aquatic Physical Therapy Volume Share (%), by Types 2025 & 2033
- Figure 23: South America Aquatic Physical Therapy Revenue (million), by Country 2025 & 2033
- Figure 24: South America Aquatic Physical Therapy Volume (K), by Country 2025 & 2033
- Figure 25: South America Aquatic Physical Therapy Revenue Share (%), by Country 2025 & 2033
- Figure 26: South America Aquatic Physical Therapy Volume Share (%), by Country 2025 & 2033
- Figure 27: Europe Aquatic Physical Therapy Revenue (million), by Application 2025 & 2033
- Figure 28: Europe Aquatic Physical Therapy Volume (K), by Application 2025 & 2033
- Figure 29: Europe Aquatic Physical Therapy Revenue Share (%), by Application 2025 & 2033
- Figure 30: Europe Aquatic Physical Therapy Volume Share (%), by Application 2025 & 2033
- Figure 31: Europe Aquatic Physical Therapy Revenue (million), by Types 2025 & 2033
- Figure 32: Europe Aquatic Physical Therapy Volume (K), by Types 2025 & 2033
- Figure 33: Europe Aquatic Physical Therapy Revenue Share (%), by Types 2025 & 2033
- Figure 34: Europe Aquatic Physical Therapy Volume Share (%), by Types 2025 & 2033
- Figure 35: Europe Aquatic Physical Therapy Revenue (million), by Country 2025 & 2033
- Figure 36: Europe Aquatic Physical Therapy Volume (K), by Country 2025 & 2033
- Figure 37: Europe Aquatic Physical Therapy Revenue Share (%), by Country 2025 & 2033
- Figure 38: Europe Aquatic Physical Therapy Volume Share (%), by Country 2025 & 2033
- Figure 39: Middle East & Africa Aquatic Physical Therapy Revenue (million), by Application 2025 & 2033
- Figure 40: Middle East & Africa Aquatic Physical Therapy Volume (K), by Application 2025 & 2033
- Figure 41: Middle East & Africa Aquatic Physical Therapy Revenue Share (%), by Application 2025 & 2033
- Figure 42: Middle East & Africa Aquatic Physical Therapy Volume Share (%), by Application 2025 & 2033
- Figure 43: Middle East & Africa Aquatic Physical Therapy Revenue (million), by Types 2025 & 2033
- Figure 44: Middle East & Africa Aquatic Physical Therapy Volume (K), by Types 2025 & 2033
- Figure 45: Middle East & Africa Aquatic Physical Therapy Revenue Share (%), by Types 2025 & 2033
- Figure 46: Middle East & Africa Aquatic Physical Therapy Volume Share (%), by Types 2025 & 2033
- Figure 47: Middle East & Africa Aquatic Physical Therapy Revenue (million), by Country 2025 & 2033
- Figure 48: Middle East & Africa Aquatic Physical Therapy Volume (K), by Country 2025 & 2033
- Figure 49: Middle East & Africa Aquatic Physical Therapy Revenue Share (%), by Country 2025 & 2033
- Figure 50: Middle East & Africa Aquatic Physical Therapy Volume Share (%), by Country 2025 & 2033
- Figure 51: Asia Pacific Aquatic Physical Therapy Revenue (million), by Application 2025 & 2033
- Figure 52: Asia Pacific Aquatic Physical Therapy Volume (K), by Application 2025 & 2033
- Figure 53: Asia Pacific Aquatic Physical Therapy Revenue Share (%), by Application 2025 & 2033
- Figure 54: Asia Pacific Aquatic Physical Therapy Volume Share (%), by Application 2025 & 2033
- Figure 55: Asia Pacific Aquatic Physical Therapy Revenue (million), by Types 2025 & 2033
- Figure 56: Asia Pacific Aquatic Physical Therapy Volume (K), by Types 2025 & 2033
- Figure 57: Asia Pacific Aquatic Physical Therapy Revenue Share (%), by Types 2025 & 2033
- Figure 58: Asia Pacific Aquatic Physical Therapy Volume Share (%), by Types 2025 & 2033
- Figure 59: Asia Pacific Aquatic Physical Therapy Revenue (million), by Country 2025 & 2033
- Figure 60: Asia Pacific Aquatic Physical Therapy Volume (K), by Country 2025 & 2033
- Figure 61: Asia Pacific Aquatic Physical Therapy Revenue Share (%), by Country 2025 & 2033
- Figure 62: Asia Pacific Aquatic Physical Therapy Volume Share (%), by Country 2025 & 2033
List of Tables
- Table 1: Global Aquatic Physical Therapy Revenue million Forecast, by Application 2020 & 2033
- Table 2: Global Aquatic Physical Therapy Volume K Forecast, by Application 2020 & 2033
- Table 3: Global Aquatic Physical Therapy Revenue million Forecast, by Types 2020 & 2033
- Table 4: Global Aquatic Physical Therapy Volume K Forecast, by Types 2020 & 2033
- Table 5: Global Aquatic Physical Therapy Revenue million Forecast, by Region 2020 & 2033
- Table 6: Global Aquatic Physical Therapy Volume K Forecast, by Region 2020 & 2033
- Table 7: Global Aquatic Physical Therapy Revenue million Forecast, by Application 2020 & 2033
- Table 8: Global Aquatic Physical Therapy Volume K Forecast, by Application 2020 & 2033
- Table 9: Global Aquatic Physical Therapy Revenue million Forecast, by Types 2020 & 2033
- Table 10: Global Aquatic Physical Therapy Volume K Forecast, by Types 2020 & 2033
- Table 11: Global Aquatic Physical Therapy Revenue million Forecast, by Country 2020 & 2033
- Table 12: Global Aquatic Physical Therapy Volume K Forecast, by Country 2020 & 2033
- Table 13: United States Aquatic Physical Therapy Revenue (million) Forecast, by Application 2020 & 2033
- Table 14: United States Aquatic Physical Therapy Volume (K) Forecast, by Application 2020 & 2033
- Table 15: Canada Aquatic Physical Therapy Revenue (million) Forecast, by Application 2020 & 2033
- Table 16: Canada Aquatic Physical Therapy Volume (K) Forecast, by Application 2020 & 2033
- Table 17: Mexico Aquatic Physical Therapy Revenue (million) Forecast, by Application 2020 & 2033
- Table 18: Mexico Aquatic Physical Therapy Volume (K) Forecast, by Application 2020 & 2033
- Table 19: Global Aquatic Physical Therapy Revenue million Forecast, by Application 2020 & 2033
- Table 20: Global Aquatic Physical Therapy Volume K Forecast, by Application 2020 & 2033
- Table 21: Global Aquatic Physical Therapy Revenue million Forecast, by Types 2020 & 2033
- Table 22: Global Aquatic Physical Therapy Volume K Forecast, by Types 2020 & 2033
- Table 23: Global Aquatic Physical Therapy Revenue million Forecast, by Country 2020 & 2033
- Table 24: Global Aquatic Physical Therapy Volume K Forecast, by Country 2020 & 2033
- Table 25: Brazil Aquatic Physical Therapy Revenue (million) Forecast, by Application 2020 & 2033
- Table 26: Brazil Aquatic Physical Therapy Volume (K) Forecast, by Application 2020 & 2033
- Table 27: Argentina Aquatic Physical Therapy Revenue (million) Forecast, by Application 2020 & 2033
- Table 28: Argentina Aquatic Physical Therapy Volume (K) Forecast, by Application 2020 & 2033
- Table 29: Rest of South America Aquatic Physical Therapy Revenue (million) Forecast, by Application 2020 & 2033
- Table 30: Rest of South America Aquatic Physical Therapy Volume (K) Forecast, by Application 2020 & 2033
- Table 31: Global Aquatic Physical Therapy Revenue million Forecast, by Application 2020 & 2033
- Table 32: Global Aquatic Physical Therapy Volume K Forecast, by Application 2020 & 2033
- Table 33: Global Aquatic Physical Therapy Revenue million Forecast, by Types 2020 & 2033
- Table 34: Global Aquatic Physical Therapy Volume K Forecast, by Types 2020 & 2033
- Table 35: Global Aquatic Physical Therapy Revenue million Forecast, by Country 2020 & 2033
- Table 36: Global Aquatic Physical Therapy Volume K Forecast, by Country 2020 & 2033
- Table 37: United Kingdom Aquatic Physical Therapy Revenue (million) Forecast, by Application 2020 & 2033
- Table 38: United Kingdom Aquatic Physical Therapy Volume (K) Forecast, by Application 2020 & 2033
- Table 39: Germany Aquatic Physical Therapy Revenue (million) Forecast, by Application 2020 & 2033
- Table 40: Germany Aquatic Physical Therapy Volume (K) Forecast, by Application 2020 & 2033
- Table 41: France Aquatic Physical Therapy Revenue (million) Forecast, by Application 2020 & 2033
- Table 42: France Aquatic Physical Therapy Volume (K) Forecast, by Application 2020 & 2033
- Table 43: Italy Aquatic Physical Therapy Revenue (million) Forecast, by Application 2020 & 2033
- Table 44: Italy Aquatic Physical Therapy Volume (K) Forecast, by Application 2020 & 2033
- Table 45: Spain Aquatic Physical Therapy Revenue (million) Forecast, by Application 2020 & 2033
- Table 46: Spain Aquatic Physical Therapy Volume (K) Forecast, by Application 2020 & 2033
- Table 47: Russia Aquatic Physical Therapy Revenue (million) Forecast, by Application 2020 & 2033
- Table 48: Russia Aquatic Physical Therapy Volume (K) Forecast, by Application 2020 & 2033
- Table 49: Benelux Aquatic Physical Therapy Revenue (million) Forecast, by Application 2020 & 2033
- Table 50: Benelux Aquatic Physical Therapy Volume (K) Forecast, by Application 2020 & 2033
- Table 51: Nordics Aquatic Physical Therapy Revenue (million) Forecast, by Application 2020 & 2033
- Table 52: Nordics Aquatic Physical Therapy Volume (K) Forecast, by Application 2020 & 2033
- Table 53: Rest of Europe Aquatic Physical Therapy Revenue (million) Forecast, by Application 2020 & 2033
- Table 54: Rest of Europe Aquatic Physical Therapy Volume (K) Forecast, by Application 2020 & 2033
- Table 55: Global Aquatic Physical Therapy Revenue million Forecast, by Application 2020 & 2033
- Table 56: Global Aquatic Physical Therapy Volume K Forecast, by Application 2020 & 2033
- Table 57: Global Aquatic Physical Therapy Revenue million Forecast, by Types 2020 & 2033
- Table 58: Global Aquatic Physical Therapy Volume K Forecast, by Types 2020 & 2033
- Table 59: Global Aquatic Physical Therapy Revenue million Forecast, by Country 2020 & 2033
- Table 60: Global Aquatic Physical Therapy Volume K Forecast, by Country 2020 & 2033
- Table 61: Turkey Aquatic Physical Therapy Revenue (million) Forecast, by Application 2020 & 2033
- Table 62: Turkey Aquatic Physical Therapy Volume (K) Forecast, by Application 2020 & 2033
- Table 63: Israel Aquatic Physical Therapy Revenue (million) Forecast, by Application 2020 & 2033
- Table 64: Israel Aquatic Physical Therapy Volume (K) Forecast, by Application 2020 & 2033
- Table 65: GCC Aquatic Physical Therapy Revenue (million) Forecast, by Application 2020 & 2033
- Table 66: GCC Aquatic Physical Therapy Volume (K) Forecast, by Application 2020 & 2033
- Table 67: North Africa Aquatic Physical Therapy Revenue (million) Forecast, by Application 2020 & 2033
- Table 68: North Africa Aquatic Physical Therapy Volume (K) Forecast, by Application 2020 & 2033
- Table 69: South Africa Aquatic Physical Therapy Revenue (million) Forecast, by Application 2020 & 2033
- Table 70: South Africa Aquatic Physical Therapy Volume (K) Forecast, by Application 2020 & 2033
- Table 71: Rest of Middle East & Africa Aquatic Physical Therapy Revenue (million) Forecast, by Application 2020 & 2033
- Table 72: Rest of Middle East & Africa Aquatic Physical Therapy Volume (K) Forecast, by Application 2020 & 2033
- Table 73: Global Aquatic Physical Therapy Revenue million Forecast, by Application 2020 & 2033
- Table 74: Global Aquatic Physical Therapy Volume K Forecast, by Application 2020 & 2033
- Table 75: Global Aquatic Physical Therapy Revenue million Forecast, by Types 2020 & 2033
- Table 76: Global Aquatic Physical Therapy Volume K Forecast, by Types 2020 & 2033
- Table 77: Global Aquatic Physical Therapy Revenue million Forecast, by Country 2020 & 2033
- Table 78: Global Aquatic Physical Therapy Volume K Forecast, by Country 2020 & 2033
- Table 79: China Aquatic Physical Therapy Revenue (million) Forecast, by Application 2020 & 2033
- Table 80: China Aquatic Physical Therapy Volume (K) Forecast, by Application 2020 & 2033
- Table 81: India Aquatic Physical Therapy Revenue (million) Forecast, by Application 2020 & 2033
- Table 82: India Aquatic Physical Therapy Volume (K) Forecast, by Application 2020 & 2033
- Table 83: Japan Aquatic Physical Therapy Revenue (million) Forecast, by Application 2020 & 2033
- Table 84: Japan Aquatic Physical Therapy Volume (K) Forecast, by Application 2020 & 2033
- Table 85: South Korea Aquatic Physical Therapy Revenue (million) Forecast, by Application 2020 & 2033
- Table 86: South Korea Aquatic Physical Therapy Volume (K) Forecast, by Application 2020 & 2033
- Table 87: ASEAN Aquatic Physical Therapy Revenue (million) Forecast, by Application 2020 & 2033
- Table 88: ASEAN Aquatic Physical Therapy Volume (K) Forecast, by Application 2020 & 2033
- Table 89: Oceania Aquatic Physical Therapy Revenue (million) Forecast, by Application 2020 & 2033
- Table 90: Oceania Aquatic Physical Therapy Volume (K) Forecast, by Application 2020 & 2033
- Table 91: Rest of Asia Pacific Aquatic Physical Therapy Revenue (million) Forecast, by Application 2020 & 2033
- Table 92: Rest of Asia Pacific Aquatic Physical Therapy Volume (K) Forecast, by Application 2020 & 2033
Frequently Asked Questions
1. What is the projected Compound Annual Growth Rate (CAGR) of the Aquatic Physical Therapy?
The projected CAGR is approximately 7.1%.
2. Which companies are prominent players in the Aquatic Physical Therapy?
Key companies in the market include SwimEx, Hydroworx, Hudson Aquatic Systems LLC, EWAC Medical, Endless Pools, Natare Pool Corporation, Whitehall Manufacturing, Preston Pools, Technomex, Aqua Product Corporation, Aquasure UK, BTL Corporate, Jacuzzi Inc., Meden-Inmed, Master Spas..
3. What are the main segments of the Aquatic Physical Therapy?
The market segments include Application, Types.
4. Can you provide details about the market size?
The market size is estimated to be USD 1389 million as of 2022.
5. What are some drivers contributing to market growth?
N/A
6. What are the notable trends driving market growth?
N/A
7. Are there any restraints impacting market growth?
N/A
8. Can you provide examples of recent developments in the market?
N/A
9. What pricing options are available for accessing the report?
Pricing options include single-user, multi-user, and enterprise licenses priced at USD 3950.00, USD 5925.00, and USD 7900.00 respectively.
10. Is the market size provided in terms of value or volume?
The market size is provided in terms of value, measured in million and volume, measured in K.
11. Are there any specific market keywords associated with the report?
Yes, the market keyword associated with the report is "Aquatic Physical Therapy," which aids in identifying and referencing the specific market segment covered.
12. How do I determine which pricing option suits my needs best?
The pricing options vary based on user requirements and access needs. Individual users may opt for single-user licenses, while businesses requiring broader access may choose multi-user or enterprise licenses for cost-effective access to the report.
13. Are there any additional resources or data provided in the Aquatic Physical Therapy report?
While the report offers comprehensive insights, it's advisable to review the specific contents or supplementary materials provided to ascertain if additional resources or data are available.
14. How can I stay updated on further developments or reports in the Aquatic Physical Therapy?
To stay informed about further developments, trends, and reports in the Aquatic Physical Therapy, consider subscribing to industry newsletters, following relevant companies and organizations, or regularly checking reputable industry news sources and publications.
Methodology
Step 1 - Identification of Relevant Samples Size from Population Database


Step 2 - Approaches for Defining Global Market Size (Value, Volume* & Price*)

Note*: In applicable scenarios
Step 3 - Data Sources
Primary Research
- Web Analytics
- Survey Reports
- Research Institute
- Latest Research Reports
- Opinion Leaders
Secondary Research
- Annual Reports
- White Paper
- Latest Press Release
- Industry Association
- Paid Database
- Investor Presentations

Step 4 - Data Triangulation
Involves using different sources of information in order to increase the validity of a study
These sources are likely to be stakeholders in a program - participants, other researchers, program staff, other community members, and so on.
Then we put all data in single framework & apply various statistical tools to find out the dynamic on the market.
During the analysis stage, feedback from the stakeholder groups would be compared to determine areas of agreement as well as areas of divergence