
Key Insights
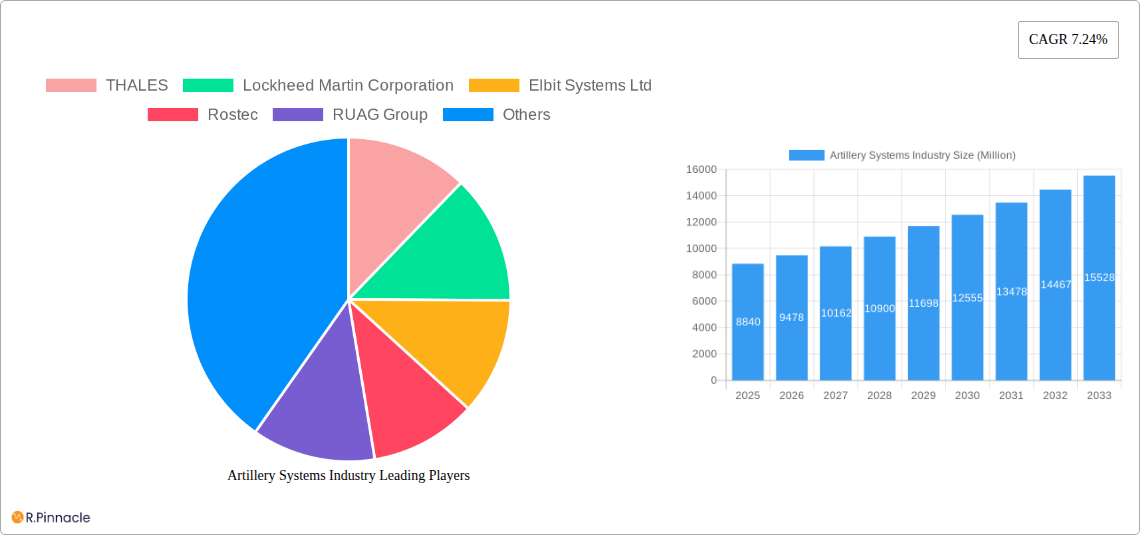
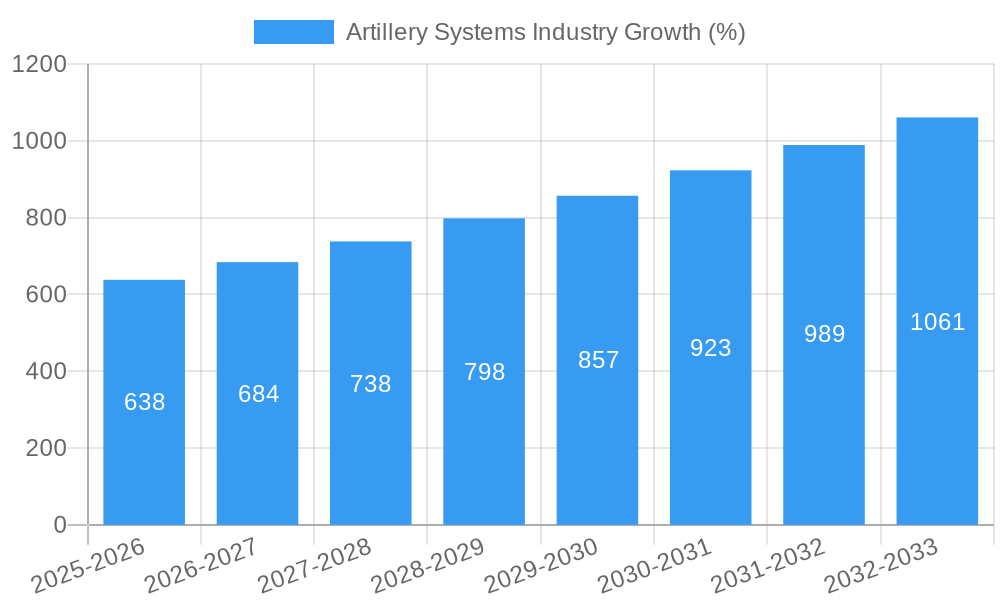
The global artillery systems market, valued at $8.84 billion in 2025, is projected to experience robust growth, driven by a Compound Annual Growth Rate (CAGR) of 7.24% from 2025 to 2033. This expansion is fueled by several key factors. Firstly, escalating geopolitical tensions and ongoing conflicts worldwide necessitate increased military spending on advanced artillery systems. Secondly, continuous technological advancements are leading to the development of more precise, longer-range, and intelligent artillery pieces, enhancing their effectiveness and demand. This includes the integration of precision-guided munitions, improved fire control systems, and the increasing adoption of unmanned aerial vehicles (UAVs) for reconnaissance and targeting. Furthermore, the growing adoption of network-centric warfare strategies necessitates interconnected artillery systems for enhanced battlefield situational awareness and coordinated fire support. Finally, modernization programs undertaken by numerous nations to upgrade their aging artillery fleets are significantly contributing to market growth. The market segmentation reveals strong demand across various artillery types, notably howitzers and rocket artillery, with long-range systems witnessing particularly significant growth.
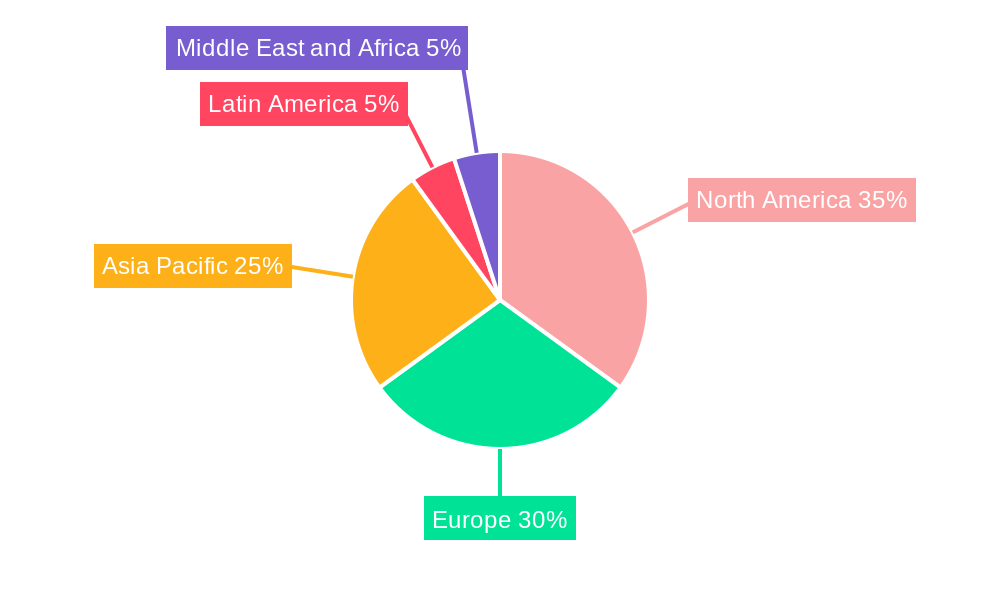
Regional analysis suggests North America and Europe will remain dominant players due to significant military budgets and technological leadership. However, the Asia-Pacific region, specifically countries like China and India, is expected to witness substantial growth owing to rising defense expenditures and modernization initiatives. Competition among major players such as Thales, Lockheed Martin, Elbit Systems, and others is fierce, leading to innovation and price competitiveness. While potential restraints like budgetary constraints in certain regions and the development of alternative defense technologies exist, the overall market outlook remains positive, driven by continued geopolitical instability and technological advancements. The consistent demand for enhanced accuracy, range, and lethality will continue to shape the market landscape in the coming years.
Artillery Systems Industry: A Comprehensive Market Report (2019-2033)
This in-depth report provides a comprehensive analysis of the global Artillery Systems industry, offering valuable insights for industry professionals, investors, and strategic decision-makers. The report covers the period 2019-2033, with a focus on the forecast period 2025-2033 and a base year of 2025. We analyze key market segments, leading players like Thales, Lockheed Martin, and Elbit Systems, and emerging trends shaping the future of artillery warfare. Expect detailed market sizing, growth projections, and competitive landscaping to support informed strategic planning. The report also covers recent industry developments, including significant contracts awarded to leading companies.
Artillery Systems Industry Market Structure & Innovation Trends
The global artillery systems market is characterized by a moderate level of concentration, with several major players holding significant market share. However, a fragmented landscape also exists, particularly within niche segments and geographically specific markets. Innovation is driven by the continuous need for enhanced accuracy, range, and lethality, alongside efforts to integrate advanced technologies like artificial intelligence and autonomous systems. Stringent regulatory frameworks governing the production and export of military equipment significantly influence market dynamics. Product substitutes, while limited, include alternative weapon systems such as drones and precision-guided munitions. End-user demographics are primarily driven by government defense budgets and geopolitical tensions. Mergers and acquisitions (M&A) activity in the sector has been moderate, with deal values ranging from USD xx Million to USD xx Million in recent years.
- Market Share: Thales holds approximately xx% market share, while Lockheed Martin holds approximately xx%.
- M&A Activity: The past five years have witnessed approximately xx M&A deals, with a total value of approximately USD xx Million.
Artillery Systems Industry Market Dynamics & Trends
The artillery systems market is experiencing steady growth, driven by increasing global defense spending, modernization efforts by armed forces worldwide, and the demand for advanced artillery systems with improved accuracy and range. Technological disruptions, such as the integration of precision-guided munitions and autonomous targeting systems, are reshaping the competitive landscape. Consumer preferences are shifting towards systems offering enhanced battlefield survivability, reduced collateral damage, and improved operational effectiveness. Competitive dynamics are intense, with leading players investing heavily in R&D to maintain their market position. The Compound Annual Growth Rate (CAGR) for the period 2025-2033 is projected to be xx%, with market penetration expected to increase by xx% by 2033.
Dominant Regions & Segments in Artillery Systems Industry
The North American region currently dominates the artillery systems market, driven by robust defense budgets and technological advancements. However, the Asia-Pacific region is experiencing significant growth due to increasing defense modernization efforts in countries like India and China.
Dominant Segments:
- Type: Rocket Artillery shows strong growth due to its extended range and precision capabilities.
- Range: Long-Range (Above 60 kilometers) systems are witnessing high demand, driven by the need for increased firepower and battlefield dominance.
Key Drivers:
- North America: High defense spending, technological advancements, and strong government support.
- Asia-Pacific: Increased defense budgets, regional geopolitical tensions, and modernization of armed forces.
Artillery Systems Industry Product Innovations
Recent product innovations focus on improving accuracy, range, and lethality through the integration of precision-guided munitions, advanced targeting systems, and autonomous capabilities. The development of lighter, more mobile systems is also a key trend, improving deployability and reducing logistical burdens. These advancements enhance battlefield effectiveness while minimizing collateral damage, aligning with evolving military strategies and technological capabilities.
Report Scope & Segmentation Analysis
This report segments the artillery systems market based on type (Howitzer, Mortar, Anti-air Artillery, Rocket Artillery, Other Types) and range (Short Range, Medium Range, Long Range). Each segment is analyzed in terms of market size, growth projections, and competitive dynamics. For example, the Rocket Artillery segment is projected to experience significant growth due to increasing demand for long-range precision strike capabilities. The Long Range segment shows considerable expansion due to technological advancements allowing for increased accuracy and strike distances.
Key Drivers of Artillery Systems Industry Growth
Several factors drive growth in the artillery systems market. These include increased defense spending by major global powers, the ongoing modernization of armed forces worldwide, and the development of new technologies like precision-guided munitions. Furthermore, geopolitical instability and regional conflicts fuel demand for advanced artillery systems, driving market expansion.
Challenges in the Artillery Systems Industry Sector
The artillery systems industry faces several challenges. Stringent export controls and regulatory hurdles impose limitations on market access. Supply chain disruptions and the increasing cost of raw materials present significant operational difficulties. Intense competition from established and emerging players exerts pressure on profit margins.
Emerging Opportunities in Artillery Systems Industry
Emerging opportunities include the increasing adoption of smart munitions and autonomous systems, the integration of artificial intelligence and machine learning, and the growing demand for unmanned and remotely operated artillery systems. New markets in developing countries and the expansion of technological capabilities into existing markets promise considerable growth potential.
Leading Players in the Artillery Systems Industry Market
- THALES
- Lockheed Martin Corporation
- Elbit Systems Ltd
- Rostec
- RUAG Group
- Denel SOC Ltd
- Nexter Group
- Leonardo S p A
- Norinco International Cooperation Ltd
- Hanwha Group
- Avibras Indústria Aeroespacial SA
- Singapore Technologies Engineering Ltd
- Rheinmetall A
- BAE Systems plc
Key Developments in Artillery Systems Industry Industry
- July 2023: Elbit Systems Ltd. announced a USD 150 Million contract for PULS™ rocket launchers and precision-guided rockets, significantly boosting its market position in long-range artillery systems.
- July 2023: BAE Systems Bofors AB secured a USD 4.5 Million contract from the UK MoD for Archer Artillery System support, demonstrating continued demand for existing systems and highlighting the importance of aftermarket services.
Future Outlook for Artillery Systems Industry Market
The artillery systems market is poised for continued growth, driven by sustained defense spending, technological advancements, and evolving military strategies. Strategic partnerships, mergers and acquisitions, and focused R&D investments are expected to further shape the industry landscape, offering substantial opportunities for leading players and emerging companies. The market's future depends heavily on continued innovation in accuracy, range and autonomous systems.
Artillery Systems Industry Segmentation
-
1. Type
- 1.1. Howitzer
- 1.2. Mortar
- 1.3. Anti-air Artillery
- 1.4. Rocket Artillery
- 1.5. Other Types (Naval and Coastal Artillery)
-
2. Range
- 2.1. Short Range (5-30 kilometers)
- 2.2. Medium Range (31-60 kilometers)
- 2.3. Long Range (Above 60 kilometers)
Artillery Systems Industry Segmentation By Geography
-
1. North America
- 1.1. United States
- 1.2. Canada
-
2. Europe
- 2.1. United Kingdom
- 2.2. Germany
- 2.3. France
- 2.4. Russia
- 2.5. Spain
- 2.6. Rest of Europe
-
3. Asia Pacific
- 3.1. China
- 3.2. India
- 3.3. Japan
- 3.4. South Korea
- 3.5. Australia
- 3.6. Rest of Asia Pacific
-
4. Latin America
- 4.1. Brazil
- 4.2. Mexico
- 4.3. Rest of Latin America
-
5. Middle East and Africa
- 5.1. United Arab Emirates
- 5.2. Saudi Arabia
- 5.3. Israel
- 5.4. South Africa
- 5.5. Rest of Middle East and Africa
Artillery Systems Industry REPORT HIGHLIGHTS
| Aspects | Details |
|---|---|
| Study Period | 2019-2033 |
| Base Year | 2024 |
| Estimated Year | 2025 |
| Forecast Period | 2025-2033 |
| Historical Period | 2019-2024 |
| Growth Rate | CAGR of 7.24% from 2019-2033 |
| Segmentation |
|
Table of Contents
- 1. Introduction
- 1.1. Research Scope
- 1.2. Market Segmentation
- 1.3. Research Methodology
- 1.4. Definitions and Assumptions
- 2. Executive Summary
- 2.1. Introduction
- 3. Market Dynamics
- 3.1. Introduction
- 3.2. Market Drivers
- 3.3. Market Restrains
- 3.4. Market Trends
- 3.4.1. Increasing Defense Expenditure Supporting the Growth of the Artillery Systems Market
- 4. Market Factor Analysis
- 4.1. Porters Five Forces
- 4.2. Supply/Value Chain
- 4.3. PESTEL analysis
- 4.4. Market Entropy
- 4.5. Patent/Trademark Analysis
- 5. Global Artillery Systems Industry Analysis, Insights and Forecast, 2019-2031
- 5.1. Market Analysis, Insights and Forecast - by Type
- 5.1.1. Howitzer
- 5.1.2. Mortar
- 5.1.3. Anti-air Artillery
- 5.1.4. Rocket Artillery
- 5.1.5. Other Types (Naval and Coastal Artillery)
- 5.2. Market Analysis, Insights and Forecast - by Range
- 5.2.1. Short Range (5-30 kilometers)
- 5.2.2. Medium Range (31-60 kilometers)
- 5.2.3. Long Range (Above 60 kilometers)
- 5.3. Market Analysis, Insights and Forecast - by Region
- 5.3.1. North America
- 5.3.2. Europe
- 5.3.3. Asia Pacific
- 5.3.4. Latin America
- 5.3.5. Middle East and Africa
- 5.1. Market Analysis, Insights and Forecast - by Type
- 6. North America Artillery Systems Industry Analysis, Insights and Forecast, 2019-2031
- 6.1. Market Analysis, Insights and Forecast - by Type
- 6.1.1. Howitzer
- 6.1.2. Mortar
- 6.1.3. Anti-air Artillery
- 6.1.4. Rocket Artillery
- 6.1.5. Other Types (Naval and Coastal Artillery)
- 6.2. Market Analysis, Insights and Forecast - by Range
- 6.2.1. Short Range (5-30 kilometers)
- 6.2.2. Medium Range (31-60 kilometers)
- 6.2.3. Long Range (Above 60 kilometers)
- 6.1. Market Analysis, Insights and Forecast - by Type
- 7. Europe Artillery Systems Industry Analysis, Insights and Forecast, 2019-2031
- 7.1. Market Analysis, Insights and Forecast - by Type
- 7.1.1. Howitzer
- 7.1.2. Mortar
- 7.1.3. Anti-air Artillery
- 7.1.4. Rocket Artillery
- 7.1.5. Other Types (Naval and Coastal Artillery)
- 7.2. Market Analysis, Insights and Forecast - by Range
- 7.2.1. Short Range (5-30 kilometers)
- 7.2.2. Medium Range (31-60 kilometers)
- 7.2.3. Long Range (Above 60 kilometers)
- 7.1. Market Analysis, Insights and Forecast - by Type
- 8. Asia Pacific Artillery Systems Industry Analysis, Insights and Forecast, 2019-2031
- 8.1. Market Analysis, Insights and Forecast - by Type
- 8.1.1. Howitzer
- 8.1.2. Mortar
- 8.1.3. Anti-air Artillery
- 8.1.4. Rocket Artillery
- 8.1.5. Other Types (Naval and Coastal Artillery)
- 8.2. Market Analysis, Insights and Forecast - by Range
- 8.2.1. Short Range (5-30 kilometers)
- 8.2.2. Medium Range (31-60 kilometers)
- 8.2.3. Long Range (Above 60 kilometers)
- 8.1. Market Analysis, Insights and Forecast - by Type
- 9. Latin America Artillery Systems Industry Analysis, Insights and Forecast, 2019-2031
- 9.1. Market Analysis, Insights and Forecast - by Type
- 9.1.1. Howitzer
- 9.1.2. Mortar
- 9.1.3. Anti-air Artillery
- 9.1.4. Rocket Artillery
- 9.1.5. Other Types (Naval and Coastal Artillery)
- 9.2. Market Analysis, Insights and Forecast - by Range
- 9.2.1. Short Range (5-30 kilometers)
- 9.2.2. Medium Range (31-60 kilometers)
- 9.2.3. Long Range (Above 60 kilometers)
- 9.1. Market Analysis, Insights and Forecast - by Type
- 10. Middle East and Africa Artillery Systems Industry Analysis, Insights and Forecast, 2019-2031
- 10.1. Market Analysis, Insights and Forecast - by Type
- 10.1.1. Howitzer
- 10.1.2. Mortar
- 10.1.3. Anti-air Artillery
- 10.1.4. Rocket Artillery
- 10.1.5. Other Types (Naval and Coastal Artillery)
- 10.2. Market Analysis, Insights and Forecast - by Range
- 10.2.1. Short Range (5-30 kilometers)
- 10.2.2. Medium Range (31-60 kilometers)
- 10.2.3. Long Range (Above 60 kilometers)
- 10.1. Market Analysis, Insights and Forecast - by Type
- 11. North America Artillery Systems Industry Analysis, Insights and Forecast, 2019-2031
- 11.1. Market Analysis, Insights and Forecast - By Country/Sub-region
- 11.1.1 United States
- 11.1.2 Canada
- 12. Europe Artillery Systems Industry Analysis, Insights and Forecast, 2019-2031
- 12.1. Market Analysis, Insights and Forecast - By Country/Sub-region
- 12.1.1 United Kingdom
- 12.1.2 Germany
- 12.1.3 France
- 12.1.4 Russia
- 12.1.5 Spain
- 12.1.6 Rest of Europe
- 13. Asia Pacific Artillery Systems Industry Analysis, Insights and Forecast, 2019-2031
- 13.1. Market Analysis, Insights and Forecast - By Country/Sub-region
- 13.1.1 China
- 13.1.2 India
- 13.1.3 Japan
- 13.1.4 South Korea
- 13.1.5 Australia
- 13.1.6 Rest of Asia Pacific
- 14. Latin America Artillery Systems Industry Analysis, Insights and Forecast, 2019-2031
- 14.1. Market Analysis, Insights and Forecast - By Country/Sub-region
- 14.1.1 Brazil
- 14.1.2 Mexico
- 14.1.3 Rest of Latin America
- 15. Middle East and Africa Artillery Systems Industry Analysis, Insights and Forecast, 2019-2031
- 15.1. Market Analysis, Insights and Forecast - By Country/Sub-region
- 15.1.1 United Arab Emirates
- 15.1.2 Saudi Arabia
- 15.1.3 Israel
- 15.1.4 South Africa
- 15.1.5 Rest of Middle East and Africa
- 16. Competitive Analysis
- 16.1. Global Market Share Analysis 2024
- 16.2. Company Profiles
- 16.2.1 THALES
- 16.2.1.1. Overview
- 16.2.1.2. Products
- 16.2.1.3. SWOT Analysis
- 16.2.1.4. Recent Developments
- 16.2.1.5. Financials (Based on Availability)
- 16.2.2 Lockheed Martin Corporation
- 16.2.2.1. Overview
- 16.2.2.2. Products
- 16.2.2.3. SWOT Analysis
- 16.2.2.4. Recent Developments
- 16.2.2.5. Financials (Based on Availability)
- 16.2.3 Elbit Systems Ltd
- 16.2.3.1. Overview
- 16.2.3.2. Products
- 16.2.3.3. SWOT Analysis
- 16.2.3.4. Recent Developments
- 16.2.3.5. Financials (Based on Availability)
- 16.2.4 Rostec
- 16.2.4.1. Overview
- 16.2.4.2. Products
- 16.2.4.3. SWOT Analysis
- 16.2.4.4. Recent Developments
- 16.2.4.5. Financials (Based on Availability)
- 16.2.5 RUAG Group
- 16.2.5.1. Overview
- 16.2.5.2. Products
- 16.2.5.3. SWOT Analysis
- 16.2.5.4. Recent Developments
- 16.2.5.5. Financials (Based on Availability)
- 16.2.6 Denel SOC Ltd
- 16.2.6.1. Overview
- 16.2.6.2. Products
- 16.2.6.3. SWOT Analysis
- 16.2.6.4. Recent Developments
- 16.2.6.5. Financials (Based on Availability)
- 16.2.7 Nexter Group
- 16.2.7.1. Overview
- 16.2.7.2. Products
- 16.2.7.3. SWOT Analysis
- 16.2.7.4. Recent Developments
- 16.2.7.5. Financials (Based on Availability)
- 16.2.8 Leonardo S p A
- 16.2.8.1. Overview
- 16.2.8.2. Products
- 16.2.8.3. SWOT Analysis
- 16.2.8.4. Recent Developments
- 16.2.8.5. Financials (Based on Availability)
- 16.2.9 Norinco International Cooperation Ltd
- 16.2.9.1. Overview
- 16.2.9.2. Products
- 16.2.9.3. SWOT Analysis
- 16.2.9.4. Recent Developments
- 16.2.9.5. Financials (Based on Availability)
- 16.2.10 Hanwha Group
- 16.2.10.1. Overview
- 16.2.10.2. Products
- 16.2.10.3. SWOT Analysis
- 16.2.10.4. Recent Developments
- 16.2.10.5. Financials (Based on Availability)
- 16.2.11 Avibras Indústria Aeroespacial SA
- 16.2.11.1. Overview
- 16.2.11.2. Products
- 16.2.11.3. SWOT Analysis
- 16.2.11.4. Recent Developments
- 16.2.11.5. Financials (Based on Availability)
- 16.2.12 Singapore Technologies Engineering Ltd
- 16.2.12.1. Overview
- 16.2.12.2. Products
- 16.2.12.3. SWOT Analysis
- 16.2.12.4. Recent Developments
- 16.2.12.5. Financials (Based on Availability)
- 16.2.13 Rheinmetall A
- 16.2.13.1. Overview
- 16.2.13.2. Products
- 16.2.13.3. SWOT Analysis
- 16.2.13.4. Recent Developments
- 16.2.13.5. Financials (Based on Availability)
- 16.2.14 BAE Systems plc
- 16.2.14.1. Overview
- 16.2.14.2. Products
- 16.2.14.3. SWOT Analysis
- 16.2.14.4. Recent Developments
- 16.2.14.5. Financials (Based on Availability)
- 16.2.1 THALES
List of Figures
- Figure 1: Global Artillery Systems Industry Revenue Breakdown (Million, %) by Region 2024 & 2032
- Figure 2: North America Artillery Systems Industry Revenue (Million), by Country 2024 & 2032
- Figure 3: North America Artillery Systems Industry Revenue Share (%), by Country 2024 & 2032
- Figure 4: Europe Artillery Systems Industry Revenue (Million), by Country 2024 & 2032
- Figure 5: Europe Artillery Systems Industry Revenue Share (%), by Country 2024 & 2032
- Figure 6: Asia Pacific Artillery Systems Industry Revenue (Million), by Country 2024 & 2032
- Figure 7: Asia Pacific Artillery Systems Industry Revenue Share (%), by Country 2024 & 2032
- Figure 8: Latin America Artillery Systems Industry Revenue (Million), by Country 2024 & 2032
- Figure 9: Latin America Artillery Systems Industry Revenue Share (%), by Country 2024 & 2032
- Figure 10: Middle East and Africa Artillery Systems Industry Revenue (Million), by Country 2024 & 2032
- Figure 11: Middle East and Africa Artillery Systems Industry Revenue Share (%), by Country 2024 & 2032
- Figure 12: North America Artillery Systems Industry Revenue (Million), by Type 2024 & 2032
- Figure 13: North America Artillery Systems Industry Revenue Share (%), by Type 2024 & 2032
- Figure 14: North America Artillery Systems Industry Revenue (Million), by Range 2024 & 2032
- Figure 15: North America Artillery Systems Industry Revenue Share (%), by Range 2024 & 2032
- Figure 16: North America Artillery Systems Industry Revenue (Million), by Country 2024 & 2032
- Figure 17: North America Artillery Systems Industry Revenue Share (%), by Country 2024 & 2032
- Figure 18: Europe Artillery Systems Industry Revenue (Million), by Type 2024 & 2032
- Figure 19: Europe Artillery Systems Industry Revenue Share (%), by Type 2024 & 2032
- Figure 20: Europe Artillery Systems Industry Revenue (Million), by Range 2024 & 2032
- Figure 21: Europe Artillery Systems Industry Revenue Share (%), by Range 2024 & 2032
- Figure 22: Europe Artillery Systems Industry Revenue (Million), by Country 2024 & 2032
- Figure 23: Europe Artillery Systems Industry Revenue Share (%), by Country 2024 & 2032
- Figure 24: Asia Pacific Artillery Systems Industry Revenue (Million), by Type 2024 & 2032
- Figure 25: Asia Pacific Artillery Systems Industry Revenue Share (%), by Type 2024 & 2032
- Figure 26: Asia Pacific Artillery Systems Industry Revenue (Million), by Range 2024 & 2032
- Figure 27: Asia Pacific Artillery Systems Industry Revenue Share (%), by Range 2024 & 2032
- Figure 28: Asia Pacific Artillery Systems Industry Revenue (Million), by Country 2024 & 2032
- Figure 29: Asia Pacific Artillery Systems Industry Revenue Share (%), by Country 2024 & 2032
- Figure 30: Latin America Artillery Systems Industry Revenue (Million), by Type 2024 & 2032
- Figure 31: Latin America Artillery Systems Industry Revenue Share (%), by Type 2024 & 2032
- Figure 32: Latin America Artillery Systems Industry Revenue (Million), by Range 2024 & 2032
- Figure 33: Latin America Artillery Systems Industry Revenue Share (%), by Range 2024 & 2032
- Figure 34: Latin America Artillery Systems Industry Revenue (Million), by Country 2024 & 2032
- Figure 35: Latin America Artillery Systems Industry Revenue Share (%), by Country 2024 & 2032
- Figure 36: Middle East and Africa Artillery Systems Industry Revenue (Million), by Type 2024 & 2032
- Figure 37: Middle East and Africa Artillery Systems Industry Revenue Share (%), by Type 2024 & 2032
- Figure 38: Middle East and Africa Artillery Systems Industry Revenue (Million), by Range 2024 & 2032
- Figure 39: Middle East and Africa Artillery Systems Industry Revenue Share (%), by Range 2024 & 2032
- Figure 40: Middle East and Africa Artillery Systems Industry Revenue (Million), by Country 2024 & 2032
- Figure 41: Middle East and Africa Artillery Systems Industry Revenue Share (%), by Country 2024 & 2032
List of Tables
- Table 1: Global Artillery Systems Industry Revenue Million Forecast, by Region 2019 & 2032
- Table 2: Global Artillery Systems Industry Revenue Million Forecast, by Type 2019 & 2032
- Table 3: Global Artillery Systems Industry Revenue Million Forecast, by Range 2019 & 2032
- Table 4: Global Artillery Systems Industry Revenue Million Forecast, by Region 2019 & 2032
- Table 5: Global Artillery Systems Industry Revenue Million Forecast, by Country 2019 & 2032
- Table 6: United States Artillery Systems Industry Revenue (Million) Forecast, by Application 2019 & 2032
- Table 7: Canada Artillery Systems Industry Revenue (Million) Forecast, by Application 2019 & 2032
- Table 8: Global Artillery Systems Industry Revenue Million Forecast, by Country 2019 & 2032
- Table 9: United Kingdom Artillery Systems Industry Revenue (Million) Forecast, by Application 2019 & 2032
- Table 10: Germany Artillery Systems Industry Revenue (Million) Forecast, by Application 2019 & 2032
- Table 11: France Artillery Systems Industry Revenue (Million) Forecast, by Application 2019 & 2032
- Table 12: Russia Artillery Systems Industry Revenue (Million) Forecast, by Application 2019 & 2032
- Table 13: Spain Artillery Systems Industry Revenue (Million) Forecast, by Application 2019 & 2032
- Table 14: Rest of Europe Artillery Systems Industry Revenue (Million) Forecast, by Application 2019 & 2032
- Table 15: Global Artillery Systems Industry Revenue Million Forecast, by Country 2019 & 2032
- Table 16: China Artillery Systems Industry Revenue (Million) Forecast, by Application 2019 & 2032
- Table 17: India Artillery Systems Industry Revenue (Million) Forecast, by Application 2019 & 2032
- Table 18: Japan Artillery Systems Industry Revenue (Million) Forecast, by Application 2019 & 2032
- Table 19: South Korea Artillery Systems Industry Revenue (Million) Forecast, by Application 2019 & 2032
- Table 20: Australia Artillery Systems Industry Revenue (Million) Forecast, by Application 2019 & 2032
- Table 21: Rest of Asia Pacific Artillery Systems Industry Revenue (Million) Forecast, by Application 2019 & 2032
- Table 22: Global Artillery Systems Industry Revenue Million Forecast, by Country 2019 & 2032
- Table 23: Brazil Artillery Systems Industry Revenue (Million) Forecast, by Application 2019 & 2032
- Table 24: Mexico Artillery Systems Industry Revenue (Million) Forecast, by Application 2019 & 2032
- Table 25: Rest of Latin America Artillery Systems Industry Revenue (Million) Forecast, by Application 2019 & 2032
- Table 26: Global Artillery Systems Industry Revenue Million Forecast, by Country 2019 & 2032
- Table 27: United Arab Emirates Artillery Systems Industry Revenue (Million) Forecast, by Application 2019 & 2032
- Table 28: Saudi Arabia Artillery Systems Industry Revenue (Million) Forecast, by Application 2019 & 2032
- Table 29: Israel Artillery Systems Industry Revenue (Million) Forecast, by Application 2019 & 2032
- Table 30: South Africa Artillery Systems Industry Revenue (Million) Forecast, by Application 2019 & 2032
- Table 31: Rest of Middle East and Africa Artillery Systems Industry Revenue (Million) Forecast, by Application 2019 & 2032
- Table 32: Global Artillery Systems Industry Revenue Million Forecast, by Type 2019 & 2032
- Table 33: Global Artillery Systems Industry Revenue Million Forecast, by Range 2019 & 2032
- Table 34: Global Artillery Systems Industry Revenue Million Forecast, by Country 2019 & 2032
- Table 35: United States Artillery Systems Industry Revenue (Million) Forecast, by Application 2019 & 2032
- Table 36: Canada Artillery Systems Industry Revenue (Million) Forecast, by Application 2019 & 2032
- Table 37: Global Artillery Systems Industry Revenue Million Forecast, by Type 2019 & 2032
- Table 38: Global Artillery Systems Industry Revenue Million Forecast, by Range 2019 & 2032
- Table 39: Global Artillery Systems Industry Revenue Million Forecast, by Country 2019 & 2032
- Table 40: United Kingdom Artillery Systems Industry Revenue (Million) Forecast, by Application 2019 & 2032
- Table 41: Germany Artillery Systems Industry Revenue (Million) Forecast, by Application 2019 & 2032
- Table 42: France Artillery Systems Industry Revenue (Million) Forecast, by Application 2019 & 2032
- Table 43: Russia Artillery Systems Industry Revenue (Million) Forecast, by Application 2019 & 2032
- Table 44: Spain Artillery Systems Industry Revenue (Million) Forecast, by Application 2019 & 2032
- Table 45: Rest of Europe Artillery Systems Industry Revenue (Million) Forecast, by Application 2019 & 2032
- Table 46: Global Artillery Systems Industry Revenue Million Forecast, by Type 2019 & 2032
- Table 47: Global Artillery Systems Industry Revenue Million Forecast, by Range 2019 & 2032
- Table 48: Global Artillery Systems Industry Revenue Million Forecast, by Country 2019 & 2032
- Table 49: China Artillery Systems Industry Revenue (Million) Forecast, by Application 2019 & 2032
- Table 50: India Artillery Systems Industry Revenue (Million) Forecast, by Application 2019 & 2032
- Table 51: Japan Artillery Systems Industry Revenue (Million) Forecast, by Application 2019 & 2032
- Table 52: South Korea Artillery Systems Industry Revenue (Million) Forecast, by Application 2019 & 2032
- Table 53: Australia Artillery Systems Industry Revenue (Million) Forecast, by Application 2019 & 2032
- Table 54: Rest of Asia Pacific Artillery Systems Industry Revenue (Million) Forecast, by Application 2019 & 2032
- Table 55: Global Artillery Systems Industry Revenue Million Forecast, by Type 2019 & 2032
- Table 56: Global Artillery Systems Industry Revenue Million Forecast, by Range 2019 & 2032
- Table 57: Global Artillery Systems Industry Revenue Million Forecast, by Country 2019 & 2032
- Table 58: Brazil Artillery Systems Industry Revenue (Million) Forecast, by Application 2019 & 2032
- Table 59: Mexico Artillery Systems Industry Revenue (Million) Forecast, by Application 2019 & 2032
- Table 60: Rest of Latin America Artillery Systems Industry Revenue (Million) Forecast, by Application 2019 & 2032
- Table 61: Global Artillery Systems Industry Revenue Million Forecast, by Type 2019 & 2032
- Table 62: Global Artillery Systems Industry Revenue Million Forecast, by Range 2019 & 2032
- Table 63: Global Artillery Systems Industry Revenue Million Forecast, by Country 2019 & 2032
- Table 64: United Arab Emirates Artillery Systems Industry Revenue (Million) Forecast, by Application 2019 & 2032
- Table 65: Saudi Arabia Artillery Systems Industry Revenue (Million) Forecast, by Application 2019 & 2032
- Table 66: Israel Artillery Systems Industry Revenue (Million) Forecast, by Application 2019 & 2032
- Table 67: South Africa Artillery Systems Industry Revenue (Million) Forecast, by Application 2019 & 2032
- Table 68: Rest of Middle East and Africa Artillery Systems Industry Revenue (Million) Forecast, by Application 2019 & 2032
Frequently Asked Questions
1. What is the projected Compound Annual Growth Rate (CAGR) of the Artillery Systems Industry?
The projected CAGR is approximately 7.24%.
2. Which companies are prominent players in the Artillery Systems Industry?
Key companies in the market include THALES, Lockheed Martin Corporation, Elbit Systems Ltd, Rostec, RUAG Group, Denel SOC Ltd, Nexter Group, Leonardo S p A, Norinco International Cooperation Ltd, Hanwha Group, Avibras Indústria Aeroespacial SA, Singapore Technologies Engineering Ltd, Rheinmetall A, BAE Systems plc.
3. What are the main segments of the Artillery Systems Industry?
The market segments include Type, Range.
4. Can you provide details about the market size?
The market size is estimated to be USD 8.84 Million as of 2022.
5. What are some drivers contributing to market growth?
N/A
6. What are the notable trends driving market growth?
Increasing Defense Expenditure Supporting the Growth of the Artillery Systems Market.
7. Are there any restraints impacting market growth?
N/A
8. Can you provide examples of recent developments in the market?
July 2023: Elbit Systems Ltd. announced it was awarded a USD 150 million contract to supply PULS™ (Precise and Universal Launching Systems) rocket launchers and a package of precision-guided long-range rockets.
9. What pricing options are available for accessing the report?
Pricing options include single-user, multi-user, and enterprise licenses priced at USD 4750, USD 5250, and USD 8750 respectively.
10. Is the market size provided in terms of value or volume?
The market size is provided in terms of value, measured in Million.
11. Are there any specific market keywords associated with the report?
Yes, the market keyword associated with the report is "Artillery Systems Industry," which aids in identifying and referencing the specific market segment covered.
12. How do I determine which pricing option suits my needs best?
The pricing options vary based on user requirements and access needs. Individual users may opt for single-user licenses, while businesses requiring broader access may choose multi-user or enterprise licenses for cost-effective access to the report.
13. Are there any additional resources or data provided in the Artillery Systems Industry report?
While the report offers comprehensive insights, it's advisable to review the specific contents or supplementary materials provided to ascertain if additional resources or data are available.
14. How can I stay updated on further developments or reports in the Artillery Systems Industry?
To stay informed about further developments, trends, and reports in the Artillery Systems Industry, consider subscribing to industry newsletters, following relevant companies and organizations, or regularly checking reputable industry news sources and publications.
Methodology
Step 1 - Identification of Relevant Samples Size from Population Database


Step 2 - Approaches for Defining Global Market Size (Value, Volume* & Price*)

Note*: In applicable scenarios
Step 3 - Data Sources
Primary Research
- Web Analytics
- Survey Reports
- Research Institute
- Latest Research Reports
- Opinion Leaders
Secondary Research
- Annual Reports
- White Paper
- Latest Press Release
- Industry Association
- Paid Database
- Investor Presentations

Step 4 - Data Triangulation
Involves using different sources of information in order to increase the validity of a study
These sources are likely to be stakeholders in a program - participants, other researchers, program staff, other community members, and so on.
Then we put all data in single framework & apply various statistical tools to find out the dynamic on the market.
During the analysis stage, feedback from the stakeholder groups would be compared to determine areas of agreement as well as areas of divergence


