
Key Insights
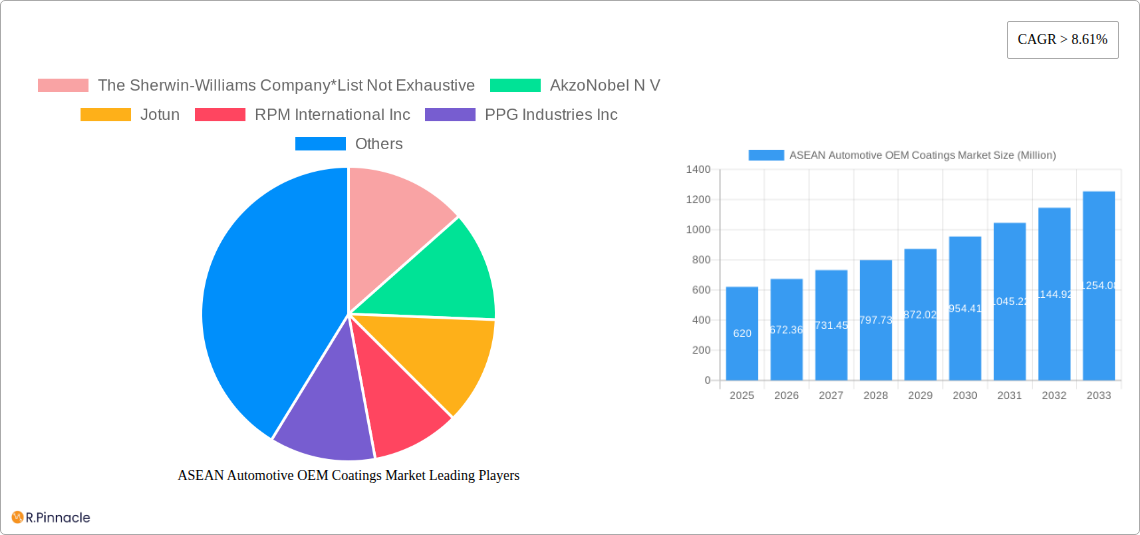
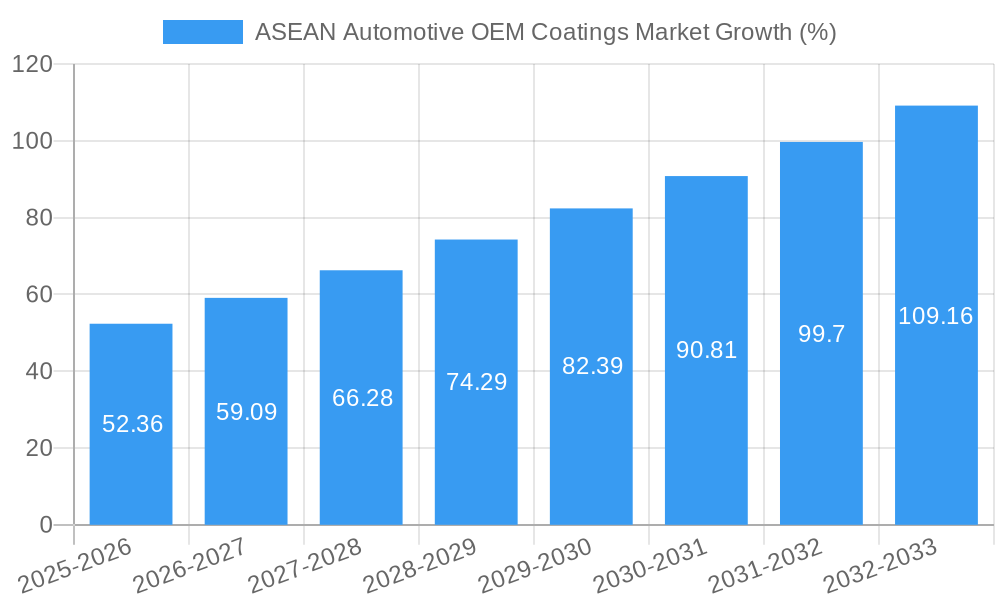
The ASEAN automotive OEM coatings market, valued at approximately $620 million in 2025, is projected to experience robust growth, driven by a Compound Annual Growth Rate (CAGR) exceeding 8.61% from 2025 to 2033. This expansion is fueled by several key factors. Firstly, the burgeoning automotive industry within the ASEAN region, particularly in countries like Indonesia, Thailand, and Vietnam, is a significant driver. Increasing vehicle production, coupled with rising disposable incomes and a growing middle class, significantly boosts demand for high-quality automotive coatings. Secondly, the increasing preference for aesthetically pleasing and durable finishes is pushing the adoption of advanced coating technologies like water-borne and high-performance polyurethane systems. These coatings offer improved corrosion resistance, scratch resistance, and better environmental profiles, aligning with growing sustainability concerns within the automotive sector. Furthermore, the rising adoption of electric vehicles (EVs) in the region presents new opportunities for specialized coatings designed to protect battery components and enhance the overall aesthetic appeal of these vehicles. However, fluctuations in raw material prices and stringent environmental regulations could pose challenges to market growth.
Despite potential restraints, the long-term outlook for the ASEAN automotive OEM coatings market remains positive. The consistent expansion of the automotive manufacturing sector, coupled with evolving consumer preferences towards premium vehicle finishes, will likely outweigh potential challenges. The increasing focus on innovation within the coatings industry, driven by the need for sustainable and high-performance solutions, is also expected to contribute to this positive trajectory. Key players in the market, including multinational corporations and regional players, are strategically investing in research and development to meet the evolving needs of the automotive industry and capitalize on emerging market trends. This competitive landscape, characterized by both innovation and consolidation, further supports the projected growth of the ASEAN automotive OEM coatings market over the forecast period.
ASEAN Automotive OEM Coatings Market: A Comprehensive Report (2019-2033)
This in-depth report provides a comprehensive analysis of the ASEAN Automotive OEM Coatings market, offering invaluable insights for industry professionals, investors, and strategic decision-makers. The study covers the period 2019-2033, with a base year of 2025 and a forecast period of 2025-2033. The report meticulously examines market dynamics, segmentation, competitive landscape, and future growth potential, empowering stakeholders to make informed decisions and capitalize on emerging opportunities.
ASEAN Automotive OEM Coatings Market Structure & Innovation Trends
This section analyzes the competitive landscape of the ASEAN automotive OEM coatings market, encompassing market concentration, innovation drivers, regulatory influences, and key industry activities. We delve into market share dynamics, highlighting the performance of major players like The Sherwin-Williams Company, AkzoNobel N V, Jotun, RPM International Inc, PPG Industries Inc, Beckers Group, Nippon Paint Holdings Co Ltd, BASF SE, Teknos Group, and Axalta Coating Systems LLC. The report also examines the impact of mergers and acquisitions (M&A) on market consolidation, providing an analysis of deal values and their influence on market share. The impact of evolving regulatory frameworks on product development and sustainability initiatives is also assessed. Specific metrics such as market share percentages for key players and total M&A deal values (in Millions) for the period 2019-2024 are included. Analysis includes discussions on the influence of product substitutes and the evolving demographics of end-users in the ASEAN region.
ASEAN Automotive OEM Coatings Market Dynamics & Trends
This section presents a detailed examination of the driving forces shaping the ASEAN automotive OEM coatings market. We explore the factors influencing market growth, including economic growth in the region, rising vehicle production, increasing consumer demand for high-quality finishes, and the impact of technological advancements. The report quantifies this growth with a specific Compound Annual Growth Rate (CAGR) for the forecast period and assesses market penetration rates across various segments. The analysis further explores technological disruptions, specifically the shift towards water-borne coatings and the adoption of advanced application techniques. We also investigate consumer preferences, focusing on factors like color trends, durability expectations, and environmental concerns. Competitive dynamics are examined, including strategies employed by key players to maintain their market position and gain a competitive edge.
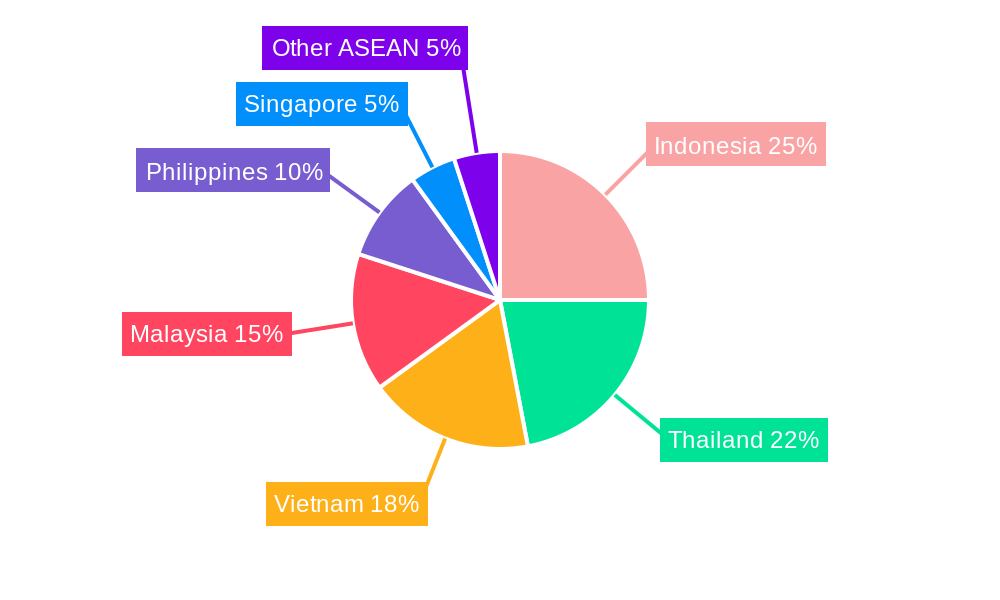
Dominant Regions & Segments in ASEAN Automotive OEM Coatings Market
This section identifies the leading regions, countries, and segments within the ASEAN automotive OEM coatings market. Analysis focuses on key market drivers within dominant segments.
Resin Type: The report analyzes the market share and growth potential of Epoxy, Acrylic, Alkyd, Polyurethane, Polyester, and Other Resin Types. Dominance is analyzed considering factors such as cost-effectiveness, performance characteristics, and regulatory compliance.
Technology: The report explores the market share and growth trends of Water-borne, Solvent-borne, and Other coating technologies, examining the impact of environmental regulations and technological advancements.
End-user Industry: The analysis highlights the market dominance of Passenger Cars, Commercial Vehicles, and Automotive Component Equipment (ACE) segments, identifying drivers such as economic policies, infrastructure development, and automotive production growth in specific ASEAN countries. The section details the reasons behind the dominance of specific regions/segments, providing a thorough qualitative and quantitative assessment. For instance, rapid industrialization in a particular country might be cited as a reason for dominance in a specific segment.
ASEAN Automotive OEM Coatings Market Product Innovations
This section details recent product developments within the ASEAN automotive OEM coatings market, highlighting key innovations, applications, and competitive advantages. The analysis focuses on technological advancements such as the development of sustainable, high-performance coatings and the introduction of innovative application methods. The market fit of these innovations, along with their impact on market competition, is discussed.
Report Scope & Segmentation Analysis
This report segments the ASEAN automotive OEM coatings market based on Resin Type (Epoxy, Acrylic, Alkyd, Polyurethane, Polyester, Other Resin Type), Technology (Water-borne, Solvent-borne, Others), and End-user Industry (Passenger Cars, Commercial Vehicles, ACE). Each segment's growth projections, market size (in Millions), and competitive dynamics are analyzed separately. For example, the report details the projected growth of the water-borne coatings segment driven by environmental regulations, providing specific numbers for market size in Millions for the forecast period.
Key Drivers of ASEAN Automotive OEM Coatings Market Growth
The growth of the ASEAN automotive OEM coatings market is driven by several key factors. These include the burgeoning automotive industry in the region, spurred by rising disposable incomes and increasing urbanization. Government initiatives promoting automotive manufacturing and infrastructure development further contribute to market expansion. Technological advancements, particularly in the development of eco-friendly and high-performance coatings, also play a significant role.
Challenges in the ASEAN Automotive OEM Coatings Market Sector
The ASEAN automotive OEM coatings market faces certain challenges. These include fluctuating raw material prices, stringent environmental regulations, and intense competition among established players. Supply chain disruptions and the need for continuous innovation to meet evolving customer demands present additional obstacles. The report quantifies the impact of these challenges where possible, for example, by estimating the percentage increase in production costs due to raw material price fluctuations.
Emerging Opportunities in ASEAN Automotive OEM Coatings Market
Despite the challenges, the ASEAN automotive OEM coatings market presents numerous opportunities. The growing demand for electric vehicles (EVs) creates a need for specialized coatings. The increasing focus on sustainability opens avenues for eco-friendly and high-performance coating solutions. Furthermore, expanding into new markets and focusing on value-added services can enhance profitability.
Leading Players in the ASEAN Automotive OEM Coatings Market Market
- The Sherwin-Williams Company
- AkzoNobel N V
- Jotun
- RPM International Inc
- PPG Industries Inc
- Beckers Group
- Nippon Paint Holdings Co Ltd
- BASF SE
- Teknos Group
- Axalta Coating Systems LLC
Key Developments in ASEAN Automotive OEM Coatings Market Industry
- [Month Year]: AkzoNobel N V launches a new water-borne coating technology.
- [Month Year]: BASF SE acquires a smaller coatings manufacturer in the region.
- [Month Year]: New environmental regulations are implemented in [Country], impacting the coatings market.
- [Month Year]: A significant new automotive plant opens in [Country], creating demand for coatings. (Note: Replace bracketed information with specific details.)
Future Outlook for ASEAN Automotive OEM Coatings Market Market
The ASEAN automotive OEM coatings market is poised for strong growth in the coming years. Factors such as continued economic expansion, rising vehicle production, and increasing adoption of advanced coating technologies will drive market expansion. Strategic investments in research and development, focus on sustainable solutions, and expansion into new market segments will be crucial for success. The report projects continued market growth, providing specific estimates for market size in Millions for the forecast period.
ASEAN Automotive OEM Coatings Market Segmentation
-
1. Resin Type
- 1.1. Epoxy
- 1.2. Acrylic
- 1.3. Alkyd
- 1.4. Polyurethane
- 1.5. Polyester
- 1.6. Other Resin Type
-
2. Technology
- 2.1. Water-borne
- 2.2. Solvent-borne
- 2.3. Others
-
3. End-user Industry
- 3.1. Passenger Cars
- 3.2. Commercial Vehicles
- 3.3. ACE
-
4. Geography
- 4.1. Indonesia
- 4.2. Malaysia
- 4.3. Thailand
- 4.4. Philippines
- 4.5. Singapore
- 4.6. Rest of ASEAN
ASEAN Automotive OEM Coatings Market Segmentation By Geography
- 1. Indonesia
- 2. Malaysia
- 3. Thailand
- 4. Philippines
- 5. Singapore
- 6. Rest of ASEAN
ASEAN Automotive OEM Coatings Market REPORT HIGHLIGHTS
| Aspects | Details |
|---|---|
| Study Period | 2019-2033 |
| Base Year | 2024 |
| Estimated Year | 2025 |
| Forecast Period | 2025-2033 |
| Historical Period | 2019-2024 |
| Growth Rate | CAGR of > 8.61% from 2019-2033 |
| Segmentation |
|
Table of Contents
- 1. Introduction
- 1.1. Research Scope
- 1.2. Market Segmentation
- 1.3. Research Methodology
- 1.4. Definitions and Assumptions
- 2. Executive Summary
- 2.1. Introduction
- 3. Market Dynamics
- 3.1. Introduction
- 3.2. Market Drivers
- 3.2.1. Rising Demand for Passenger Cars.; Other Drivers
- 3.3. Market Restrains
- 3.3.1. Ongoing Shortage of Semiconductors; Other Restraints
- 3.4. Market Trends
- 3.4.1. Indonesia to Dominate the Market
- 4. Market Factor Analysis
- 4.1. Porters Five Forces
- 4.2. Supply/Value Chain
- 4.3. PESTEL analysis
- 4.4. Market Entropy
- 4.5. Patent/Trademark Analysis
- 5. Global ASEAN Automotive OEM Coatings Market Analysis, Insights and Forecast, 2019-2031
- 5.1. Market Analysis, Insights and Forecast - by Resin Type
- 5.1.1. Epoxy
- 5.1.2. Acrylic
- 5.1.3. Alkyd
- 5.1.4. Polyurethane
- 5.1.5. Polyester
- 5.1.6. Other Resin Type
- 5.2. Market Analysis, Insights and Forecast - by Technology
- 5.2.1. Water-borne
- 5.2.2. Solvent-borne
- 5.2.3. Others
- 5.3. Market Analysis, Insights and Forecast - by End-user Industry
- 5.3.1. Passenger Cars
- 5.3.2. Commercial Vehicles
- 5.3.3. ACE
- 5.4. Market Analysis, Insights and Forecast - by Geography
- 5.4.1. Indonesia
- 5.4.2. Malaysia
- 5.4.3. Thailand
- 5.4.4. Philippines
- 5.4.5. Singapore
- 5.4.6. Rest of ASEAN
- 5.5. Market Analysis, Insights and Forecast - by Region
- 5.5.1. Indonesia
- 5.5.2. Malaysia
- 5.5.3. Thailand
- 5.5.4. Philippines
- 5.5.5. Singapore
- 5.5.6. Rest of ASEAN
- 5.1. Market Analysis, Insights and Forecast - by Resin Type
- 6. Indonesia ASEAN Automotive OEM Coatings Market Analysis, Insights and Forecast, 2019-2031
- 6.1. Market Analysis, Insights and Forecast - by Resin Type
- 6.1.1. Epoxy
- 6.1.2. Acrylic
- 6.1.3. Alkyd
- 6.1.4. Polyurethane
- 6.1.5. Polyester
- 6.1.6. Other Resin Type
- 6.2. Market Analysis, Insights and Forecast - by Technology
- 6.2.1. Water-borne
- 6.2.2. Solvent-borne
- 6.2.3. Others
- 6.3. Market Analysis, Insights and Forecast - by End-user Industry
- 6.3.1. Passenger Cars
- 6.3.2. Commercial Vehicles
- 6.3.3. ACE
- 6.4. Market Analysis, Insights and Forecast - by Geography
- 6.4.1. Indonesia
- 6.4.2. Malaysia
- 6.4.3. Thailand
- 6.4.4. Philippines
- 6.4.5. Singapore
- 6.4.6. Rest of ASEAN
- 6.1. Market Analysis, Insights and Forecast - by Resin Type
- 7. Malaysia ASEAN Automotive OEM Coatings Market Analysis, Insights and Forecast, 2019-2031
- 7.1. Market Analysis, Insights and Forecast - by Resin Type
- 7.1.1. Epoxy
- 7.1.2. Acrylic
- 7.1.3. Alkyd
- 7.1.4. Polyurethane
- 7.1.5. Polyester
- 7.1.6. Other Resin Type
- 7.2. Market Analysis, Insights and Forecast - by Technology
- 7.2.1. Water-borne
- 7.2.2. Solvent-borne
- 7.2.3. Others
- 7.3. Market Analysis, Insights and Forecast - by End-user Industry
- 7.3.1. Passenger Cars
- 7.3.2. Commercial Vehicles
- 7.3.3. ACE
- 7.4. Market Analysis, Insights and Forecast - by Geography
- 7.4.1. Indonesia
- 7.4.2. Malaysia
- 7.4.3. Thailand
- 7.4.4. Philippines
- 7.4.5. Singapore
- 7.4.6. Rest of ASEAN
- 7.1. Market Analysis, Insights and Forecast - by Resin Type
- 8. Thailand ASEAN Automotive OEM Coatings Market Analysis, Insights and Forecast, 2019-2031
- 8.1. Market Analysis, Insights and Forecast - by Resin Type
- 8.1.1. Epoxy
- 8.1.2. Acrylic
- 8.1.3. Alkyd
- 8.1.4. Polyurethane
- 8.1.5. Polyester
- 8.1.6. Other Resin Type
- 8.2. Market Analysis, Insights and Forecast - by Technology
- 8.2.1. Water-borne
- 8.2.2. Solvent-borne
- 8.2.3. Others
- 8.3. Market Analysis, Insights and Forecast - by End-user Industry
- 8.3.1. Passenger Cars
- 8.3.2. Commercial Vehicles
- 8.3.3. ACE
- 8.4. Market Analysis, Insights and Forecast - by Geography
- 8.4.1. Indonesia
- 8.4.2. Malaysia
- 8.4.3. Thailand
- 8.4.4. Philippines
- 8.4.5. Singapore
- 8.4.6. Rest of ASEAN
- 8.1. Market Analysis, Insights and Forecast - by Resin Type
- 9. Philippines ASEAN Automotive OEM Coatings Market Analysis, Insights and Forecast, 2019-2031
- 9.1. Market Analysis, Insights and Forecast - by Resin Type
- 9.1.1. Epoxy
- 9.1.2. Acrylic
- 9.1.3. Alkyd
- 9.1.4. Polyurethane
- 9.1.5. Polyester
- 9.1.6. Other Resin Type
- 9.2. Market Analysis, Insights and Forecast - by Technology
- 9.2.1. Water-borne
- 9.2.2. Solvent-borne
- 9.2.3. Others
- 9.3. Market Analysis, Insights and Forecast - by End-user Industry
- 9.3.1. Passenger Cars
- 9.3.2. Commercial Vehicles
- 9.3.3. ACE
- 9.4. Market Analysis, Insights and Forecast - by Geography
- 9.4.1. Indonesia
- 9.4.2. Malaysia
- 9.4.3. Thailand
- 9.4.4. Philippines
- 9.4.5. Singapore
- 9.4.6. Rest of ASEAN
- 9.1. Market Analysis, Insights and Forecast - by Resin Type
- 10. Singapore ASEAN Automotive OEM Coatings Market Analysis, Insights and Forecast, 2019-2031
- 10.1. Market Analysis, Insights and Forecast - by Resin Type
- 10.1.1. Epoxy
- 10.1.2. Acrylic
- 10.1.3. Alkyd
- 10.1.4. Polyurethane
- 10.1.5. Polyester
- 10.1.6. Other Resin Type
- 10.2. Market Analysis, Insights and Forecast - by Technology
- 10.2.1. Water-borne
- 10.2.2. Solvent-borne
- 10.2.3. Others
- 10.3. Market Analysis, Insights and Forecast - by End-user Industry
- 10.3.1. Passenger Cars
- 10.3.2. Commercial Vehicles
- 10.3.3. ACE
- 10.4. Market Analysis, Insights and Forecast - by Geography
- 10.4.1. Indonesia
- 10.4.2. Malaysia
- 10.4.3. Thailand
- 10.4.4. Philippines
- 10.4.5. Singapore
- 10.4.6. Rest of ASEAN
- 10.1. Market Analysis, Insights and Forecast - by Resin Type
- 11. Rest of ASEAN ASEAN Automotive OEM Coatings Market Analysis, Insights and Forecast, 2019-2031
- 11.1. Market Analysis, Insights and Forecast - by Resin Type
- 11.1.1. Epoxy
- 11.1.2. Acrylic
- 11.1.3. Alkyd
- 11.1.4. Polyurethane
- 11.1.5. Polyester
- 11.1.6. Other Resin Type
- 11.2. Market Analysis, Insights and Forecast - by Technology
- 11.2.1. Water-borne
- 11.2.2. Solvent-borne
- 11.2.3. Others
- 11.3. Market Analysis, Insights and Forecast - by End-user Industry
- 11.3.1. Passenger Cars
- 11.3.2. Commercial Vehicles
- 11.3.3. ACE
- 11.4. Market Analysis, Insights and Forecast - by Geography
- 11.4.1. Indonesia
- 11.4.2. Malaysia
- 11.4.3. Thailand
- 11.4.4. Philippines
- 11.4.5. Singapore
- 11.4.6. Rest of ASEAN
- 11.1. Market Analysis, Insights and Forecast - by Resin Type
- 12. North America ASEAN Automotive OEM Coatings Market Analysis, Insights and Forecast, 2019-2031
- 12.1. Market Analysis, Insights and Forecast - By Country/Sub-region
- 12.1.1 United States
- 12.1.2 Canada
- 12.1.3 Mexico
- 13. Europe ASEAN Automotive OEM Coatings Market Analysis, Insights and Forecast, 2019-2031
- 13.1. Market Analysis, Insights and Forecast - By Country/Sub-region
- 13.1.1 Germany
- 13.1.2 United Kingdom
- 13.1.3 France
- 13.1.4 Spain
- 13.1.5 Italy
- 13.1.6 Spain
- 13.1.7 Belgium
- 13.1.8 Netherland
- 13.1.9 Nordics
- 13.1.10 Rest of Europe
- 14. Asia Pacific ASEAN Automotive OEM Coatings Market Analysis, Insights and Forecast, 2019-2031
- 14.1. Market Analysis, Insights and Forecast - By Country/Sub-region
- 14.1.1 China
- 14.1.2 Japan
- 14.1.3 India
- 14.1.4 South Korea
- 14.1.5 Southeast Asia
- 14.1.6 Australia
- 14.1.7 Indonesia
- 14.1.8 Phillipes
- 14.1.9 Singapore
- 14.1.10 Thailandc
- 14.1.11 Rest of Asia Pacific
- 15. South America ASEAN Automotive OEM Coatings Market Analysis, Insights and Forecast, 2019-2031
- 15.1. Market Analysis, Insights and Forecast - By Country/Sub-region
- 15.1.1 Brazil
- 15.1.2 Argentina
- 15.1.3 Peru
- 15.1.4 Chile
- 15.1.5 Colombia
- 15.1.6 Ecuador
- 15.1.7 Venezuela
- 15.1.8 Rest of South America
- 16. North America ASEAN Automotive OEM Coatings Market Analysis, Insights and Forecast, 2019-2031
- 16.1. Market Analysis, Insights and Forecast - By Country/Sub-region
- 16.1.1 United States
- 16.1.2 Canada
- 16.1.3 Mexico
- 17. MEA ASEAN Automotive OEM Coatings Market Analysis, Insights and Forecast, 2019-2031
- 17.1. Market Analysis, Insights and Forecast - By Country/Sub-region
- 17.1.1 United Arab Emirates
- 17.1.2 Saudi Arabia
- 17.1.3 South Africa
- 17.1.4 Rest of Middle East and Africa
- 18. Competitive Analysis
- 18.1. Global Market Share Analysis 2024
- 18.2. Company Profiles
- 18.2.1 The Sherwin-Williams Company*List Not Exhaustive
- 18.2.1.1. Overview
- 18.2.1.2. Products
- 18.2.1.3. SWOT Analysis
- 18.2.1.4. Recent Developments
- 18.2.1.5. Financials (Based on Availability)
- 18.2.2 AkzoNobel N V
- 18.2.2.1. Overview
- 18.2.2.2. Products
- 18.2.2.3. SWOT Analysis
- 18.2.2.4. Recent Developments
- 18.2.2.5. Financials (Based on Availability)
- 18.2.3 Jotun
- 18.2.3.1. Overview
- 18.2.3.2. Products
- 18.2.3.3. SWOT Analysis
- 18.2.3.4. Recent Developments
- 18.2.3.5. Financials (Based on Availability)
- 18.2.4 RPM International Inc
- 18.2.4.1. Overview
- 18.2.4.2. Products
- 18.2.4.3. SWOT Analysis
- 18.2.4.4. Recent Developments
- 18.2.4.5. Financials (Based on Availability)
- 18.2.5 PPG Industries Inc
- 18.2.5.1. Overview
- 18.2.5.2. Products
- 18.2.5.3. SWOT Analysis
- 18.2.5.4. Recent Developments
- 18.2.5.5. Financials (Based on Availability)
- 18.2.6 Beckers Group
- 18.2.6.1. Overview
- 18.2.6.2. Products
- 18.2.6.3. SWOT Analysis
- 18.2.6.4. Recent Developments
- 18.2.6.5. Financials (Based on Availability)
- 18.2.7 Nippon Paint Holdings Co Ltd
- 18.2.7.1. Overview
- 18.2.7.2. Products
- 18.2.7.3. SWOT Analysis
- 18.2.7.4. Recent Developments
- 18.2.7.5. Financials (Based on Availability)
- 18.2.8 BASF SE
- 18.2.8.1. Overview
- 18.2.8.2. Products
- 18.2.8.3. SWOT Analysis
- 18.2.8.4. Recent Developments
- 18.2.8.5. Financials (Based on Availability)
- 18.2.9 Teknos Group
- 18.2.9.1. Overview
- 18.2.9.2. Products
- 18.2.9.3. SWOT Analysis
- 18.2.9.4. Recent Developments
- 18.2.9.5. Financials (Based on Availability)
- 18.2.10 Axalta Coating Systems LLC
- 18.2.10.1. Overview
- 18.2.10.2. Products
- 18.2.10.3. SWOT Analysis
- 18.2.10.4. Recent Developments
- 18.2.10.5. Financials (Based on Availability)
- 18.2.1 The Sherwin-Williams Company*List Not Exhaustive
List of Figures
- Figure 1: Global ASEAN Automotive OEM Coatings Market Revenue Breakdown (Million, %) by Region 2024 & 2032
- Figure 2: Global ASEAN Automotive OEM Coatings Market Volume Breakdown (liter , %) by Region 2024 & 2032
- Figure 3: North America ASEAN Automotive OEM Coatings Market Revenue (Million), by Country 2024 & 2032
- Figure 4: North America ASEAN Automotive OEM Coatings Market Volume (liter ), by Country 2024 & 2032
- Figure 5: North America ASEAN Automotive OEM Coatings Market Revenue Share (%), by Country 2024 & 2032
- Figure 6: North America ASEAN Automotive OEM Coatings Market Volume Share (%), by Country 2024 & 2032
- Figure 7: Europe ASEAN Automotive OEM Coatings Market Revenue (Million), by Country 2024 & 2032
- Figure 8: Europe ASEAN Automotive OEM Coatings Market Volume (liter ), by Country 2024 & 2032
- Figure 9: Europe ASEAN Automotive OEM Coatings Market Revenue Share (%), by Country 2024 & 2032
- Figure 10: Europe ASEAN Automotive OEM Coatings Market Volume Share (%), by Country 2024 & 2032
- Figure 11: Asia Pacific ASEAN Automotive OEM Coatings Market Revenue (Million), by Country 2024 & 2032
- Figure 12: Asia Pacific ASEAN Automotive OEM Coatings Market Volume (liter ), by Country 2024 & 2032
- Figure 13: Asia Pacific ASEAN Automotive OEM Coatings Market Revenue Share (%), by Country 2024 & 2032
- Figure 14: Asia Pacific ASEAN Automotive OEM Coatings Market Volume Share (%), by Country 2024 & 2032
- Figure 15: South America ASEAN Automotive OEM Coatings Market Revenue (Million), by Country 2024 & 2032
- Figure 16: South America ASEAN Automotive OEM Coatings Market Volume (liter ), by Country 2024 & 2032
- Figure 17: South America ASEAN Automotive OEM Coatings Market Revenue Share (%), by Country 2024 & 2032
- Figure 18: South America ASEAN Automotive OEM Coatings Market Volume Share (%), by Country 2024 & 2032
- Figure 19: North America ASEAN Automotive OEM Coatings Market Revenue (Million), by Country 2024 & 2032
- Figure 20: North America ASEAN Automotive OEM Coatings Market Volume (liter ), by Country 2024 & 2032
- Figure 21: North America ASEAN Automotive OEM Coatings Market Revenue Share (%), by Country 2024 & 2032
- Figure 22: North America ASEAN Automotive OEM Coatings Market Volume Share (%), by Country 2024 & 2032
- Figure 23: MEA ASEAN Automotive OEM Coatings Market Revenue (Million), by Country 2024 & 2032
- Figure 24: MEA ASEAN Automotive OEM Coatings Market Volume (liter ), by Country 2024 & 2032
- Figure 25: MEA ASEAN Automotive OEM Coatings Market Revenue Share (%), by Country 2024 & 2032
- Figure 26: MEA ASEAN Automotive OEM Coatings Market Volume Share (%), by Country 2024 & 2032
- Figure 27: Indonesia ASEAN Automotive OEM Coatings Market Revenue (Million), by Resin Type 2024 & 2032
- Figure 28: Indonesia ASEAN Automotive OEM Coatings Market Volume (liter ), by Resin Type 2024 & 2032
- Figure 29: Indonesia ASEAN Automotive OEM Coatings Market Revenue Share (%), by Resin Type 2024 & 2032
- Figure 30: Indonesia ASEAN Automotive OEM Coatings Market Volume Share (%), by Resin Type 2024 & 2032
- Figure 31: Indonesia ASEAN Automotive OEM Coatings Market Revenue (Million), by Technology 2024 & 2032
- Figure 32: Indonesia ASEAN Automotive OEM Coatings Market Volume (liter ), by Technology 2024 & 2032
- Figure 33: Indonesia ASEAN Automotive OEM Coatings Market Revenue Share (%), by Technology 2024 & 2032
- Figure 34: Indonesia ASEAN Automotive OEM Coatings Market Volume Share (%), by Technology 2024 & 2032
- Figure 35: Indonesia ASEAN Automotive OEM Coatings Market Revenue (Million), by End-user Industry 2024 & 2032
- Figure 36: Indonesia ASEAN Automotive OEM Coatings Market Volume (liter ), by End-user Industry 2024 & 2032
- Figure 37: Indonesia ASEAN Automotive OEM Coatings Market Revenue Share (%), by End-user Industry 2024 & 2032
- Figure 38: Indonesia ASEAN Automotive OEM Coatings Market Volume Share (%), by End-user Industry 2024 & 2032
- Figure 39: Indonesia ASEAN Automotive OEM Coatings Market Revenue (Million), by Geography 2024 & 2032
- Figure 40: Indonesia ASEAN Automotive OEM Coatings Market Volume (liter ), by Geography 2024 & 2032
- Figure 41: Indonesia ASEAN Automotive OEM Coatings Market Revenue Share (%), by Geography 2024 & 2032
- Figure 42: Indonesia ASEAN Automotive OEM Coatings Market Volume Share (%), by Geography 2024 & 2032
- Figure 43: Indonesia ASEAN Automotive OEM Coatings Market Revenue (Million), by Country 2024 & 2032
- Figure 44: Indonesia ASEAN Automotive OEM Coatings Market Volume (liter ), by Country 2024 & 2032
- Figure 45: Indonesia ASEAN Automotive OEM Coatings Market Revenue Share (%), by Country 2024 & 2032
- Figure 46: Indonesia ASEAN Automotive OEM Coatings Market Volume Share (%), by Country 2024 & 2032
- Figure 47: Malaysia ASEAN Automotive OEM Coatings Market Revenue (Million), by Resin Type 2024 & 2032
- Figure 48: Malaysia ASEAN Automotive OEM Coatings Market Volume (liter ), by Resin Type 2024 & 2032
- Figure 49: Malaysia ASEAN Automotive OEM Coatings Market Revenue Share (%), by Resin Type 2024 & 2032
- Figure 50: Malaysia ASEAN Automotive OEM Coatings Market Volume Share (%), by Resin Type 2024 & 2032
- Figure 51: Malaysia ASEAN Automotive OEM Coatings Market Revenue (Million), by Technology 2024 & 2032
- Figure 52: Malaysia ASEAN Automotive OEM Coatings Market Volume (liter ), by Technology 2024 & 2032
- Figure 53: Malaysia ASEAN Automotive OEM Coatings Market Revenue Share (%), by Technology 2024 & 2032
- Figure 54: Malaysia ASEAN Automotive OEM Coatings Market Volume Share (%), by Technology 2024 & 2032
- Figure 55: Malaysia ASEAN Automotive OEM Coatings Market Revenue (Million), by End-user Industry 2024 & 2032
- Figure 56: Malaysia ASEAN Automotive OEM Coatings Market Volume (liter ), by End-user Industry 2024 & 2032
- Figure 57: Malaysia ASEAN Automotive OEM Coatings Market Revenue Share (%), by End-user Industry 2024 & 2032
- Figure 58: Malaysia ASEAN Automotive OEM Coatings Market Volume Share (%), by End-user Industry 2024 & 2032
- Figure 59: Malaysia ASEAN Automotive OEM Coatings Market Revenue (Million), by Geography 2024 & 2032
- Figure 60: Malaysia ASEAN Automotive OEM Coatings Market Volume (liter ), by Geography 2024 & 2032
- Figure 61: Malaysia ASEAN Automotive OEM Coatings Market Revenue Share (%), by Geography 2024 & 2032
- Figure 62: Malaysia ASEAN Automotive OEM Coatings Market Volume Share (%), by Geography 2024 & 2032
- Figure 63: Malaysia ASEAN Automotive OEM Coatings Market Revenue (Million), by Country 2024 & 2032
- Figure 64: Malaysia ASEAN Automotive OEM Coatings Market Volume (liter ), by Country 2024 & 2032
- Figure 65: Malaysia ASEAN Automotive OEM Coatings Market Revenue Share (%), by Country 2024 & 2032
- Figure 66: Malaysia ASEAN Automotive OEM Coatings Market Volume Share (%), by Country 2024 & 2032
- Figure 67: Thailand ASEAN Automotive OEM Coatings Market Revenue (Million), by Resin Type 2024 & 2032
- Figure 68: Thailand ASEAN Automotive OEM Coatings Market Volume (liter ), by Resin Type 2024 & 2032
- Figure 69: Thailand ASEAN Automotive OEM Coatings Market Revenue Share (%), by Resin Type 2024 & 2032
- Figure 70: Thailand ASEAN Automotive OEM Coatings Market Volume Share (%), by Resin Type 2024 & 2032
- Figure 71: Thailand ASEAN Automotive OEM Coatings Market Revenue (Million), by Technology 2024 & 2032
- Figure 72: Thailand ASEAN Automotive OEM Coatings Market Volume (liter ), by Technology 2024 & 2032
- Figure 73: Thailand ASEAN Automotive OEM Coatings Market Revenue Share (%), by Technology 2024 & 2032
- Figure 74: Thailand ASEAN Automotive OEM Coatings Market Volume Share (%), by Technology 2024 & 2032
- Figure 75: Thailand ASEAN Automotive OEM Coatings Market Revenue (Million), by End-user Industry 2024 & 2032
- Figure 76: Thailand ASEAN Automotive OEM Coatings Market Volume (liter ), by End-user Industry 2024 & 2032
- Figure 77: Thailand ASEAN Automotive OEM Coatings Market Revenue Share (%), by End-user Industry 2024 & 2032
- Figure 78: Thailand ASEAN Automotive OEM Coatings Market Volume Share (%), by End-user Industry 2024 & 2032
- Figure 79: Thailand ASEAN Automotive OEM Coatings Market Revenue (Million), by Geography 2024 & 2032
- Figure 80: Thailand ASEAN Automotive OEM Coatings Market Volume (liter ), by Geography 2024 & 2032
- Figure 81: Thailand ASEAN Automotive OEM Coatings Market Revenue Share (%), by Geography 2024 & 2032
- Figure 82: Thailand ASEAN Automotive OEM Coatings Market Volume Share (%), by Geography 2024 & 2032
- Figure 83: Thailand ASEAN Automotive OEM Coatings Market Revenue (Million), by Country 2024 & 2032
- Figure 84: Thailand ASEAN Automotive OEM Coatings Market Volume (liter ), by Country 2024 & 2032
- Figure 85: Thailand ASEAN Automotive OEM Coatings Market Revenue Share (%), by Country 2024 & 2032
- Figure 86: Thailand ASEAN Automotive OEM Coatings Market Volume Share (%), by Country 2024 & 2032
- Figure 87: Philippines ASEAN Automotive OEM Coatings Market Revenue (Million), by Resin Type 2024 & 2032
- Figure 88: Philippines ASEAN Automotive OEM Coatings Market Volume (liter ), by Resin Type 2024 & 2032
- Figure 89: Philippines ASEAN Automotive OEM Coatings Market Revenue Share (%), by Resin Type 2024 & 2032
- Figure 90: Philippines ASEAN Automotive OEM Coatings Market Volume Share (%), by Resin Type 2024 & 2032
- Figure 91: Philippines ASEAN Automotive OEM Coatings Market Revenue (Million), by Technology 2024 & 2032
- Figure 92: Philippines ASEAN Automotive OEM Coatings Market Volume (liter ), by Technology 2024 & 2032
- Figure 93: Philippines ASEAN Automotive OEM Coatings Market Revenue Share (%), by Technology 2024 & 2032
- Figure 94: Philippines ASEAN Automotive OEM Coatings Market Volume Share (%), by Technology 2024 & 2032
- Figure 95: Philippines ASEAN Automotive OEM Coatings Market Revenue (Million), by End-user Industry 2024 & 2032
- Figure 96: Philippines ASEAN Automotive OEM Coatings Market Volume (liter ), by End-user Industry 2024 & 2032
- Figure 97: Philippines ASEAN Automotive OEM Coatings Market Revenue Share (%), by End-user Industry 2024 & 2032
- Figure 98: Philippines ASEAN Automotive OEM Coatings Market Volume Share (%), by End-user Industry 2024 & 2032
- Figure 99: Philippines ASEAN Automotive OEM Coatings Market Revenue (Million), by Geography 2024 & 2032
- Figure 100: Philippines ASEAN Automotive OEM Coatings Market Volume (liter ), by Geography 2024 & 2032
- Figure 101: Philippines ASEAN Automotive OEM Coatings Market Revenue Share (%), by Geography 2024 & 2032
- Figure 102: Philippines ASEAN Automotive OEM Coatings Market Volume Share (%), by Geography 2024 & 2032
- Figure 103: Philippines ASEAN Automotive OEM Coatings Market Revenue (Million), by Country 2024 & 2032
- Figure 104: Philippines ASEAN Automotive OEM Coatings Market Volume (liter ), by Country 2024 & 2032
- Figure 105: Philippines ASEAN Automotive OEM Coatings Market Revenue Share (%), by Country 2024 & 2032
- Figure 106: Philippines ASEAN Automotive OEM Coatings Market Volume Share (%), by Country 2024 & 2032
- Figure 107: Singapore ASEAN Automotive OEM Coatings Market Revenue (Million), by Resin Type 2024 & 2032
- Figure 108: Singapore ASEAN Automotive OEM Coatings Market Volume (liter ), by Resin Type 2024 & 2032
- Figure 109: Singapore ASEAN Automotive OEM Coatings Market Revenue Share (%), by Resin Type 2024 & 2032
- Figure 110: Singapore ASEAN Automotive OEM Coatings Market Volume Share (%), by Resin Type 2024 & 2032
- Figure 111: Singapore ASEAN Automotive OEM Coatings Market Revenue (Million), by Technology 2024 & 2032
- Figure 112: Singapore ASEAN Automotive OEM Coatings Market Volume (liter ), by Technology 2024 & 2032
- Figure 113: Singapore ASEAN Automotive OEM Coatings Market Revenue Share (%), by Technology 2024 & 2032
- Figure 114: Singapore ASEAN Automotive OEM Coatings Market Volume Share (%), by Technology 2024 & 2032
- Figure 115: Singapore ASEAN Automotive OEM Coatings Market Revenue (Million), by End-user Industry 2024 & 2032
- Figure 116: Singapore ASEAN Automotive OEM Coatings Market Volume (liter ), by End-user Industry 2024 & 2032
- Figure 117: Singapore ASEAN Automotive OEM Coatings Market Revenue Share (%), by End-user Industry 2024 & 2032
- Figure 118: Singapore ASEAN Automotive OEM Coatings Market Volume Share (%), by End-user Industry 2024 & 2032
- Figure 119: Singapore ASEAN Automotive OEM Coatings Market Revenue (Million), by Geography 2024 & 2032
- Figure 120: Singapore ASEAN Automotive OEM Coatings Market Volume (liter ), by Geography 2024 & 2032
- Figure 121: Singapore ASEAN Automotive OEM Coatings Market Revenue Share (%), by Geography 2024 & 2032
- Figure 122: Singapore ASEAN Automotive OEM Coatings Market Volume Share (%), by Geography 2024 & 2032
- Figure 123: Singapore ASEAN Automotive OEM Coatings Market Revenue (Million), by Country 2024 & 2032
- Figure 124: Singapore ASEAN Automotive OEM Coatings Market Volume (liter ), by Country 2024 & 2032
- Figure 125: Singapore ASEAN Automotive OEM Coatings Market Revenue Share (%), by Country 2024 & 2032
- Figure 126: Singapore ASEAN Automotive OEM Coatings Market Volume Share (%), by Country 2024 & 2032
- Figure 127: Rest of ASEAN ASEAN Automotive OEM Coatings Market Revenue (Million), by Resin Type 2024 & 2032
- Figure 128: Rest of ASEAN ASEAN Automotive OEM Coatings Market Volume (liter ), by Resin Type 2024 & 2032
- Figure 129: Rest of ASEAN ASEAN Automotive OEM Coatings Market Revenue Share (%), by Resin Type 2024 & 2032
- Figure 130: Rest of ASEAN ASEAN Automotive OEM Coatings Market Volume Share (%), by Resin Type 2024 & 2032
- Figure 131: Rest of ASEAN ASEAN Automotive OEM Coatings Market Revenue (Million), by Technology 2024 & 2032
- Figure 132: Rest of ASEAN ASEAN Automotive OEM Coatings Market Volume (liter ), by Technology 2024 & 2032
- Figure 133: Rest of ASEAN ASEAN Automotive OEM Coatings Market Revenue Share (%), by Technology 2024 & 2032
- Figure 134: Rest of ASEAN ASEAN Automotive OEM Coatings Market Volume Share (%), by Technology 2024 & 2032
- Figure 135: Rest of ASEAN ASEAN Automotive OEM Coatings Market Revenue (Million), by End-user Industry 2024 & 2032
- Figure 136: Rest of ASEAN ASEAN Automotive OEM Coatings Market Volume (liter ), by End-user Industry 2024 & 2032
- Figure 137: Rest of ASEAN ASEAN Automotive OEM Coatings Market Revenue Share (%), by End-user Industry 2024 & 2032
- Figure 138: Rest of ASEAN ASEAN Automotive OEM Coatings Market Volume Share (%), by End-user Industry 2024 & 2032
- Figure 139: Rest of ASEAN ASEAN Automotive OEM Coatings Market Revenue (Million), by Geography 2024 & 2032
- Figure 140: Rest of ASEAN ASEAN Automotive OEM Coatings Market Volume (liter ), by Geography 2024 & 2032
- Figure 141: Rest of ASEAN ASEAN Automotive OEM Coatings Market Revenue Share (%), by Geography 2024 & 2032
- Figure 142: Rest of ASEAN ASEAN Automotive OEM Coatings Market Volume Share (%), by Geography 2024 & 2032
- Figure 143: Rest of ASEAN ASEAN Automotive OEM Coatings Market Revenue (Million), by Country 2024 & 2032
- Figure 144: Rest of ASEAN ASEAN Automotive OEM Coatings Market Volume (liter ), by Country 2024 & 2032
- Figure 145: Rest of ASEAN ASEAN Automotive OEM Coatings Market Revenue Share (%), by Country 2024 & 2032
- Figure 146: Rest of ASEAN ASEAN Automotive OEM Coatings Market Volume Share (%), by Country 2024 & 2032
List of Tables
- Table 1: Global ASEAN Automotive OEM Coatings Market Revenue Million Forecast, by Region 2019 & 2032
- Table 2: Global ASEAN Automotive OEM Coatings Market Volume liter Forecast, by Region 2019 & 2032
- Table 3: Global ASEAN Automotive OEM Coatings Market Revenue Million Forecast, by Resin Type 2019 & 2032
- Table 4: Global ASEAN Automotive OEM Coatings Market Volume liter Forecast, by Resin Type 2019 & 2032
- Table 5: Global ASEAN Automotive OEM Coatings Market Revenue Million Forecast, by Technology 2019 & 2032
- Table 6: Global ASEAN Automotive OEM Coatings Market Volume liter Forecast, by Technology 2019 & 2032
- Table 7: Global ASEAN Automotive OEM Coatings Market Revenue Million Forecast, by End-user Industry 2019 & 2032
- Table 8: Global ASEAN Automotive OEM Coatings Market Volume liter Forecast, by End-user Industry 2019 & 2032
- Table 9: Global ASEAN Automotive OEM Coatings Market Revenue Million Forecast, by Geography 2019 & 2032
- Table 10: Global ASEAN Automotive OEM Coatings Market Volume liter Forecast, by Geography 2019 & 2032
- Table 11: Global ASEAN Automotive OEM Coatings Market Revenue Million Forecast, by Region 2019 & 2032
- Table 12: Global ASEAN Automotive OEM Coatings Market Volume liter Forecast, by Region 2019 & 2032
- Table 13: Global ASEAN Automotive OEM Coatings Market Revenue Million Forecast, by Country 2019 & 2032
- Table 14: Global ASEAN Automotive OEM Coatings Market Volume liter Forecast, by Country 2019 & 2032
- Table 15: United States ASEAN Automotive OEM Coatings Market Revenue (Million) Forecast, by Application 2019 & 2032
- Table 16: United States ASEAN Automotive OEM Coatings Market Volume (liter ) Forecast, by Application 2019 & 2032
- Table 17: Canada ASEAN Automotive OEM Coatings Market Revenue (Million) Forecast, by Application 2019 & 2032
- Table 18: Canada ASEAN Automotive OEM Coatings Market Volume (liter ) Forecast, by Application 2019 & 2032
- Table 19: Mexico ASEAN Automotive OEM Coatings Market Revenue (Million) Forecast, by Application 2019 & 2032
- Table 20: Mexico ASEAN Automotive OEM Coatings Market Volume (liter ) Forecast, by Application 2019 & 2032
- Table 21: Global ASEAN Automotive OEM Coatings Market Revenue Million Forecast, by Country 2019 & 2032
- Table 22: Global ASEAN Automotive OEM Coatings Market Volume liter Forecast, by Country 2019 & 2032
- Table 23: Germany ASEAN Automotive OEM Coatings Market Revenue (Million) Forecast, by Application 2019 & 2032
- Table 24: Germany ASEAN Automotive OEM Coatings Market Volume (liter ) Forecast, by Application 2019 & 2032
- Table 25: United Kingdom ASEAN Automotive OEM Coatings Market Revenue (Million) Forecast, by Application 2019 & 2032
- Table 26: United Kingdom ASEAN Automotive OEM Coatings Market Volume (liter ) Forecast, by Application 2019 & 2032
- Table 27: France ASEAN Automotive OEM Coatings Market Revenue (Million) Forecast, by Application 2019 & 2032
- Table 28: France ASEAN Automotive OEM Coatings Market Volume (liter ) Forecast, by Application 2019 & 2032
- Table 29: Spain ASEAN Automotive OEM Coatings Market Revenue (Million) Forecast, by Application 2019 & 2032
- Table 30: Spain ASEAN Automotive OEM Coatings Market Volume (liter ) Forecast, by Application 2019 & 2032
- Table 31: Italy ASEAN Automotive OEM Coatings Market Revenue (Million) Forecast, by Application 2019 & 2032
- Table 32: Italy ASEAN Automotive OEM Coatings Market Volume (liter ) Forecast, by Application 2019 & 2032
- Table 33: Spain ASEAN Automotive OEM Coatings Market Revenue (Million) Forecast, by Application 2019 & 2032
- Table 34: Spain ASEAN Automotive OEM Coatings Market Volume (liter ) Forecast, by Application 2019 & 2032
- Table 35: Belgium ASEAN Automotive OEM Coatings Market Revenue (Million) Forecast, by Application 2019 & 2032
- Table 36: Belgium ASEAN Automotive OEM Coatings Market Volume (liter ) Forecast, by Application 2019 & 2032
- Table 37: Netherland ASEAN Automotive OEM Coatings Market Revenue (Million) Forecast, by Application 2019 & 2032
- Table 38: Netherland ASEAN Automotive OEM Coatings Market Volume (liter ) Forecast, by Application 2019 & 2032
- Table 39: Nordics ASEAN Automotive OEM Coatings Market Revenue (Million) Forecast, by Application 2019 & 2032
- Table 40: Nordics ASEAN Automotive OEM Coatings Market Volume (liter ) Forecast, by Application 2019 & 2032
- Table 41: Rest of Europe ASEAN Automotive OEM Coatings Market Revenue (Million) Forecast, by Application 2019 & 2032
- Table 42: Rest of Europe ASEAN Automotive OEM Coatings Market Volume (liter ) Forecast, by Application 2019 & 2032
- Table 43: Global ASEAN Automotive OEM Coatings Market Revenue Million Forecast, by Country 2019 & 2032
- Table 44: Global ASEAN Automotive OEM Coatings Market Volume liter Forecast, by Country 2019 & 2032
- Table 45: China ASEAN Automotive OEM Coatings Market Revenue (Million) Forecast, by Application 2019 & 2032
- Table 46: China ASEAN Automotive OEM Coatings Market Volume (liter ) Forecast, by Application 2019 & 2032
- Table 47: Japan ASEAN Automotive OEM Coatings Market Revenue (Million) Forecast, by Application 2019 & 2032
- Table 48: Japan ASEAN Automotive OEM Coatings Market Volume (liter ) Forecast, by Application 2019 & 2032
- Table 49: India ASEAN Automotive OEM Coatings Market Revenue (Million) Forecast, by Application 2019 & 2032
- Table 50: India ASEAN Automotive OEM Coatings Market Volume (liter ) Forecast, by Application 2019 & 2032
- Table 51: South Korea ASEAN Automotive OEM Coatings Market Revenue (Million) Forecast, by Application 2019 & 2032
- Table 52: South Korea ASEAN Automotive OEM Coatings Market Volume (liter ) Forecast, by Application 2019 & 2032
- Table 53: Southeast Asia ASEAN Automotive OEM Coatings Market Revenue (Million) Forecast, by Application 2019 & 2032
- Table 54: Southeast Asia ASEAN Automotive OEM Coatings Market Volume (liter ) Forecast, by Application 2019 & 2032
- Table 55: Australia ASEAN Automotive OEM Coatings Market Revenue (Million) Forecast, by Application 2019 & 2032
- Table 56: Australia ASEAN Automotive OEM Coatings Market Volume (liter ) Forecast, by Application 2019 & 2032
- Table 57: Indonesia ASEAN Automotive OEM Coatings Market Revenue (Million) Forecast, by Application 2019 & 2032
- Table 58: Indonesia ASEAN Automotive OEM Coatings Market Volume (liter ) Forecast, by Application 2019 & 2032
- Table 59: Phillipes ASEAN Automotive OEM Coatings Market Revenue (Million) Forecast, by Application 2019 & 2032
- Table 60: Phillipes ASEAN Automotive OEM Coatings Market Volume (liter ) Forecast, by Application 2019 & 2032
- Table 61: Singapore ASEAN Automotive OEM Coatings Market Revenue (Million) Forecast, by Application 2019 & 2032
- Table 62: Singapore ASEAN Automotive OEM Coatings Market Volume (liter ) Forecast, by Application 2019 & 2032
- Table 63: Thailandc ASEAN Automotive OEM Coatings Market Revenue (Million) Forecast, by Application 2019 & 2032
- Table 64: Thailandc ASEAN Automotive OEM Coatings Market Volume (liter ) Forecast, by Application 2019 & 2032
- Table 65: Rest of Asia Pacific ASEAN Automotive OEM Coatings Market Revenue (Million) Forecast, by Application 2019 & 2032
- Table 66: Rest of Asia Pacific ASEAN Automotive OEM Coatings Market Volume (liter ) Forecast, by Application 2019 & 2032
- Table 67: Global ASEAN Automotive OEM Coatings Market Revenue Million Forecast, by Country 2019 & 2032
- Table 68: Global ASEAN Automotive OEM Coatings Market Volume liter Forecast, by Country 2019 & 2032
- Table 69: Brazil ASEAN Automotive OEM Coatings Market Revenue (Million) Forecast, by Application 2019 & 2032
- Table 70: Brazil ASEAN Automotive OEM Coatings Market Volume (liter ) Forecast, by Application 2019 & 2032
- Table 71: Argentina ASEAN Automotive OEM Coatings Market Revenue (Million) Forecast, by Application 2019 & 2032
- Table 72: Argentina ASEAN Automotive OEM Coatings Market Volume (liter ) Forecast, by Application 2019 & 2032
- Table 73: Peru ASEAN Automotive OEM Coatings Market Revenue (Million) Forecast, by Application 2019 & 2032
- Table 74: Peru ASEAN Automotive OEM Coatings Market Volume (liter ) Forecast, by Application 2019 & 2032
- Table 75: Chile ASEAN Automotive OEM Coatings Market Revenue (Million) Forecast, by Application 2019 & 2032
- Table 76: Chile ASEAN Automotive OEM Coatings Market Volume (liter ) Forecast, by Application 2019 & 2032
- Table 77: Colombia ASEAN Automotive OEM Coatings Market Revenue (Million) Forecast, by Application 2019 & 2032
- Table 78: Colombia ASEAN Automotive OEM Coatings Market Volume (liter ) Forecast, by Application 2019 & 2032
- Table 79: Ecuador ASEAN Automotive OEM Coatings Market Revenue (Million) Forecast, by Application 2019 & 2032
- Table 80: Ecuador ASEAN Automotive OEM Coatings Market Volume (liter ) Forecast, by Application 2019 & 2032
- Table 81: Venezuela ASEAN Automotive OEM Coatings Market Revenue (Million) Forecast, by Application 2019 & 2032
- Table 82: Venezuela ASEAN Automotive OEM Coatings Market Volume (liter ) Forecast, by Application 2019 & 2032
- Table 83: Rest of South America ASEAN Automotive OEM Coatings Market Revenue (Million) Forecast, by Application 2019 & 2032
- Table 84: Rest of South America ASEAN Automotive OEM Coatings Market Volume (liter ) Forecast, by Application 2019 & 2032
- Table 85: Global ASEAN Automotive OEM Coatings Market Revenue Million Forecast, by Country 2019 & 2032
- Table 86: Global ASEAN Automotive OEM Coatings Market Volume liter Forecast, by Country 2019 & 2032
- Table 87: United States ASEAN Automotive OEM Coatings Market Revenue (Million) Forecast, by Application 2019 & 2032
- Table 88: United States ASEAN Automotive OEM Coatings Market Volume (liter ) Forecast, by Application 2019 & 2032
- Table 89: Canada ASEAN Automotive OEM Coatings Market Revenue (Million) Forecast, by Application 2019 & 2032
- Table 90: Canada ASEAN Automotive OEM Coatings Market Volume (liter ) Forecast, by Application 2019 & 2032
- Table 91: Mexico ASEAN Automotive OEM Coatings Market Revenue (Million) Forecast, by Application 2019 & 2032
- Table 92: Mexico ASEAN Automotive OEM Coatings Market Volume (liter ) Forecast, by Application 2019 & 2032
- Table 93: Global ASEAN Automotive OEM Coatings Market Revenue Million Forecast, by Country 2019 & 2032
- Table 94: Global ASEAN Automotive OEM Coatings Market Volume liter Forecast, by Country 2019 & 2032
- Table 95: United Arab Emirates ASEAN Automotive OEM Coatings Market Revenue (Million) Forecast, by Application 2019 & 2032
- Table 96: United Arab Emirates ASEAN Automotive OEM Coatings Market Volume (liter ) Forecast, by Application 2019 & 2032
- Table 97: Saudi Arabia ASEAN Automotive OEM Coatings Market Revenue (Million) Forecast, by Application 2019 & 2032
- Table 98: Saudi Arabia ASEAN Automotive OEM Coatings Market Volume (liter ) Forecast, by Application 2019 & 2032
- Table 99: South Africa ASEAN Automotive OEM Coatings Market Revenue (Million) Forecast, by Application 2019 & 2032
- Table 100: South Africa ASEAN Automotive OEM Coatings Market Volume (liter ) Forecast, by Application 2019 & 2032
- Table 101: Rest of Middle East and Africa ASEAN Automotive OEM Coatings Market Revenue (Million) Forecast, by Application 2019 & 2032
- Table 102: Rest of Middle East and Africa ASEAN Automotive OEM Coatings Market Volume (liter ) Forecast, by Application 2019 & 2032
- Table 103: Global ASEAN Automotive OEM Coatings Market Revenue Million Forecast, by Resin Type 2019 & 2032
- Table 104: Global ASEAN Automotive OEM Coatings Market Volume liter Forecast, by Resin Type 2019 & 2032
- Table 105: Global ASEAN Automotive OEM Coatings Market Revenue Million Forecast, by Technology 2019 & 2032
- Table 106: Global ASEAN Automotive OEM Coatings Market Volume liter Forecast, by Technology 2019 & 2032
- Table 107: Global ASEAN Automotive OEM Coatings Market Revenue Million Forecast, by End-user Industry 2019 & 2032
- Table 108: Global ASEAN Automotive OEM Coatings Market Volume liter Forecast, by End-user Industry 2019 & 2032
- Table 109: Global ASEAN Automotive OEM Coatings Market Revenue Million Forecast, by Geography 2019 & 2032
- Table 110: Global ASEAN Automotive OEM Coatings Market Volume liter Forecast, by Geography 2019 & 2032
- Table 111: Global ASEAN Automotive OEM Coatings Market Revenue Million Forecast, by Country 2019 & 2032
- Table 112: Global ASEAN Automotive OEM Coatings Market Volume liter Forecast, by Country 2019 & 2032
- Table 113: Global ASEAN Automotive OEM Coatings Market Revenue Million Forecast, by Resin Type 2019 & 2032
- Table 114: Global ASEAN Automotive OEM Coatings Market Volume liter Forecast, by Resin Type 2019 & 2032
- Table 115: Global ASEAN Automotive OEM Coatings Market Revenue Million Forecast, by Technology 2019 & 2032
- Table 116: Global ASEAN Automotive OEM Coatings Market Volume liter Forecast, by Technology 2019 & 2032
- Table 117: Global ASEAN Automotive OEM Coatings Market Revenue Million Forecast, by End-user Industry 2019 & 2032
- Table 118: Global ASEAN Automotive OEM Coatings Market Volume liter Forecast, by End-user Industry 2019 & 2032
- Table 119: Global ASEAN Automotive OEM Coatings Market Revenue Million Forecast, by Geography 2019 & 2032
- Table 120: Global ASEAN Automotive OEM Coatings Market Volume liter Forecast, by Geography 2019 & 2032
- Table 121: Global ASEAN Automotive OEM Coatings Market Revenue Million Forecast, by Country 2019 & 2032
- Table 122: Global ASEAN Automotive OEM Coatings Market Volume liter Forecast, by Country 2019 & 2032
- Table 123: Global ASEAN Automotive OEM Coatings Market Revenue Million Forecast, by Resin Type 2019 & 2032
- Table 124: Global ASEAN Automotive OEM Coatings Market Volume liter Forecast, by Resin Type 2019 & 2032
- Table 125: Global ASEAN Automotive OEM Coatings Market Revenue Million Forecast, by Technology 2019 & 2032
- Table 126: Global ASEAN Automotive OEM Coatings Market Volume liter Forecast, by Technology 2019 & 2032
- Table 127: Global ASEAN Automotive OEM Coatings Market Revenue Million Forecast, by End-user Industry 2019 & 2032
- Table 128: Global ASEAN Automotive OEM Coatings Market Volume liter Forecast, by End-user Industry 2019 & 2032
- Table 129: Global ASEAN Automotive OEM Coatings Market Revenue Million Forecast, by Geography 2019 & 2032
- Table 130: Global ASEAN Automotive OEM Coatings Market Volume liter Forecast, by Geography 2019 & 2032
- Table 131: Global ASEAN Automotive OEM Coatings Market Revenue Million Forecast, by Country 2019 & 2032
- Table 132: Global ASEAN Automotive OEM Coatings Market Volume liter Forecast, by Country 2019 & 2032
- Table 133: Global ASEAN Automotive OEM Coatings Market Revenue Million Forecast, by Resin Type 2019 & 2032
- Table 134: Global ASEAN Automotive OEM Coatings Market Volume liter Forecast, by Resin Type 2019 & 2032
- Table 135: Global ASEAN Automotive OEM Coatings Market Revenue Million Forecast, by Technology 2019 & 2032
- Table 136: Global ASEAN Automotive OEM Coatings Market Volume liter Forecast, by Technology 2019 & 2032
- Table 137: Global ASEAN Automotive OEM Coatings Market Revenue Million Forecast, by End-user Industry 2019 & 2032
- Table 138: Global ASEAN Automotive OEM Coatings Market Volume liter Forecast, by End-user Industry 2019 & 2032
- Table 139: Global ASEAN Automotive OEM Coatings Market Revenue Million Forecast, by Geography 2019 & 2032
- Table 140: Global ASEAN Automotive OEM Coatings Market Volume liter Forecast, by Geography 2019 & 2032
- Table 141: Global ASEAN Automotive OEM Coatings Market Revenue Million Forecast, by Country 2019 & 2032
- Table 142: Global ASEAN Automotive OEM Coatings Market Volume liter Forecast, by Country 2019 & 2032
- Table 143: Global ASEAN Automotive OEM Coatings Market Revenue Million Forecast, by Resin Type 2019 & 2032
- Table 144: Global ASEAN Automotive OEM Coatings Market Volume liter Forecast, by Resin Type 2019 & 2032
- Table 145: Global ASEAN Automotive OEM Coatings Market Revenue Million Forecast, by Technology 2019 & 2032
- Table 146: Global ASEAN Automotive OEM Coatings Market Volume liter Forecast, by Technology 2019 & 2032
- Table 147: Global ASEAN Automotive OEM Coatings Market Revenue Million Forecast, by End-user Industry 2019 & 2032
- Table 148: Global ASEAN Automotive OEM Coatings Market Volume liter Forecast, by End-user Industry 2019 & 2032
- Table 149: Global ASEAN Automotive OEM Coatings Market Revenue Million Forecast, by Geography 2019 & 2032
- Table 150: Global ASEAN Automotive OEM Coatings Market Volume liter Forecast, by Geography 2019 & 2032
- Table 151: Global ASEAN Automotive OEM Coatings Market Revenue Million Forecast, by Country 2019 & 2032
- Table 152: Global ASEAN Automotive OEM Coatings Market Volume liter Forecast, by Country 2019 & 2032
- Table 153: Global ASEAN Automotive OEM Coatings Market Revenue Million Forecast, by Resin Type 2019 & 2032
- Table 154: Global ASEAN Automotive OEM Coatings Market Volume liter Forecast, by Resin Type 2019 & 2032
- Table 155: Global ASEAN Automotive OEM Coatings Market Revenue Million Forecast, by Technology 2019 & 2032
- Table 156: Global ASEAN Automotive OEM Coatings Market Volume liter Forecast, by Technology 2019 & 2032
- Table 157: Global ASEAN Automotive OEM Coatings Market Revenue Million Forecast, by End-user Industry 2019 & 2032
- Table 158: Global ASEAN Automotive OEM Coatings Market Volume liter Forecast, by End-user Industry 2019 & 2032
- Table 159: Global ASEAN Automotive OEM Coatings Market Revenue Million Forecast, by Geography 2019 & 2032
- Table 160: Global ASEAN Automotive OEM Coatings Market Volume liter Forecast, by Geography 2019 & 2032
- Table 161: Global ASEAN Automotive OEM Coatings Market Revenue Million Forecast, by Country 2019 & 2032
- Table 162: Global ASEAN Automotive OEM Coatings Market Volume liter Forecast, by Country 2019 & 2032
Frequently Asked Questions
1. What is the projected Compound Annual Growth Rate (CAGR) of the ASEAN Automotive OEM Coatings Market?
The projected CAGR is approximately > 8.61%.
2. Which companies are prominent players in the ASEAN Automotive OEM Coatings Market?
Key companies in the market include The Sherwin-Williams Company*List Not Exhaustive, AkzoNobel N V, Jotun, RPM International Inc, PPG Industries Inc, Beckers Group, Nippon Paint Holdings Co Ltd, BASF SE, Teknos Group, Axalta Coating Systems LLC.
3. What are the main segments of the ASEAN Automotive OEM Coatings Market?
The market segments include Resin Type, Technology, End-user Industry, Geography.
4. Can you provide details about the market size?
The market size is estimated to be USD 620 Million as of 2022.
5. What are some drivers contributing to market growth?
Rising Demand for Passenger Cars.; Other Drivers.
6. What are the notable trends driving market growth?
Indonesia to Dominate the Market.
7. Are there any restraints impacting market growth?
Ongoing Shortage of Semiconductors; Other Restraints.
8. Can you provide examples of recent developments in the market?
N/A
9. What pricing options are available for accessing the report?
Pricing options include single-user, multi-user, and enterprise licenses priced at USD 4750, USD 5250, and USD 8750 respectively.
10. Is the market size provided in terms of value or volume?
The market size is provided in terms of value, measured in Million and volume, measured in liter .
11. Are there any specific market keywords associated with the report?
Yes, the market keyword associated with the report is "ASEAN Automotive OEM Coatings Market," which aids in identifying and referencing the specific market segment covered.
12. How do I determine which pricing option suits my needs best?
The pricing options vary based on user requirements and access needs. Individual users may opt for single-user licenses, while businesses requiring broader access may choose multi-user or enterprise licenses for cost-effective access to the report.
13. Are there any additional resources or data provided in the ASEAN Automotive OEM Coatings Market report?
While the report offers comprehensive insights, it's advisable to review the specific contents or supplementary materials provided to ascertain if additional resources or data are available.
14. How can I stay updated on further developments or reports in the ASEAN Automotive OEM Coatings Market?
To stay informed about further developments, trends, and reports in the ASEAN Automotive OEM Coatings Market, consider subscribing to industry newsletters, following relevant companies and organizations, or regularly checking reputable industry news sources and publications.
Methodology
Step 1 - Identification of Relevant Samples Size from Population Database


Step 2 - Approaches for Defining Global Market Size (Value, Volume* & Price*)

Note*: In applicable scenarios
Step 3 - Data Sources
Primary Research
- Web Analytics
- Survey Reports
- Research Institute
- Latest Research Reports
- Opinion Leaders
Secondary Research
- Annual Reports
- White Paper
- Latest Press Release
- Industry Association
- Paid Database
- Investor Presentations

Step 4 - Data Triangulation
Involves using different sources of information in order to increase the validity of a study
These sources are likely to be stakeholders in a program - participants, other researchers, program staff, other community members, and so on.
Then we put all data in single framework & apply various statistical tools to find out the dynamic on the market.
During the analysis stage, feedback from the stakeholder groups would be compared to determine areas of agreement as well as areas of divergence


