
Key Insights
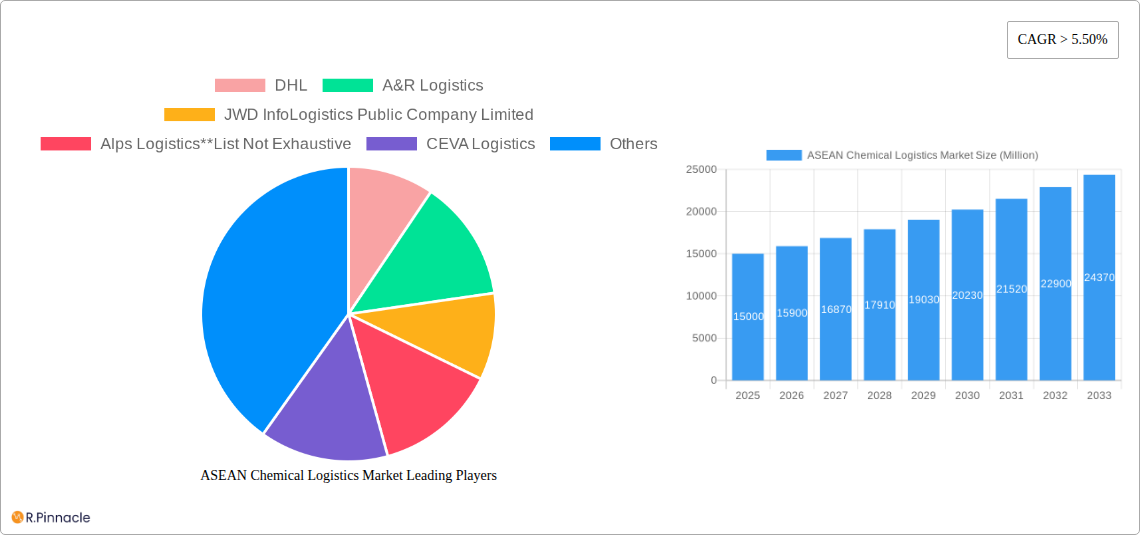
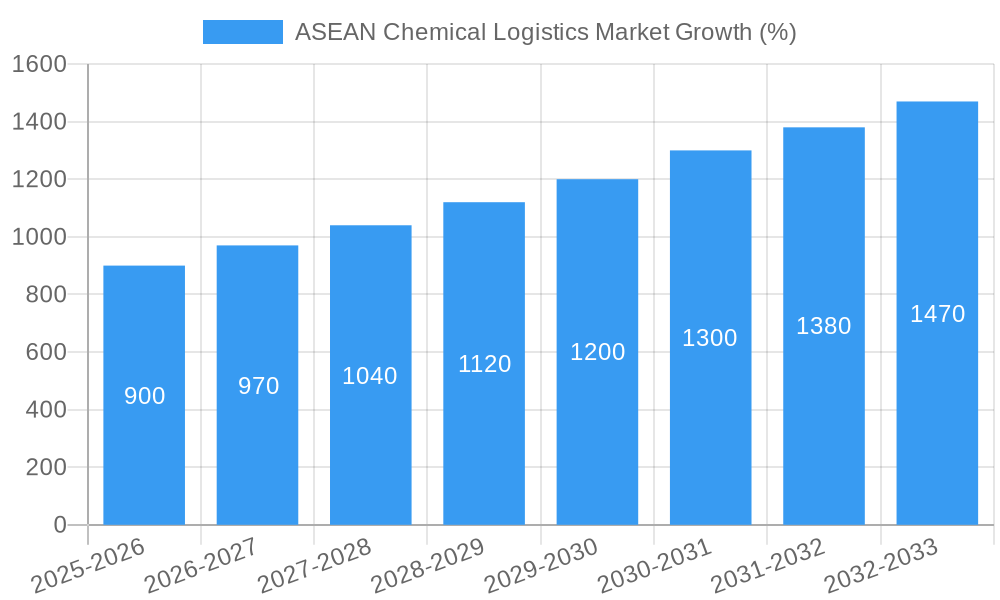
The ASEAN chemical logistics market is experiencing robust growth, driven by the region's expanding chemical industry, increasing cross-border trade, and the rising demand for efficient supply chain solutions. The market's compound annual growth rate (CAGR) exceeding 5.50% signifies a significant upward trajectory projected through 2033. Key growth drivers include the booming pharmaceutical and specialty chemical sectors within ASEAN, necessitating reliable and specialized transportation, warehousing, and distribution networks. Furthermore, the increasing adoption of green logistics practices and advanced technologies like automation and data analytics are streamlining operations and boosting efficiency within the supply chain. While regulatory hurdles and infrastructure limitations in certain ASEAN nations might pose some challenges, the overall market outlook remains positive. The market is segmented by service type (transportation, warehousing, etc.), mode of transportation (road, rail, air, etc.), and end-user industry (pharmaceuticals, oil & gas, etc.). Major players like DHL, A&R Logistics, and JWD InfoLogistics are leveraging their expertise and expanding their footprints to capitalize on this growth. The market's diverse segments present opportunities for both large multinational logistics providers and specialized regional players. Growth is expected to be particularly strong in rapidly developing economies within ASEAN, such as Vietnam and Indonesia, due to their expanding manufacturing sectors and increasing foreign investment.
The substantial market size (estimated at a value in millions – a precise figure requires additional data) underscores the significant economic activity within ASEAN's chemical logistics sector. This market is characterized by a diverse range of services, catering to the unique needs of various chemical industries. Roadways are expected to maintain a dominant share of the transportation mode segment due to the extensive road networks within ASEAN. However, the increasing demand for faster and more efficient transportation solutions will likely stimulate growth in the air and rail segments. Furthermore, the growing emphasis on sustainability will push the adoption of green logistics solutions, such as optimized routing and eco-friendly transportation modes, leading to a notable expansion of this specific market segment in the coming years. Competitive pressures will likely persist, with companies continuously investing in technological advancements and expanding their service offerings to retain and attract customers.
ASEAN Chemical Logistics Market: A Comprehensive Report (2019-2033)
This in-depth report provides a comprehensive analysis of the ASEAN Chemical Logistics Market, offering actionable insights for industry professionals. Covering the period from 2019 to 2033, with a focus on 2025, this report meticulously examines market dynamics, key players, and future growth prospects. The market is projected to reach xx Million by 2033, exhibiting a significant CAGR. This report is invaluable for businesses seeking to understand the complexities of this dynamic sector and capitalize on emerging opportunities.
ASEAN Chemical Logistics Market Structure & Innovation Trends
This section analyzes the ASEAN chemical logistics market's competitive landscape, examining market concentration, innovation drivers, regulatory frameworks, and key industry trends. We explore the impact of mergers and acquisitions (M&A) on market consolidation and innovation.
Market Concentration: The ASEAN chemical logistics market exhibits a moderately concentrated structure with several large multinational players and regional operators competing. Market share data reveals that DHL and other major players hold a substantial portion of the market (xx%), while smaller regional players control a significant share (xx%).
Innovation Drivers: Several factors drive innovation, including:
- Increasing demand for specialized logistics solutions for hazardous chemicals.
- Advancements in technology, such as IoT and AI, in warehouse management and transportation optimization.
- Growing focus on sustainability and green logistics solutions.
- Stringent regulatory compliance requirements.
Regulatory Frameworks: The ASEAN region's diverse regulatory landscape presents both opportunities and challenges. Harmonization of regulations and increased transparency could stimulate market growth.
Product Substitutes: While direct substitutes are limited due to the specialized nature of chemical logistics, technological advancements continually lead to improved efficiency and alternative solutions.
End-User Demographics: The chemical logistics market caters primarily to the pharmaceutical, specialty chemical, oil & gas, and cosmetic industries. The growth of these sectors directly influences market demand.
M&A Activities: The past few years have witnessed significant M&A activity, with deal values reaching xx Million in aggregate. Consolidation is driven by the need to expand regional reach, enhance service offerings, and improve operational efficiency. Examples include recent joint ventures and acquisitions aiming to expand warehousing capabilities and improve hazardous chemical handling.
ASEAN Chemical Logistics Market Dynamics & Trends
This section analyzes the growth drivers, technological advancements, and competitive dynamics shaping the ASEAN chemical logistics market. The market's growth is projected to be driven by several factors, including:
- The expanding manufacturing sector in the ASEAN region
- The increase in cross-border trade and e-commerce
- The growing demand for specialized chemical logistics services
Technological disruptions, including automation, big data analytics, and the Internet of Things (IoT), are transforming logistics operations, enhancing efficiency, transparency, and safety. Changing consumer preferences towards faster and more reliable delivery are also influencing the market. The competitive landscape is characterized by intense rivalry among multinational and regional players, leading to price competition and service innovation. The market penetration rate for advanced logistics technologies is expected to increase from xx% in 2025 to xx% by 2033.
Dominant Regions & Segments in ASEAN Chemical Logistics Market
This section identifies leading regions, countries, and segments within the ASEAN chemical logistics market, providing an in-depth analysis of their dominance.
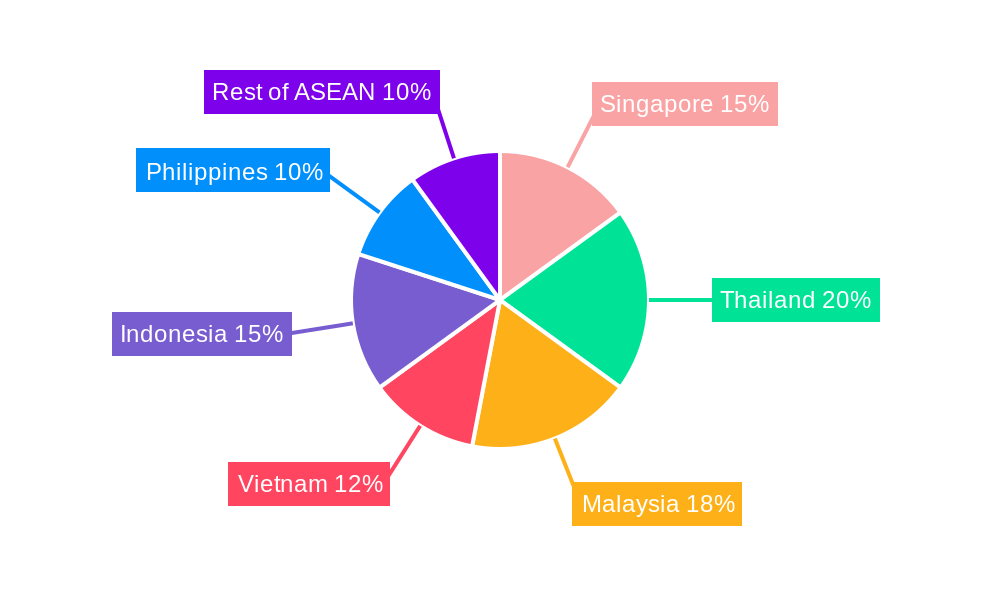
By Region: [Analysis of leading countries within ASEAN, detailing reasons for dominance. Quantifiable metrics needed here. e.g., Singapore due to its advanced infrastructure and strategic location, contributing to xx% of the market].
By Service:
- Transportation: Roadways dominate, followed by waterways for bulk chemicals. Growth drivers include infrastructure improvements and increasing trade volumes.
- Warehousing: Significant growth driven by demand for specialized warehousing solutions for hazardous chemicals. Key drivers are investments in modern warehousing facilities and increasing outsourcing of logistics.
- Distribution and Inventory Management: Adoption of advanced inventory management systems is boosting efficiency and reducing costs.
- Consulting & Management Services: Demand is increasing for expert guidance on optimizing logistics operations.
- Customs & Security: Stricter regulations are driving demand for specialized services to manage customs procedures and ensure secure handling.
- Green Logistics: Growing awareness of environmental concerns fuels demand for sustainable solutions.
- Others: This category encompasses ancillary services crucial to chemical logistics.
By Mode of Transportation: [Detailed analysis of each mode (Roadways, Railways, Airways, Waterways, Pipelines), explaining their market share and key growth drivers].
By End User: [Detailed analysis of the Pharmaceutical, Specialty Chemical, Oil & Gas, and Cosmetic industries, detailing their contribution to the market. Include insights on their individual growth rates and logistics needs.]
ASEAN Chemical Logistics Market Product Innovations
The ASEAN chemical logistics market is experiencing significant product innovation, driven by advancements in technology and evolving customer needs. New software solutions for route optimization and inventory management are improving efficiency and reducing costs. Technological innovations are also improving the safety and security of handling hazardous chemicals. The development of specialized containers and vehicles for specific chemical types is enhancing transportation safety and efficiency. Warehouse automation, such as automated guided vehicles (AGVs) and robotic systems, is gaining traction, increasing productivity and minimizing human error.
Report Scope & Segmentation Analysis
This report provides a comprehensive analysis of the ASEAN chemical logistics market, segmented by service type, mode of transportation, and end-user industry.
By Service: The report analyzes market size, growth projections, and competitive dynamics for each service category, including transportation, warehousing, distribution, inventory management, consulting, customs and security, green logistics, and other services.
By Mode of Transportation: The report analyzes market size, growth projections, and competitive dynamics for each transportation mode, including roadways, railways, airways, waterways, and pipelines.
By End User: The report analyzes market size, growth projections, and competitive dynamics for each end-user industry, including the pharmaceutical, specialty chemical, oil and gas, cosmetic, and other industries. Each segment's analysis includes growth forecasts and a review of the competitive intensity within it.
Key Drivers of ASEAN Chemical Logistics Market Growth
Several factors fuel the growth of the ASEAN chemical logistics market. These include:
- Expanding Manufacturing: The region's burgeoning manufacturing sector necessitates robust chemical logistics networks.
- Rising E-commerce: The growth of e-commerce is driving demand for faster and more efficient delivery of chemical products.
- Infrastructure Development: Government investments in infrastructure, such as improved roads and ports, enhance logistics efficiency.
- Technological Advancements: Innovations in logistics technology boost productivity and reduce costs.
Challenges in the ASEAN Chemical Logistics Market Sector
Despite promising growth, the ASEAN chemical logistics market faces challenges:
- Regulatory Complexity: Inconsistencies in regulations across the region create operational hurdles.
- Infrastructure Gaps: Inadequate infrastructure in some areas hampers efficient transportation and delivery.
- Supply Chain Disruptions: Global events can disrupt supply chains and affect chemical logistics operations. The impact of these disruptions can range from delays in delivery to increased costs.
Emerging Opportunities in ASEAN Chemical Logistics Market
The ASEAN chemical logistics market presents numerous opportunities:
- Growth of Speciality Chemicals: Demand for specialized chemical handling is increasing, creating niche market opportunities.
- Adoption of Sustainable Practices: Demand for eco-friendly logistics solutions offers potential for growth.
- Technological Advancements: Opportunities exist in leveraging new technologies to improve efficiency, safety, and transparency.
Leading Players in the ASEAN Chemical Logistics Market Market
- DHL
- A&R Logistics
- JWD InfoLogistics Public Company Limited
- Alps Logistics
- CEVA Logistics
- Agility Logistics
- CT Logistics
- Tiong Nam Logistics Holdings BhD
- Eagles Air & Sea
- BDP International
- Rinchem
- Rhenus Logistics
Key Developments in ASEAN Chemical Logistics Market Industry
- October 2022: Rinchem's new Malaysian warehouse (45,000 sq ft, 3100 pallet positions) significantly expands its capacity in the region.
- February 2022: Leschaco opens a new chemical and dangerous goods warehouse in Port Klang, Malaysia (120,000 sq ft, 13,000 pallet positions), highlighting the growing demand for contract logistics.
- October 2021: FLS Supply Chain Centers joint venture launches a state-of-the-art hazardous chemical warehouse in Thailand (10,000 sq meters), showcasing investment in specialized facilities.
Future Outlook for ASEAN Chemical Logistics Market Market
The ASEAN chemical logistics market is poised for robust growth, driven by sustained economic expansion, increasing industrialization, and technological advancements. The focus on sustainability and improving supply chain resilience will further shape the market's future. Strategic partnerships, investments in infrastructure, and adoption of innovative technologies are key to achieving future success in this dynamic sector.
ASEAN Chemical Logistics Market Segmentation
-
1. Service
- 1.1. Transportation
- 1.2. Warehous
- 1.3. Consulting & Management Services
- 1.4. Customs & Security
- 1.5. Green Logistics
- 1.6. Others
-
2. Mode of Transportation
- 2.1. Roadways
- 2.2. Railways
- 2.3. Airways
- 2.4. Waterways
- 2.5. Pipelines
-
3. End User
- 3.1. Pharmaceutical Industry
- 3.2. Specialty Chemical Industry
- 3.3. Oil and Gas Industry
- 3.4. Cosmetic Industry
- 3.5. Others
-
4. Geography
- 4.1. Singapore
- 4.2. Thailand
- 4.3. Malaysia
- 4.4. Vietnam
- 4.5. Indonesia
- 4.6. Philippines
- 4.7. Rest of ASEAN
ASEAN Chemical Logistics Market Segmentation By Geography
- 1. Singapore
- 2. Thailand
- 3. Malaysia
- 4. Vietnam
- 5. Indonesia
- 6. Philippines
- 7. Rest of ASEAN
ASEAN Chemical Logistics Market REPORT HIGHLIGHTS
| Aspects | Details |
|---|---|
| Study Period | 2019-2033 |
| Base Year | 2024 |
| Estimated Year | 2025 |
| Forecast Period | 2025-2033 |
| Historical Period | 2019-2024 |
| Growth Rate | CAGR of > 5.50% from 2019-2033 |
| Segmentation |
|
Table of Contents
- 1. Introduction
- 1.1. Research Scope
- 1.2. Market Segmentation
- 1.3. Research Methodology
- 1.4. Definitions and Assumptions
- 2. Executive Summary
- 2.1. Introduction
- 3. Market Dynamics
- 3.1. Introduction
- 3.2. Market Drivers
- 3.2.1. The Rise in Demand for Specialty Chemicals in ASEAN Countries Increasing Trade Logistics Activity; Partnerships and Collaborations Between Major Players in the Chemical Logistics Market are Being Formed for the Creation of Innovative Goods and Technologically Enhanced Services
- 3.3. Market Restrains
- 3.3.1. Complexities Related to Chemical Logistics; High Cost Involved in the Transportation of Chemicals
- 3.4. Market Trends
- 3.4.1. The Rise in Chemical Production is Expected to Propel the Growth of the Chemical Logistics Market
- 4. Market Factor Analysis
- 4.1. Porters Five Forces
- 4.2. Supply/Value Chain
- 4.3. PESTEL analysis
- 4.4. Market Entropy
- 4.5. Patent/Trademark Analysis
- 5. Global ASEAN Chemical Logistics Market Analysis, Insights and Forecast, 2019-2031
- 5.1. Market Analysis, Insights and Forecast - by Service
- 5.1.1. Transportation
- 5.1.2. Warehous
- 5.1.3. Consulting & Management Services
- 5.1.4. Customs & Security
- 5.1.5. Green Logistics
- 5.1.6. Others
- 5.2. Market Analysis, Insights and Forecast - by Mode of Transportation
- 5.2.1. Roadways
- 5.2.2. Railways
- 5.2.3. Airways
- 5.2.4. Waterways
- 5.2.5. Pipelines
- 5.3. Market Analysis, Insights and Forecast - by End User
- 5.3.1. Pharmaceutical Industry
- 5.3.2. Specialty Chemical Industry
- 5.3.3. Oil and Gas Industry
- 5.3.4. Cosmetic Industry
- 5.3.5. Others
- 5.4. Market Analysis, Insights and Forecast - by Geography
- 5.4.1. Singapore
- 5.4.2. Thailand
- 5.4.3. Malaysia
- 5.4.4. Vietnam
- 5.4.5. Indonesia
- 5.4.6. Philippines
- 5.4.7. Rest of ASEAN
- 5.5. Market Analysis, Insights and Forecast - by Region
- 5.5.1. Singapore
- 5.5.2. Thailand
- 5.5.3. Malaysia
- 5.5.4. Vietnam
- 5.5.5. Indonesia
- 5.5.6. Philippines
- 5.5.7. Rest of ASEAN
- 5.1. Market Analysis, Insights and Forecast - by Service
- 6. Singapore ASEAN Chemical Logistics Market Analysis, Insights and Forecast, 2019-2031
- 6.1. Market Analysis, Insights and Forecast - by Service
- 6.1.1. Transportation
- 6.1.2. Warehous
- 6.1.3. Consulting & Management Services
- 6.1.4. Customs & Security
- 6.1.5. Green Logistics
- 6.1.6. Others
- 6.2. Market Analysis, Insights and Forecast - by Mode of Transportation
- 6.2.1. Roadways
- 6.2.2. Railways
- 6.2.3. Airways
- 6.2.4. Waterways
- 6.2.5. Pipelines
- 6.3. Market Analysis, Insights and Forecast - by End User
- 6.3.1. Pharmaceutical Industry
- 6.3.2. Specialty Chemical Industry
- 6.3.3. Oil and Gas Industry
- 6.3.4. Cosmetic Industry
- 6.3.5. Others
- 6.4. Market Analysis, Insights and Forecast - by Geography
- 6.4.1. Singapore
- 6.4.2. Thailand
- 6.4.3. Malaysia
- 6.4.4. Vietnam
- 6.4.5. Indonesia
- 6.4.6. Philippines
- 6.4.7. Rest of ASEAN
- 6.1. Market Analysis, Insights and Forecast - by Service
- 7. Thailand ASEAN Chemical Logistics Market Analysis, Insights and Forecast, 2019-2031
- 7.1. Market Analysis, Insights and Forecast - by Service
- 7.1.1. Transportation
- 7.1.2. Warehous
- 7.1.3. Consulting & Management Services
- 7.1.4. Customs & Security
- 7.1.5. Green Logistics
- 7.1.6. Others
- 7.2. Market Analysis, Insights and Forecast - by Mode of Transportation
- 7.2.1. Roadways
- 7.2.2. Railways
- 7.2.3. Airways
- 7.2.4. Waterways
- 7.2.5. Pipelines
- 7.3. Market Analysis, Insights and Forecast - by End User
- 7.3.1. Pharmaceutical Industry
- 7.3.2. Specialty Chemical Industry
- 7.3.3. Oil and Gas Industry
- 7.3.4. Cosmetic Industry
- 7.3.5. Others
- 7.4. Market Analysis, Insights and Forecast - by Geography
- 7.4.1. Singapore
- 7.4.2. Thailand
- 7.4.3. Malaysia
- 7.4.4. Vietnam
- 7.4.5. Indonesia
- 7.4.6. Philippines
- 7.4.7. Rest of ASEAN
- 7.1. Market Analysis, Insights and Forecast - by Service
- 8. Malaysia ASEAN Chemical Logistics Market Analysis, Insights and Forecast, 2019-2031
- 8.1. Market Analysis, Insights and Forecast - by Service
- 8.1.1. Transportation
- 8.1.2. Warehous
- 8.1.3. Consulting & Management Services
- 8.1.4. Customs & Security
- 8.1.5. Green Logistics
- 8.1.6. Others
- 8.2. Market Analysis, Insights and Forecast - by Mode of Transportation
- 8.2.1. Roadways
- 8.2.2. Railways
- 8.2.3. Airways
- 8.2.4. Waterways
- 8.2.5. Pipelines
- 8.3. Market Analysis, Insights and Forecast - by End User
- 8.3.1. Pharmaceutical Industry
- 8.3.2. Specialty Chemical Industry
- 8.3.3. Oil and Gas Industry
- 8.3.4. Cosmetic Industry
- 8.3.5. Others
- 8.4. Market Analysis, Insights and Forecast - by Geography
- 8.4.1. Singapore
- 8.4.2. Thailand
- 8.4.3. Malaysia
- 8.4.4. Vietnam
- 8.4.5. Indonesia
- 8.4.6. Philippines
- 8.4.7. Rest of ASEAN
- 8.1. Market Analysis, Insights and Forecast - by Service
- 9. Vietnam ASEAN Chemical Logistics Market Analysis, Insights and Forecast, 2019-2031
- 9.1. Market Analysis, Insights and Forecast - by Service
- 9.1.1. Transportation
- 9.1.2. Warehous
- 9.1.3. Consulting & Management Services
- 9.1.4. Customs & Security
- 9.1.5. Green Logistics
- 9.1.6. Others
- 9.2. Market Analysis, Insights and Forecast - by Mode of Transportation
- 9.2.1. Roadways
- 9.2.2. Railways
- 9.2.3. Airways
- 9.2.4. Waterways
- 9.2.5. Pipelines
- 9.3. Market Analysis, Insights and Forecast - by End User
- 9.3.1. Pharmaceutical Industry
- 9.3.2. Specialty Chemical Industry
- 9.3.3. Oil and Gas Industry
- 9.3.4. Cosmetic Industry
- 9.3.5. Others
- 9.4. Market Analysis, Insights and Forecast - by Geography
- 9.4.1. Singapore
- 9.4.2. Thailand
- 9.4.3. Malaysia
- 9.4.4. Vietnam
- 9.4.5. Indonesia
- 9.4.6. Philippines
- 9.4.7. Rest of ASEAN
- 9.1. Market Analysis, Insights and Forecast - by Service
- 10. Indonesia ASEAN Chemical Logistics Market Analysis, Insights and Forecast, 2019-2031
- 10.1. Market Analysis, Insights and Forecast - by Service
- 10.1.1. Transportation
- 10.1.2. Warehous
- 10.1.3. Consulting & Management Services
- 10.1.4. Customs & Security
- 10.1.5. Green Logistics
- 10.1.6. Others
- 10.2. Market Analysis, Insights and Forecast - by Mode of Transportation
- 10.2.1. Roadways
- 10.2.2. Railways
- 10.2.3. Airways
- 10.2.4. Waterways
- 10.2.5. Pipelines
- 10.3. Market Analysis, Insights and Forecast - by End User
- 10.3.1. Pharmaceutical Industry
- 10.3.2. Specialty Chemical Industry
- 10.3.3. Oil and Gas Industry
- 10.3.4. Cosmetic Industry
- 10.3.5. Others
- 10.4. Market Analysis, Insights and Forecast - by Geography
- 10.4.1. Singapore
- 10.4.2. Thailand
- 10.4.3. Malaysia
- 10.4.4. Vietnam
- 10.4.5. Indonesia
- 10.4.6. Philippines
- 10.4.7. Rest of ASEAN
- 10.1. Market Analysis, Insights and Forecast - by Service
- 11. Philippines ASEAN Chemical Logistics Market Analysis, Insights and Forecast, 2019-2031
- 11.1. Market Analysis, Insights and Forecast - by Service
- 11.1.1. Transportation
- 11.1.2. Warehous
- 11.1.3. Consulting & Management Services
- 11.1.4. Customs & Security
- 11.1.5. Green Logistics
- 11.1.6. Others
- 11.2. Market Analysis, Insights and Forecast - by Mode of Transportation
- 11.2.1. Roadways
- 11.2.2. Railways
- 11.2.3. Airways
- 11.2.4. Waterways
- 11.2.5. Pipelines
- 11.3. Market Analysis, Insights and Forecast - by End User
- 11.3.1. Pharmaceutical Industry
- 11.3.2. Specialty Chemical Industry
- 11.3.3. Oil and Gas Industry
- 11.3.4. Cosmetic Industry
- 11.3.5. Others
- 11.4. Market Analysis, Insights and Forecast - by Geography
- 11.4.1. Singapore
- 11.4.2. Thailand
- 11.4.3. Malaysia
- 11.4.4. Vietnam
- 11.4.5. Indonesia
- 11.4.6. Philippines
- 11.4.7. Rest of ASEAN
- 11.1. Market Analysis, Insights and Forecast - by Service
- 12. Rest of ASEAN ASEAN Chemical Logistics Market Analysis, Insights and Forecast, 2019-2031
- 12.1. Market Analysis, Insights and Forecast - by Service
- 12.1.1. Transportation
- 12.1.2. Warehous
- 12.1.3. Consulting & Management Services
- 12.1.4. Customs & Security
- 12.1.5. Green Logistics
- 12.1.6. Others
- 12.2. Market Analysis, Insights and Forecast - by Mode of Transportation
- 12.2.1. Roadways
- 12.2.2. Railways
- 12.2.3. Airways
- 12.2.4. Waterways
- 12.2.5. Pipelines
- 12.3. Market Analysis, Insights and Forecast - by End User
- 12.3.1. Pharmaceutical Industry
- 12.3.2. Specialty Chemical Industry
- 12.3.3. Oil and Gas Industry
- 12.3.4. Cosmetic Industry
- 12.3.5. Others
- 12.4. Market Analysis, Insights and Forecast - by Geography
- 12.4.1. Singapore
- 12.4.2. Thailand
- 12.4.3. Malaysia
- 12.4.4. Vietnam
- 12.4.5. Indonesia
- 12.4.6. Philippines
- 12.4.7. Rest of ASEAN
- 12.1. Market Analysis, Insights and Forecast - by Service
- 13. Singapore ASEAN Chemical Logistics Market Analysis, Insights and Forecast, 2019-2031
- 13.1. Market Analysis, Insights and Forecast - By Country/Sub-region
- 13.1.1.
- 14. Thailand ASEAN Chemical Logistics Market Analysis, Insights and Forecast, 2019-2031
- 14.1. Market Analysis, Insights and Forecast - By Country/Sub-region
- 14.1.1.
- 15. Malaysia ASEAN Chemical Logistics Market Analysis, Insights and Forecast, 2019-2031
- 15.1. Market Analysis, Insights and Forecast - By Country/Sub-region
- 15.1.1.
- 16. Vietnam ASEAN Chemical Logistics Market Analysis, Insights and Forecast, 2019-2031
- 16.1. Market Analysis, Insights and Forecast - By Country/Sub-region
- 16.1.1.
- 17. Indonesia ASEAN Chemical Logistics Market Analysis, Insights and Forecast, 2019-2031
- 17.1. Market Analysis, Insights and Forecast - By Country/Sub-region
- 17.1.1.
- 18. Philippines ASEAN Chemical Logistics Market Analysis, Insights and Forecast, 2019-2031
- 18.1. Market Analysis, Insights and Forecast - By Country/Sub-region
- 18.1.1.
- 19. Rest of ASEAN ASEAN Chemical Logistics Market Analysis, Insights and Forecast, 2019-2031
- 19.1. Market Analysis, Insights and Forecast - By Country/Sub-region
- 19.1.1.
- 20. Competitive Analysis
- 20.1. Global Market Share Analysis 2024
- 20.2. Company Profiles
- 20.2.1 DHL
- 20.2.1.1. Overview
- 20.2.1.2. Products
- 20.2.1.3. SWOT Analysis
- 20.2.1.4. Recent Developments
- 20.2.1.5. Financials (Based on Availability)
- 20.2.2 A&R Logistics
- 20.2.2.1. Overview
- 20.2.2.2. Products
- 20.2.2.3. SWOT Analysis
- 20.2.2.4. Recent Developments
- 20.2.2.5. Financials (Based on Availability)
- 20.2.3 JWD InfoLogistics Public Company Limited
- 20.2.3.1. Overview
- 20.2.3.2. Products
- 20.2.3.3. SWOT Analysis
- 20.2.3.4. Recent Developments
- 20.2.3.5. Financials (Based on Availability)
- 20.2.4 Alps Logistics**List Not Exhaustive
- 20.2.4.1. Overview
- 20.2.4.2. Products
- 20.2.4.3. SWOT Analysis
- 20.2.4.4. Recent Developments
- 20.2.4.5. Financials (Based on Availability)
- 20.2.5 CEVA Logistics
- 20.2.5.1. Overview
- 20.2.5.2. Products
- 20.2.5.3. SWOT Analysis
- 20.2.5.4. Recent Developments
- 20.2.5.5. Financials (Based on Availability)
- 20.2.6 Agility Logistics
- 20.2.6.1. Overview
- 20.2.6.2. Products
- 20.2.6.3. SWOT Analysis
- 20.2.6.4. Recent Developments
- 20.2.6.5. Financials (Based on Availability)
- 20.2.7 CT Logistics
- 20.2.7.1. Overview
- 20.2.7.2. Products
- 20.2.7.3. SWOT Analysis
- 20.2.7.4. Recent Developments
- 20.2.7.5. Financials (Based on Availability)
- 20.2.8 Tiong Nam Logistics Holdings BhD
- 20.2.8.1. Overview
- 20.2.8.2. Products
- 20.2.8.3. SWOT Analysis
- 20.2.8.4. Recent Developments
- 20.2.8.5. Financials (Based on Availability)
- 20.2.9 Eagles Air & Sea
- 20.2.9.1. Overview
- 20.2.9.2. Products
- 20.2.9.3. SWOT Analysis
- 20.2.9.4. Recent Developments
- 20.2.9.5. Financials (Based on Availability)
- 20.2.10 BDP International
- 20.2.10.1. Overview
- 20.2.10.2. Products
- 20.2.10.3. SWOT Analysis
- 20.2.10.4. Recent Developments
- 20.2.10.5. Financials (Based on Availability)
- 20.2.11 Rinchem
- 20.2.11.1. Overview
- 20.2.11.2. Products
- 20.2.11.3. SWOT Analysis
- 20.2.11.4. Recent Developments
- 20.2.11.5. Financials (Based on Availability)
- 20.2.12 Rhenus Logistics
- 20.2.12.1. Overview
- 20.2.12.2. Products
- 20.2.12.3. SWOT Analysis
- 20.2.12.4. Recent Developments
- 20.2.12.5. Financials (Based on Availability)
- 20.2.1 DHL
List of Figures
- Figure 1: Global ASEAN Chemical Logistics Market Revenue Breakdown (Million, %) by Region 2024 & 2032
- Figure 2: Singapore ASEAN Chemical Logistics Market Revenue (Million), by Country 2024 & 2032
- Figure 3: Singapore ASEAN Chemical Logistics Market Revenue Share (%), by Country 2024 & 2032
- Figure 4: Thailand ASEAN Chemical Logistics Market Revenue (Million), by Country 2024 & 2032
- Figure 5: Thailand ASEAN Chemical Logistics Market Revenue Share (%), by Country 2024 & 2032
- Figure 6: Malaysia ASEAN Chemical Logistics Market Revenue (Million), by Country 2024 & 2032
- Figure 7: Malaysia ASEAN Chemical Logistics Market Revenue Share (%), by Country 2024 & 2032
- Figure 8: Vietnam ASEAN Chemical Logistics Market Revenue (Million), by Country 2024 & 2032
- Figure 9: Vietnam ASEAN Chemical Logistics Market Revenue Share (%), by Country 2024 & 2032
- Figure 10: Indonesia ASEAN Chemical Logistics Market Revenue (Million), by Country 2024 & 2032
- Figure 11: Indonesia ASEAN Chemical Logistics Market Revenue Share (%), by Country 2024 & 2032
- Figure 12: Philippines ASEAN Chemical Logistics Market Revenue (Million), by Country 2024 & 2032
- Figure 13: Philippines ASEAN Chemical Logistics Market Revenue Share (%), by Country 2024 & 2032
- Figure 14: Rest of ASEAN ASEAN Chemical Logistics Market Revenue (Million), by Country 2024 & 2032
- Figure 15: Rest of ASEAN ASEAN Chemical Logistics Market Revenue Share (%), by Country 2024 & 2032
- Figure 16: Singapore ASEAN Chemical Logistics Market Revenue (Million), by Service 2024 & 2032
- Figure 17: Singapore ASEAN Chemical Logistics Market Revenue Share (%), by Service 2024 & 2032
- Figure 18: Singapore ASEAN Chemical Logistics Market Revenue (Million), by Mode of Transportation 2024 & 2032
- Figure 19: Singapore ASEAN Chemical Logistics Market Revenue Share (%), by Mode of Transportation 2024 & 2032
- Figure 20: Singapore ASEAN Chemical Logistics Market Revenue (Million), by End User 2024 & 2032
- Figure 21: Singapore ASEAN Chemical Logistics Market Revenue Share (%), by End User 2024 & 2032
- Figure 22: Singapore ASEAN Chemical Logistics Market Revenue (Million), by Geography 2024 & 2032
- Figure 23: Singapore ASEAN Chemical Logistics Market Revenue Share (%), by Geography 2024 & 2032
- Figure 24: Singapore ASEAN Chemical Logistics Market Revenue (Million), by Country 2024 & 2032
- Figure 25: Singapore ASEAN Chemical Logistics Market Revenue Share (%), by Country 2024 & 2032
- Figure 26: Thailand ASEAN Chemical Logistics Market Revenue (Million), by Service 2024 & 2032
- Figure 27: Thailand ASEAN Chemical Logistics Market Revenue Share (%), by Service 2024 & 2032
- Figure 28: Thailand ASEAN Chemical Logistics Market Revenue (Million), by Mode of Transportation 2024 & 2032
- Figure 29: Thailand ASEAN Chemical Logistics Market Revenue Share (%), by Mode of Transportation 2024 & 2032
- Figure 30: Thailand ASEAN Chemical Logistics Market Revenue (Million), by End User 2024 & 2032
- Figure 31: Thailand ASEAN Chemical Logistics Market Revenue Share (%), by End User 2024 & 2032
- Figure 32: Thailand ASEAN Chemical Logistics Market Revenue (Million), by Geography 2024 & 2032
- Figure 33: Thailand ASEAN Chemical Logistics Market Revenue Share (%), by Geography 2024 & 2032
- Figure 34: Thailand ASEAN Chemical Logistics Market Revenue (Million), by Country 2024 & 2032
- Figure 35: Thailand ASEAN Chemical Logistics Market Revenue Share (%), by Country 2024 & 2032
- Figure 36: Malaysia ASEAN Chemical Logistics Market Revenue (Million), by Service 2024 & 2032
- Figure 37: Malaysia ASEAN Chemical Logistics Market Revenue Share (%), by Service 2024 & 2032
- Figure 38: Malaysia ASEAN Chemical Logistics Market Revenue (Million), by Mode of Transportation 2024 & 2032
- Figure 39: Malaysia ASEAN Chemical Logistics Market Revenue Share (%), by Mode of Transportation 2024 & 2032
- Figure 40: Malaysia ASEAN Chemical Logistics Market Revenue (Million), by End User 2024 & 2032
- Figure 41: Malaysia ASEAN Chemical Logistics Market Revenue Share (%), by End User 2024 & 2032
- Figure 42: Malaysia ASEAN Chemical Logistics Market Revenue (Million), by Geography 2024 & 2032
- Figure 43: Malaysia ASEAN Chemical Logistics Market Revenue Share (%), by Geography 2024 & 2032
- Figure 44: Malaysia ASEAN Chemical Logistics Market Revenue (Million), by Country 2024 & 2032
- Figure 45: Malaysia ASEAN Chemical Logistics Market Revenue Share (%), by Country 2024 & 2032
- Figure 46: Vietnam ASEAN Chemical Logistics Market Revenue (Million), by Service 2024 & 2032
- Figure 47: Vietnam ASEAN Chemical Logistics Market Revenue Share (%), by Service 2024 & 2032
- Figure 48: Vietnam ASEAN Chemical Logistics Market Revenue (Million), by Mode of Transportation 2024 & 2032
- Figure 49: Vietnam ASEAN Chemical Logistics Market Revenue Share (%), by Mode of Transportation 2024 & 2032
- Figure 50: Vietnam ASEAN Chemical Logistics Market Revenue (Million), by End User 2024 & 2032
- Figure 51: Vietnam ASEAN Chemical Logistics Market Revenue Share (%), by End User 2024 & 2032
- Figure 52: Vietnam ASEAN Chemical Logistics Market Revenue (Million), by Geography 2024 & 2032
- Figure 53: Vietnam ASEAN Chemical Logistics Market Revenue Share (%), by Geography 2024 & 2032
- Figure 54: Vietnam ASEAN Chemical Logistics Market Revenue (Million), by Country 2024 & 2032
- Figure 55: Vietnam ASEAN Chemical Logistics Market Revenue Share (%), by Country 2024 & 2032
- Figure 56: Indonesia ASEAN Chemical Logistics Market Revenue (Million), by Service 2024 & 2032
- Figure 57: Indonesia ASEAN Chemical Logistics Market Revenue Share (%), by Service 2024 & 2032
- Figure 58: Indonesia ASEAN Chemical Logistics Market Revenue (Million), by Mode of Transportation 2024 & 2032
- Figure 59: Indonesia ASEAN Chemical Logistics Market Revenue Share (%), by Mode of Transportation 2024 & 2032
- Figure 60: Indonesia ASEAN Chemical Logistics Market Revenue (Million), by End User 2024 & 2032
- Figure 61: Indonesia ASEAN Chemical Logistics Market Revenue Share (%), by End User 2024 & 2032
- Figure 62: Indonesia ASEAN Chemical Logistics Market Revenue (Million), by Geography 2024 & 2032
- Figure 63: Indonesia ASEAN Chemical Logistics Market Revenue Share (%), by Geography 2024 & 2032
- Figure 64: Indonesia ASEAN Chemical Logistics Market Revenue (Million), by Country 2024 & 2032
- Figure 65: Indonesia ASEAN Chemical Logistics Market Revenue Share (%), by Country 2024 & 2032
- Figure 66: Philippines ASEAN Chemical Logistics Market Revenue (Million), by Service 2024 & 2032
- Figure 67: Philippines ASEAN Chemical Logistics Market Revenue Share (%), by Service 2024 & 2032
- Figure 68: Philippines ASEAN Chemical Logistics Market Revenue (Million), by Mode of Transportation 2024 & 2032
- Figure 69: Philippines ASEAN Chemical Logistics Market Revenue Share (%), by Mode of Transportation 2024 & 2032
- Figure 70: Philippines ASEAN Chemical Logistics Market Revenue (Million), by End User 2024 & 2032
- Figure 71: Philippines ASEAN Chemical Logistics Market Revenue Share (%), by End User 2024 & 2032
- Figure 72: Philippines ASEAN Chemical Logistics Market Revenue (Million), by Geography 2024 & 2032
- Figure 73: Philippines ASEAN Chemical Logistics Market Revenue Share (%), by Geography 2024 & 2032
- Figure 74: Philippines ASEAN Chemical Logistics Market Revenue (Million), by Country 2024 & 2032
- Figure 75: Philippines ASEAN Chemical Logistics Market Revenue Share (%), by Country 2024 & 2032
- Figure 76: Rest of ASEAN ASEAN Chemical Logistics Market Revenue (Million), by Service 2024 & 2032
- Figure 77: Rest of ASEAN ASEAN Chemical Logistics Market Revenue Share (%), by Service 2024 & 2032
- Figure 78: Rest of ASEAN ASEAN Chemical Logistics Market Revenue (Million), by Mode of Transportation 2024 & 2032
- Figure 79: Rest of ASEAN ASEAN Chemical Logistics Market Revenue Share (%), by Mode of Transportation 2024 & 2032
- Figure 80: Rest of ASEAN ASEAN Chemical Logistics Market Revenue (Million), by End User 2024 & 2032
- Figure 81: Rest of ASEAN ASEAN Chemical Logistics Market Revenue Share (%), by End User 2024 & 2032
- Figure 82: Rest of ASEAN ASEAN Chemical Logistics Market Revenue (Million), by Geography 2024 & 2032
- Figure 83: Rest of ASEAN ASEAN Chemical Logistics Market Revenue Share (%), by Geography 2024 & 2032
- Figure 84: Rest of ASEAN ASEAN Chemical Logistics Market Revenue (Million), by Country 2024 & 2032
- Figure 85: Rest of ASEAN ASEAN Chemical Logistics Market Revenue Share (%), by Country 2024 & 2032
List of Tables
- Table 1: Global ASEAN Chemical Logistics Market Revenue Million Forecast, by Region 2019 & 2032
- Table 2: Global ASEAN Chemical Logistics Market Revenue Million Forecast, by Service 2019 & 2032
- Table 3: Global ASEAN Chemical Logistics Market Revenue Million Forecast, by Mode of Transportation 2019 & 2032
- Table 4: Global ASEAN Chemical Logistics Market Revenue Million Forecast, by End User 2019 & 2032
- Table 5: Global ASEAN Chemical Logistics Market Revenue Million Forecast, by Geography 2019 & 2032
- Table 6: Global ASEAN Chemical Logistics Market Revenue Million Forecast, by Region 2019 & 2032
- Table 7: Global ASEAN Chemical Logistics Market Revenue Million Forecast, by Country 2019 & 2032
- Table 8: ASEAN Chemical Logistics Market Revenue (Million) Forecast, by Application 2019 & 2032
- Table 9: Global ASEAN Chemical Logistics Market Revenue Million Forecast, by Country 2019 & 2032
- Table 10: ASEAN Chemical Logistics Market Revenue (Million) Forecast, by Application 2019 & 2032
- Table 11: Global ASEAN Chemical Logistics Market Revenue Million Forecast, by Country 2019 & 2032
- Table 12: ASEAN Chemical Logistics Market Revenue (Million) Forecast, by Application 2019 & 2032
- Table 13: Global ASEAN Chemical Logistics Market Revenue Million Forecast, by Country 2019 & 2032
- Table 14: ASEAN Chemical Logistics Market Revenue (Million) Forecast, by Application 2019 & 2032
- Table 15: Global ASEAN Chemical Logistics Market Revenue Million Forecast, by Country 2019 & 2032
- Table 16: ASEAN Chemical Logistics Market Revenue (Million) Forecast, by Application 2019 & 2032
- Table 17: Global ASEAN Chemical Logistics Market Revenue Million Forecast, by Country 2019 & 2032
- Table 18: ASEAN Chemical Logistics Market Revenue (Million) Forecast, by Application 2019 & 2032
- Table 19: Global ASEAN Chemical Logistics Market Revenue Million Forecast, by Country 2019 & 2032
- Table 20: ASEAN Chemical Logistics Market Revenue (Million) Forecast, by Application 2019 & 2032
- Table 21: Global ASEAN Chemical Logistics Market Revenue Million Forecast, by Service 2019 & 2032
- Table 22: Global ASEAN Chemical Logistics Market Revenue Million Forecast, by Mode of Transportation 2019 & 2032
- Table 23: Global ASEAN Chemical Logistics Market Revenue Million Forecast, by End User 2019 & 2032
- Table 24: Global ASEAN Chemical Logistics Market Revenue Million Forecast, by Geography 2019 & 2032
- Table 25: Global ASEAN Chemical Logistics Market Revenue Million Forecast, by Country 2019 & 2032
- Table 26: Global ASEAN Chemical Logistics Market Revenue Million Forecast, by Service 2019 & 2032
- Table 27: Global ASEAN Chemical Logistics Market Revenue Million Forecast, by Mode of Transportation 2019 & 2032
- Table 28: Global ASEAN Chemical Logistics Market Revenue Million Forecast, by End User 2019 & 2032
- Table 29: Global ASEAN Chemical Logistics Market Revenue Million Forecast, by Geography 2019 & 2032
- Table 30: Global ASEAN Chemical Logistics Market Revenue Million Forecast, by Country 2019 & 2032
- Table 31: Global ASEAN Chemical Logistics Market Revenue Million Forecast, by Service 2019 & 2032
- Table 32: Global ASEAN Chemical Logistics Market Revenue Million Forecast, by Mode of Transportation 2019 & 2032
- Table 33: Global ASEAN Chemical Logistics Market Revenue Million Forecast, by End User 2019 & 2032
- Table 34: Global ASEAN Chemical Logistics Market Revenue Million Forecast, by Geography 2019 & 2032
- Table 35: Global ASEAN Chemical Logistics Market Revenue Million Forecast, by Country 2019 & 2032
- Table 36: Global ASEAN Chemical Logistics Market Revenue Million Forecast, by Service 2019 & 2032
- Table 37: Global ASEAN Chemical Logistics Market Revenue Million Forecast, by Mode of Transportation 2019 & 2032
- Table 38: Global ASEAN Chemical Logistics Market Revenue Million Forecast, by End User 2019 & 2032
- Table 39: Global ASEAN Chemical Logistics Market Revenue Million Forecast, by Geography 2019 & 2032
- Table 40: Global ASEAN Chemical Logistics Market Revenue Million Forecast, by Country 2019 & 2032
- Table 41: Global ASEAN Chemical Logistics Market Revenue Million Forecast, by Service 2019 & 2032
- Table 42: Global ASEAN Chemical Logistics Market Revenue Million Forecast, by Mode of Transportation 2019 & 2032
- Table 43: Global ASEAN Chemical Logistics Market Revenue Million Forecast, by End User 2019 & 2032
- Table 44: Global ASEAN Chemical Logistics Market Revenue Million Forecast, by Geography 2019 & 2032
- Table 45: Global ASEAN Chemical Logistics Market Revenue Million Forecast, by Country 2019 & 2032
- Table 46: Global ASEAN Chemical Logistics Market Revenue Million Forecast, by Service 2019 & 2032
- Table 47: Global ASEAN Chemical Logistics Market Revenue Million Forecast, by Mode of Transportation 2019 & 2032
- Table 48: Global ASEAN Chemical Logistics Market Revenue Million Forecast, by End User 2019 & 2032
- Table 49: Global ASEAN Chemical Logistics Market Revenue Million Forecast, by Geography 2019 & 2032
- Table 50: Global ASEAN Chemical Logistics Market Revenue Million Forecast, by Country 2019 & 2032
- Table 51: Global ASEAN Chemical Logistics Market Revenue Million Forecast, by Service 2019 & 2032
- Table 52: Global ASEAN Chemical Logistics Market Revenue Million Forecast, by Mode of Transportation 2019 & 2032
- Table 53: Global ASEAN Chemical Logistics Market Revenue Million Forecast, by End User 2019 & 2032
- Table 54: Global ASEAN Chemical Logistics Market Revenue Million Forecast, by Geography 2019 & 2032
- Table 55: Global ASEAN Chemical Logistics Market Revenue Million Forecast, by Country 2019 & 2032
Frequently Asked Questions
1. What is the projected Compound Annual Growth Rate (CAGR) of the ASEAN Chemical Logistics Market?
The projected CAGR is approximately > 5.50%.
2. Which companies are prominent players in the ASEAN Chemical Logistics Market?
Key companies in the market include DHL, A&R Logistics, JWD InfoLogistics Public Company Limited, Alps Logistics**List Not Exhaustive, CEVA Logistics, Agility Logistics, CT Logistics, Tiong Nam Logistics Holdings BhD, Eagles Air & Sea, BDP International, Rinchem, Rhenus Logistics.
3. What are the main segments of the ASEAN Chemical Logistics Market?
The market segments include Service, Mode of Transportation, End User, Geography.
4. Can you provide details about the market size?
The market size is estimated to be USD XX Million as of 2022.
5. What are some drivers contributing to market growth?
The Rise in Demand for Specialty Chemicals in ASEAN Countries Increasing Trade Logistics Activity; Partnerships and Collaborations Between Major Players in the Chemical Logistics Market are Being Formed for the Creation of Innovative Goods and Technologically Enhanced Services.
6. What are the notable trends driving market growth?
The Rise in Chemical Production is Expected to Propel the Growth of the Chemical Logistics Market.
7. Are there any restraints impacting market growth?
Complexities Related to Chemical Logistics; High Cost Involved in the Transportation of Chemicals.
8. Can you provide examples of recent developments in the market?
October 2022: Rinchem is nearing the completion of a brand-new chemical warehouse based in Malaysia slated to be ready in Q2 of 2023. While the company currently has two other warehouses in the Asia Pacific (Taiwan & South Korea), this will be Rinchem's first warehouse located in Malaysia. The 45,000 sq. ft. dangerous goods warehouse will have the capacity to store 3100 pallet positions. Rinchem's warehouses are custom-built to support the proper segregation of various hazard classes and to offer multiple temperature zones.
9. What pricing options are available for accessing the report?
Pricing options include single-user, multi-user, and enterprise licenses priced at USD 4750, USD 5250, and USD 8750 respectively.
10. Is the market size provided in terms of value or volume?
The market size is provided in terms of value, measured in Million.
11. Are there any specific market keywords associated with the report?
Yes, the market keyword associated with the report is "ASEAN Chemical Logistics Market," which aids in identifying and referencing the specific market segment covered.
12. How do I determine which pricing option suits my needs best?
The pricing options vary based on user requirements and access needs. Individual users may opt for single-user licenses, while businesses requiring broader access may choose multi-user or enterprise licenses for cost-effective access to the report.
13. Are there any additional resources or data provided in the ASEAN Chemical Logistics Market report?
While the report offers comprehensive insights, it's advisable to review the specific contents or supplementary materials provided to ascertain if additional resources or data are available.
14. How can I stay updated on further developments or reports in the ASEAN Chemical Logistics Market?
To stay informed about further developments, trends, and reports in the ASEAN Chemical Logistics Market, consider subscribing to industry newsletters, following relevant companies and organizations, or regularly checking reputable industry news sources and publications.
Methodology
Step 1 - Identification of Relevant Samples Size from Population Database


Step 2 - Approaches for Defining Global Market Size (Value, Volume* & Price*)

Note*: In applicable scenarios
Step 3 - Data Sources
Primary Research
- Web Analytics
- Survey Reports
- Research Institute
- Latest Research Reports
- Opinion Leaders
Secondary Research
- Annual Reports
- White Paper
- Latest Press Release
- Industry Association
- Paid Database
- Investor Presentations

Step 4 - Data Triangulation
Involves using different sources of information in order to increase the validity of a study
These sources are likely to be stakeholders in a program - participants, other researchers, program staff, other community members, and so on.
Then we put all data in single framework & apply various statistical tools to find out the dynamic on the market.
During the analysis stage, feedback from the stakeholder groups would be compared to determine areas of agreement as well as areas of divergence


