
Key Insights
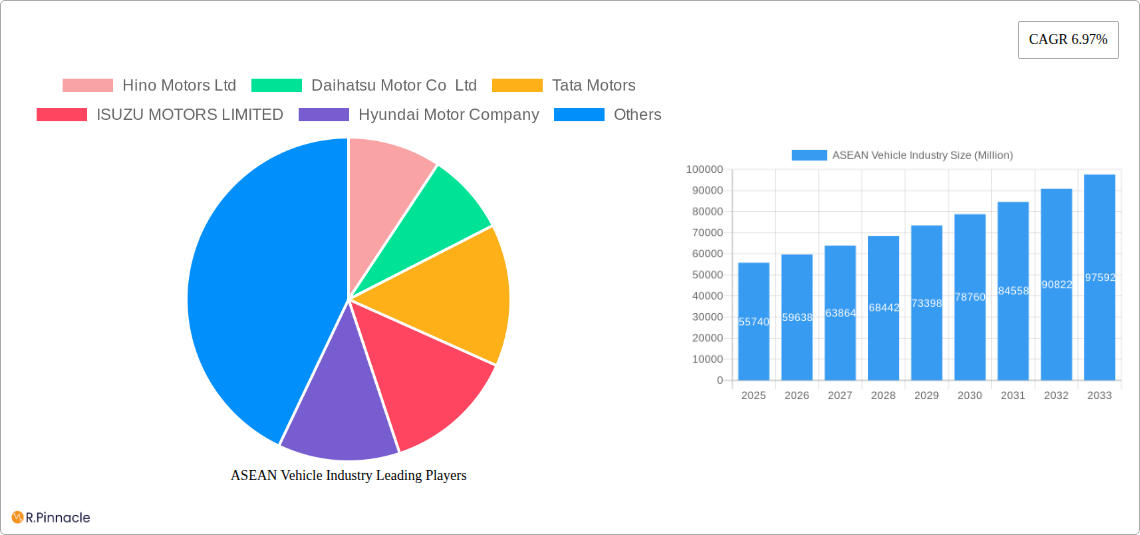
The ASEAN vehicle market, valued at $55.74 billion in 2025, is projected to experience robust growth, exhibiting a Compound Annual Growth Rate (CAGR) of 6.97% from 2025 to 2033. This expansion is fueled by several key factors. Firstly, rising disposable incomes across the region, particularly in rapidly developing economies like Indonesia and Vietnam, are driving increased demand for personal and commercial vehicles. Secondly, supportive government policies aimed at infrastructure development and promoting automotive manufacturing within ASEAN are fostering market growth. The increasing adoption of e-commerce and last-mile delivery services is significantly boosting the demand for light commercial vehicles (LCVs). Furthermore, the ongoing modernization of transportation infrastructure is stimulating the need for more efficient and durable medium- and heavy-duty commercial vehicles (M&HCVs). Competition among established players like Hino, Isuzu, and Tata Motors, alongside the growing presence of global brands, ensures a dynamic and competitive landscape.
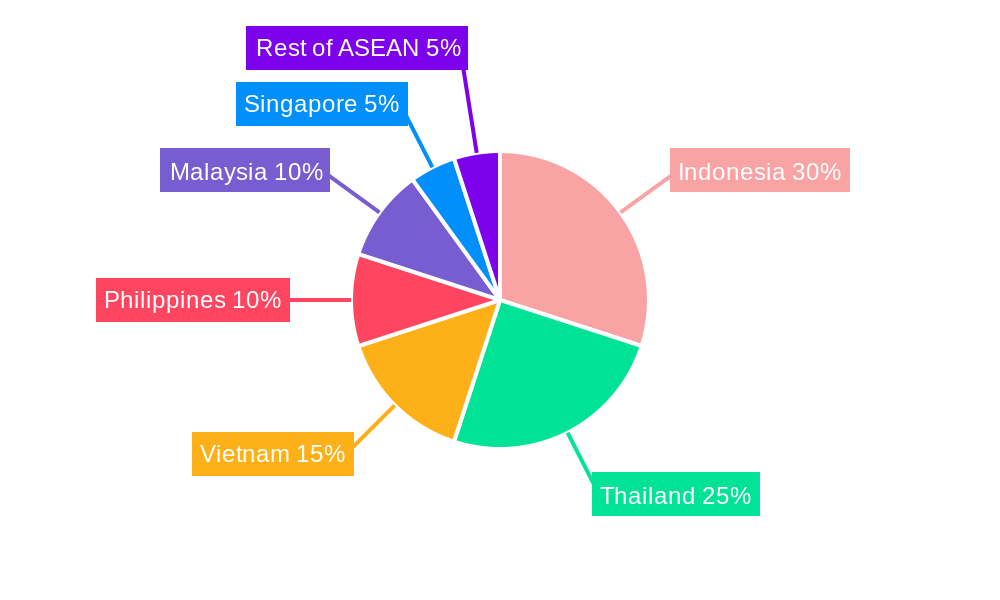
However, challenges remain. Fluctuations in fuel prices and raw material costs can impact production and pricing. Stringent emission regulations are pushing manufacturers to invest in cleaner technologies, increasing production costs. Furthermore, supply chain disruptions and the global economic climate pose potential risks to sustained market growth. Segment-wise, the LCV segment is expected to dominate, driven by the aforementioned factors, while the M&HCV segment will witness steady growth, primarily fueled by infrastructure projects and industrial activity. The market is geographically diversified, with Indonesia, Thailand, and Vietnam constituting the largest national markets. The consistent economic growth and expanding middle class within these nations significantly influence the overall market trajectory. This continued expansion is likely to drive further investment in the ASEAN automotive sector, creating a positive feedback loop of economic growth and market expansion throughout the forecast period.
ASEAN Vehicle Industry: A Comprehensive Market Report (2019-2033)
This in-depth report provides a comprehensive analysis of the ASEAN vehicle industry, offering invaluable insights for industry professionals, investors, and strategic planners. Covering the period 2019-2033, with a focus on 2025, this report dissects market dynamics, emerging trends, and future growth potential across diverse segments and countries. We leverage robust data and analysis to provide actionable intelligence for navigating this dynamic market.
ASEAN Vehicle Industry Market Structure & Innovation Trends
This section analyzes the competitive landscape of the ASEAN vehicle industry, encompassing market concentration, innovation drivers, regulatory frameworks, and M&A activities. We explore the interplay of these factors to provide a holistic view of the market structure.
Market Concentration: The ASEAN vehicle market exhibits a moderately concentrated structure, with a few major players holding significant market share. For example, Toyota (not included in your list of companies but a major player) and Honda hold a combined xx% market share in passenger vehicles in Thailand, while xx% of the commercial vehicle market is dominated by Isuzu and Hino. This concentration is further analyzed by country and vehicle type throughout the report.
Innovation Drivers: Government incentives for electric vehicles (EVs), rising environmental concerns, and the increasing demand for advanced driver-assistance systems (ADAS) are key drivers of innovation. The shift towards electrification, coupled with advancements in connected car technologies, is reshaping the industry landscape.
Regulatory Frameworks: Varying regulations across ASEAN nations concerning emission standards and vehicle safety standards create both opportunities and challenges for manufacturers. The harmonization of these regulations is a key factor influencing market dynamics.
Product Substitutes: The emergence of alternative transportation options, such as ride-hailing services and public transportation, poses a degree of substitution to vehicle ownership. This report analyzes this impact across different market segments.
End-User Demographics: The changing demographics of ASEAN, specifically the growing middle class and urbanization, significantly influence vehicle demand. We analyze these demographic shifts and their implications for market growth.
M&A Activities: The ASEAN vehicle industry has witnessed significant M&A activity in recent years. The value of these deals totaled approximately xx Million USD in the period 2019-2024, with major deals focusing on strategic partnerships and technology acquisitions. Specific examples are highlighted throughout the report.
ASEAN Vehicle Industry Market Dynamics & Trends
This section delves into the key market dynamics and trends shaping the ASEAN vehicle industry, including market growth drivers, technological disruptions, consumer preferences, and competitive dynamics. The analysis considers the period from 2019 to 2033, focusing on the forecast period 2025-2033 and the base year 2025.
The ASEAN vehicle market is projected to experience a CAGR of xx% during the forecast period (2025-2033). This growth is fueled by several factors, including rising disposable incomes, expanding infrastructure, and supportive government policies. The increasing adoption of EVs is a prominent trend, with market penetration projected to reach xx% by 2033. Consumer preferences are shifting towards fuel-efficient and technologically advanced vehicles. Competitive dynamics are characterized by intense rivalry among established players and the emergence of new entrants, particularly in the EV segment. The ongoing chip shortage and supply chain disruptions continue to create challenges and influence market dynamics.
Dominant Regions & Segments in ASEAN Vehicle Industry
This section identifies the leading regions and segments within the ASEAN vehicle market.
By Country:
Indonesia: Indonesia's large population and expanding economy make it the dominant market in ASEAN, driven by robust domestic demand and government infrastructure investments.
Thailand: Thailand's established automotive manufacturing base and supportive government policies contribute to its strong position in the regional market.
Vietnam: Vietnam's burgeoning economy and increasing vehicle ownership rates position it as a high-growth market.
Other Countries: Malaysia, the Philippines, and Singapore each have established markets albeit smaller than Indonesia and Thailand. The "Rest of ASEAN" comprises smaller markets with significant growth potential.
By Vehicle Type:
Light Commercial Vehicles (LCVs): This segment is experiencing strong growth driven by the rise of e-commerce and last-mile delivery services.
Medium- and Heavy-duty Commercial Vehicles (M&HCVs): Growth in this segment is tied to infrastructure development and industrial activities.
ASEAN Vehicle Industry Product Innovations
The ASEAN vehicle industry showcases a range of product innovations, focusing on fuel efficiency, safety, and connectivity. The shift toward EVs is particularly significant, with manufacturers introducing new models and expanding charging infrastructure. Advancements in ADAS features are becoming increasingly common, enhancing vehicle safety and driving experience. These innovations cater to evolving consumer preferences and stringent regulatory requirements.
Report Scope & Segmentation Analysis
This report segments the ASEAN vehicle market by country (Indonesia, Thailand, Vietnam, Singapore, Malaysia, Philippines, Rest of ASEAN) and vehicle type (Light Commercial Vehicles, Medium- and Heavy-duty Commercial Vehicles). Each segment's growth projections, market size, and competitive dynamics are analyzed. Market sizes are provided in Millions of USD. For example, the LCV segment in Indonesia is projected to reach xx Million USD by 2033, while the M&HCV market in Thailand is expected to reach xx Million USD. Competitive intensity varies significantly across segments and countries.
Key Drivers of ASEAN Vehicle Industry Growth
The growth of the ASEAN vehicle industry is driven by several factors:
Economic Growth: The expanding economies of ASEAN nations fuel increasing disposable incomes and higher vehicle demand.
Infrastructure Development: Government investments in road infrastructure support vehicle adoption.
Technological Advancements: Innovations in engine technology, EV development, and connected car features stimulate market growth.
Government Policies: Supportive government policies including incentives and tax breaks enhance market expansion.
Challenges in the ASEAN Vehicle Industry Sector
The ASEAN vehicle industry faces several challenges:
Supply Chain Disruptions: Global supply chain issues, particularly concerning semiconductor chips, impact production and sales.
Regulatory Hurdles: Varying regulations across ASEAN nations create complexities for manufacturers.
Competitive Pressure: Intense competition among established players and new entrants pressure profit margins.
Emerging Opportunities in ASEAN Vehicle Industry
The ASEAN vehicle market presents several exciting opportunities:
EV Adoption: The increasing adoption of electric vehicles presents substantial opportunities for manufacturers and supporting infrastructure providers.
Shared Mobility Services: The growing popularity of ride-hailing services and car-sharing platforms offers new avenues for market growth.
Connected Car Technology: The integration of advanced connectivity features enhances the consumer experience and opens up new revenue streams.
Leading Players in the ASEAN Vehicle Industry Market
- Hino Motors Ltd
- Daihatsu Motor Co Ltd
- Tata Motors
- ISUZU MOTORS LIMITED
- Hyundai Motor Company
- FCA US LLC
- Scania
- UD Trucks Corp
- IVECO
- Honda Motor Co Ltd
- MITSUBISHI MOTORS CORPORATION
- Ford Motor Company
Key Developments in ASEAN Vehicle Industry
Oct 2022: Energy Absolute PCL announced plans to launch a 1-ton electric pickup truck under the MINE brand in Q4/2022, prioritizing commercial vehicles over passenger cars for now.
Sep 2022: PT Indika Energy Tbk. established a joint venture, PT Foxconn Indika Motor (FIM), with Foxconn to manufacture commercial electric vehicles and batteries.
Jun 2022: MAN Truck & Bus (M) Sdn Bhd delivered its first batch of new MAN Truck Generation vehicles to six transport companies in Malaysia.
Future Outlook for ASEAN Vehicle Industry Market
The ASEAN vehicle industry is poised for continued growth, driven by sustained economic expansion, infrastructure development, and technological advancements. The increasing adoption of EVs, alongside the expansion of connected car technologies, will be key growth accelerators. Strategic partnerships and investments in sustainable mobility solutions will be crucial for companies to thrive in this evolving landscape. The market is anticipated to see further consolidation and intense competition, particularly in the expanding EV segment. The report suggests significant potential for growth within the region, emphasizing the need for adaptability and innovation to successfully navigate the industry’s changing dynamics.
ASEAN Vehicle Industry Segmentation
-
1. Vehicle Type
- 1.1. Light Commercial Vehicles
- 1.2. Medium- and Heavy-duty Commercial Vehicles
ASEAN Vehicle Industry Segmentation By Geography
-
1. North America
- 1.1. United States
- 1.2. Canada
- 1.3. Mexico
-
2. South America
- 2.1. Brazil
- 2.2. Argentina
- 2.3. Rest of South America
-
3. Europe
- 3.1. United Kingdom
- 3.2. Germany
- 3.3. France
- 3.4. Italy
- 3.5. Spain
- 3.6. Russia
- 3.7. Benelux
- 3.8. Nordics
- 3.9. Rest of Europe
-
4. Middle East & Africa
- 4.1. Turkey
- 4.2. Israel
- 4.3. GCC
- 4.4. North Africa
- 4.5. South Africa
- 4.6. Rest of Middle East & Africa
-
5. Asia Pacific
- 5.1. China
- 5.2. India
- 5.3. Japan
- 5.4. South Korea
- 5.5. ASEAN
- 5.6. Oceania
- 5.7. Rest of Asia Pacific
ASEAN Vehicle Industry REPORT HIGHLIGHTS
| Aspects | Details |
|---|---|
| Study Period | 2019-2033 |
| Base Year | 2024 |
| Estimated Year | 2025 |
| Forecast Period | 2025-2033 |
| Historical Period | 2019-2024 |
| Growth Rate | CAGR of 6.97% from 2019-2033 |
| Segmentation |
|
Table of Contents
- 1. Introduction
- 1.1. Research Scope
- 1.2. Market Segmentation
- 1.3. Research Methodology
- 1.4. Definitions and Assumptions
- 2. Executive Summary
- 2.1. Introduction
- 3. Market Dynamics
- 3.1. Introduction
- 3.2. Market Drivers
- 3.2.1. Technological Advancements In Vehicles Driving Demand; Others
- 3.3. Market Restrains
- 3.3.1. High Scan Tool Costs to Limit Growth; Others
- 3.4. Market Trends
- 3.4.1. The Light Commercial Vehicle Segment Dominates the Market
- 4. Market Factor Analysis
- 4.1. Porters Five Forces
- 4.2. Supply/Value Chain
- 4.3. PESTEL analysis
- 4.4. Market Entropy
- 4.5. Patent/Trademark Analysis
- 5. Global ASEAN Vehicle Industry Analysis, Insights and Forecast, 2019-2031
- 5.1. Market Analysis, Insights and Forecast - by Vehicle Type
- 5.1.1. Light Commercial Vehicles
- 5.1.2. Medium- and Heavy-duty Commercial Vehicles
- 5.2. Market Analysis, Insights and Forecast - by Region
- 5.2.1. North America
- 5.2.2. South America
- 5.2.3. Europe
- 5.2.4. Middle East & Africa
- 5.2.5. Asia Pacific
- 5.1. Market Analysis, Insights and Forecast - by Vehicle Type
- 6. North America ASEAN Vehicle Industry Analysis, Insights and Forecast, 2019-2031
- 6.1. Market Analysis, Insights and Forecast - by Vehicle Type
- 6.1.1. Light Commercial Vehicles
- 6.1.2. Medium- and Heavy-duty Commercial Vehicles
- 6.1. Market Analysis, Insights and Forecast - by Vehicle Type
- 7. South America ASEAN Vehicle Industry Analysis, Insights and Forecast, 2019-2031
- 7.1. Market Analysis, Insights and Forecast - by Vehicle Type
- 7.1.1. Light Commercial Vehicles
- 7.1.2. Medium- and Heavy-duty Commercial Vehicles
- 7.1. Market Analysis, Insights and Forecast - by Vehicle Type
- 8. Europe ASEAN Vehicle Industry Analysis, Insights and Forecast, 2019-2031
- 8.1. Market Analysis, Insights and Forecast - by Vehicle Type
- 8.1.1. Light Commercial Vehicles
- 8.1.2. Medium- and Heavy-duty Commercial Vehicles
- 8.1. Market Analysis, Insights and Forecast - by Vehicle Type
- 9. Middle East & Africa ASEAN Vehicle Industry Analysis, Insights and Forecast, 2019-2031
- 9.1. Market Analysis, Insights and Forecast - by Vehicle Type
- 9.1.1. Light Commercial Vehicles
- 9.1.2. Medium- and Heavy-duty Commercial Vehicles
- 9.1. Market Analysis, Insights and Forecast - by Vehicle Type
- 10. Asia Pacific ASEAN Vehicle Industry Analysis, Insights and Forecast, 2019-2031
- 10.1. Market Analysis, Insights and Forecast - by Vehicle Type
- 10.1.1. Light Commercial Vehicles
- 10.1.2. Medium- and Heavy-duty Commercial Vehicles
- 10.1. Market Analysis, Insights and Forecast - by Vehicle Type
- 11. Germany ASEAN Vehicle Industry Analysis, Insights and Forecast, 2019-2031
- 11.1. Market Analysis, Insights and Forecast - By Country/Sub-region
- 11.1.1.
- 12. United Kingdom ASEAN Vehicle Industry Analysis, Insights and Forecast, 2019-2031
- 12.1. Market Analysis, Insights and Forecast - By Country/Sub-region
- 12.1.1.
- 13. France ASEAN Vehicle Industry Analysis, Insights and Forecast, 2019-2031
- 13.1. Market Analysis, Insights and Forecast - By Country/Sub-region
- 13.1.1.
- 14. Spain ASEAN Vehicle Industry Analysis, Insights and Forecast, 2019-2031
- 14.1. Market Analysis, Insights and Forecast - By Country/Sub-region
- 14.1.1.
- 15. Rest of Europe ASEAN Vehicle Industry Analysis, Insights and Forecast, 2019-2031
- 15.1. Market Analysis, Insights and Forecast - By Country/Sub-region
- 15.1.1.
- 16. Competitive Analysis
- 16.1. Global Market Share Analysis 2024
- 16.2. Company Profiles
- 16.2.1 Hino Motors Ltd
- 16.2.1.1. Overview
- 16.2.1.2. Products
- 16.2.1.3. SWOT Analysis
- 16.2.1.4. Recent Developments
- 16.2.1.5. Financials (Based on Availability)
- 16.2.2 Daihatsu Motor Co Ltd
- 16.2.2.1. Overview
- 16.2.2.2. Products
- 16.2.2.3. SWOT Analysis
- 16.2.2.4. Recent Developments
- 16.2.2.5. Financials (Based on Availability)
- 16.2.3 Tata Motors
- 16.2.3.1. Overview
- 16.2.3.2. Products
- 16.2.3.3. SWOT Analysis
- 16.2.3.4. Recent Developments
- 16.2.3.5. Financials (Based on Availability)
- 16.2.4 ISUZU MOTORS LIMITED
- 16.2.4.1. Overview
- 16.2.4.2. Products
- 16.2.4.3. SWOT Analysis
- 16.2.4.4. Recent Developments
- 16.2.4.5. Financials (Based on Availability)
- 16.2.5 Hyundai Motor Company
- 16.2.5.1. Overview
- 16.2.5.2. Products
- 16.2.5.3. SWOT Analysis
- 16.2.5.4. Recent Developments
- 16.2.5.5. Financials (Based on Availability)
- 16.2.6 FCA US LLC
- 16.2.6.1. Overview
- 16.2.6.2. Products
- 16.2.6.3. SWOT Analysis
- 16.2.6.4. Recent Developments
- 16.2.6.5. Financials (Based on Availability)
- 16.2.7 Scania
- 16.2.7.1. Overview
- 16.2.7.2. Products
- 16.2.7.3. SWOT Analysis
- 16.2.7.4. Recent Developments
- 16.2.7.5. Financials (Based on Availability)
- 16.2.8 UD Trucks Corp
- 16.2.8.1. Overview
- 16.2.8.2. Products
- 16.2.8.3. SWOT Analysis
- 16.2.8.4. Recent Developments
- 16.2.8.5. Financials (Based on Availability)
- 16.2.9 IVECO
- 16.2.9.1. Overview
- 16.2.9.2. Products
- 16.2.9.3. SWOT Analysis
- 16.2.9.4. Recent Developments
- 16.2.9.5. Financials (Based on Availability)
- 16.2.10 Honda Motor Co Ltd
- 16.2.10.1. Overview
- 16.2.10.2. Products
- 16.2.10.3. SWOT Analysis
- 16.2.10.4. Recent Developments
- 16.2.10.5. Financials (Based on Availability)
- 16.2.11 MITSUBISHI MOTORS CORPORATION
- 16.2.11.1. Overview
- 16.2.11.2. Products
- 16.2.11.3. SWOT Analysis
- 16.2.11.4. Recent Developments
- 16.2.11.5. Financials (Based on Availability)
- 16.2.12 Ford Motor Company
- 16.2.12.1. Overview
- 16.2.12.2. Products
- 16.2.12.3. SWOT Analysis
- 16.2.12.4. Recent Developments
- 16.2.12.5. Financials (Based on Availability)
- 16.2.1 Hino Motors Ltd
List of Figures
- Figure 1: Global ASEAN Vehicle Industry Revenue Breakdown (Million, %) by Region 2024 & 2032
- Figure 2: Germany ASEAN Vehicle Industry Revenue (Million), by Country 2024 & 2032
- Figure 3: Germany ASEAN Vehicle Industry Revenue Share (%), by Country 2024 & 2032
- Figure 4: United Kingdom ASEAN Vehicle Industry Revenue (Million), by Country 2024 & 2032
- Figure 5: United Kingdom ASEAN Vehicle Industry Revenue Share (%), by Country 2024 & 2032
- Figure 6: France ASEAN Vehicle Industry Revenue (Million), by Country 2024 & 2032
- Figure 7: France ASEAN Vehicle Industry Revenue Share (%), by Country 2024 & 2032
- Figure 8: Spain ASEAN Vehicle Industry Revenue (Million), by Country 2024 & 2032
- Figure 9: Spain ASEAN Vehicle Industry Revenue Share (%), by Country 2024 & 2032
- Figure 10: Rest of Europe ASEAN Vehicle Industry Revenue (Million), by Country 2024 & 2032
- Figure 11: Rest of Europe ASEAN Vehicle Industry Revenue Share (%), by Country 2024 & 2032
- Figure 12: North America ASEAN Vehicle Industry Revenue (Million), by Vehicle Type 2024 & 2032
- Figure 13: North America ASEAN Vehicle Industry Revenue Share (%), by Vehicle Type 2024 & 2032
- Figure 14: North America ASEAN Vehicle Industry Revenue (Million), by Country 2024 & 2032
- Figure 15: North America ASEAN Vehicle Industry Revenue Share (%), by Country 2024 & 2032
- Figure 16: South America ASEAN Vehicle Industry Revenue (Million), by Vehicle Type 2024 & 2032
- Figure 17: South America ASEAN Vehicle Industry Revenue Share (%), by Vehicle Type 2024 & 2032
- Figure 18: South America ASEAN Vehicle Industry Revenue (Million), by Country 2024 & 2032
- Figure 19: South America ASEAN Vehicle Industry Revenue Share (%), by Country 2024 & 2032
- Figure 20: Europe ASEAN Vehicle Industry Revenue (Million), by Vehicle Type 2024 & 2032
- Figure 21: Europe ASEAN Vehicle Industry Revenue Share (%), by Vehicle Type 2024 & 2032
- Figure 22: Europe ASEAN Vehicle Industry Revenue (Million), by Country 2024 & 2032
- Figure 23: Europe ASEAN Vehicle Industry Revenue Share (%), by Country 2024 & 2032
- Figure 24: Middle East & Africa ASEAN Vehicle Industry Revenue (Million), by Vehicle Type 2024 & 2032
- Figure 25: Middle East & Africa ASEAN Vehicle Industry Revenue Share (%), by Vehicle Type 2024 & 2032
- Figure 26: Middle East & Africa ASEAN Vehicle Industry Revenue (Million), by Country 2024 & 2032
- Figure 27: Middle East & Africa ASEAN Vehicle Industry Revenue Share (%), by Country 2024 & 2032
- Figure 28: Asia Pacific ASEAN Vehicle Industry Revenue (Million), by Vehicle Type 2024 & 2032
- Figure 29: Asia Pacific ASEAN Vehicle Industry Revenue Share (%), by Vehicle Type 2024 & 2032
- Figure 30: Asia Pacific ASEAN Vehicle Industry Revenue (Million), by Country 2024 & 2032
- Figure 31: Asia Pacific ASEAN Vehicle Industry Revenue Share (%), by Country 2024 & 2032
List of Tables
- Table 1: Global ASEAN Vehicle Industry Revenue Million Forecast, by Region 2019 & 2032
- Table 2: Global ASEAN Vehicle Industry Revenue Million Forecast, by Vehicle Type 2019 & 2032
- Table 3: Global ASEAN Vehicle Industry Revenue Million Forecast, by Region 2019 & 2032
- Table 4: Global ASEAN Vehicle Industry Revenue Million Forecast, by Country 2019 & 2032
- Table 5: ASEAN Vehicle Industry Revenue (Million) Forecast, by Application 2019 & 2032
- Table 6: Global ASEAN Vehicle Industry Revenue Million Forecast, by Country 2019 & 2032
- Table 7: ASEAN Vehicle Industry Revenue (Million) Forecast, by Application 2019 & 2032
- Table 8: Global ASEAN Vehicle Industry Revenue Million Forecast, by Country 2019 & 2032
- Table 9: ASEAN Vehicle Industry Revenue (Million) Forecast, by Application 2019 & 2032
- Table 10: Global ASEAN Vehicle Industry Revenue Million Forecast, by Country 2019 & 2032
- Table 11: ASEAN Vehicle Industry Revenue (Million) Forecast, by Application 2019 & 2032
- Table 12: Global ASEAN Vehicle Industry Revenue Million Forecast, by Country 2019 & 2032
- Table 13: ASEAN Vehicle Industry Revenue (Million) Forecast, by Application 2019 & 2032
- Table 14: Global ASEAN Vehicle Industry Revenue Million Forecast, by Vehicle Type 2019 & 2032
- Table 15: Global ASEAN Vehicle Industry Revenue Million Forecast, by Country 2019 & 2032
- Table 16: United States ASEAN Vehicle Industry Revenue (Million) Forecast, by Application 2019 & 2032
- Table 17: Canada ASEAN Vehicle Industry Revenue (Million) Forecast, by Application 2019 & 2032
- Table 18: Mexico ASEAN Vehicle Industry Revenue (Million) Forecast, by Application 2019 & 2032
- Table 19: Global ASEAN Vehicle Industry Revenue Million Forecast, by Vehicle Type 2019 & 2032
- Table 20: Global ASEAN Vehicle Industry Revenue Million Forecast, by Country 2019 & 2032
- Table 21: Brazil ASEAN Vehicle Industry Revenue (Million) Forecast, by Application 2019 & 2032
- Table 22: Argentina ASEAN Vehicle Industry Revenue (Million) Forecast, by Application 2019 & 2032
- Table 23: Rest of South America ASEAN Vehicle Industry Revenue (Million) Forecast, by Application 2019 & 2032
- Table 24: Global ASEAN Vehicle Industry Revenue Million Forecast, by Vehicle Type 2019 & 2032
- Table 25: Global ASEAN Vehicle Industry Revenue Million Forecast, by Country 2019 & 2032
- Table 26: United Kingdom ASEAN Vehicle Industry Revenue (Million) Forecast, by Application 2019 & 2032
- Table 27: Germany ASEAN Vehicle Industry Revenue (Million) Forecast, by Application 2019 & 2032
- Table 28: France ASEAN Vehicle Industry Revenue (Million) Forecast, by Application 2019 & 2032
- Table 29: Italy ASEAN Vehicle Industry Revenue (Million) Forecast, by Application 2019 & 2032
- Table 30: Spain ASEAN Vehicle Industry Revenue (Million) Forecast, by Application 2019 & 2032
- Table 31: Russia ASEAN Vehicle Industry Revenue (Million) Forecast, by Application 2019 & 2032
- Table 32: Benelux ASEAN Vehicle Industry Revenue (Million) Forecast, by Application 2019 & 2032
- Table 33: Nordics ASEAN Vehicle Industry Revenue (Million) Forecast, by Application 2019 & 2032
- Table 34: Rest of Europe ASEAN Vehicle Industry Revenue (Million) Forecast, by Application 2019 & 2032
- Table 35: Global ASEAN Vehicle Industry Revenue Million Forecast, by Vehicle Type 2019 & 2032
- Table 36: Global ASEAN Vehicle Industry Revenue Million Forecast, by Country 2019 & 2032
- Table 37: Turkey ASEAN Vehicle Industry Revenue (Million) Forecast, by Application 2019 & 2032
- Table 38: Israel ASEAN Vehicle Industry Revenue (Million) Forecast, by Application 2019 & 2032
- Table 39: GCC ASEAN Vehicle Industry Revenue (Million) Forecast, by Application 2019 & 2032
- Table 40: North Africa ASEAN Vehicle Industry Revenue (Million) Forecast, by Application 2019 & 2032
- Table 41: South Africa ASEAN Vehicle Industry Revenue (Million) Forecast, by Application 2019 & 2032
- Table 42: Rest of Middle East & Africa ASEAN Vehicle Industry Revenue (Million) Forecast, by Application 2019 & 2032
- Table 43: Global ASEAN Vehicle Industry Revenue Million Forecast, by Vehicle Type 2019 & 2032
- Table 44: Global ASEAN Vehicle Industry Revenue Million Forecast, by Country 2019 & 2032
- Table 45: China ASEAN Vehicle Industry Revenue (Million) Forecast, by Application 2019 & 2032
- Table 46: India ASEAN Vehicle Industry Revenue (Million) Forecast, by Application 2019 & 2032
- Table 47: Japan ASEAN Vehicle Industry Revenue (Million) Forecast, by Application 2019 & 2032
- Table 48: South Korea ASEAN Vehicle Industry Revenue (Million) Forecast, by Application 2019 & 2032
- Table 49: ASEAN ASEAN Vehicle Industry Revenue (Million) Forecast, by Application 2019 & 2032
- Table 50: Oceania ASEAN Vehicle Industry Revenue (Million) Forecast, by Application 2019 & 2032
- Table 51: Rest of Asia Pacific ASEAN Vehicle Industry Revenue (Million) Forecast, by Application 2019 & 2032
Frequently Asked Questions
1. What is the projected Compound Annual Growth Rate (CAGR) of the ASEAN Vehicle Industry?
The projected CAGR is approximately 6.97%.
2. Which companies are prominent players in the ASEAN Vehicle Industry?
Key companies in the market include Hino Motors Ltd, Daihatsu Motor Co Ltd, Tata Motors, ISUZU MOTORS LIMITED, Hyundai Motor Company, FCA US LLC, Scania, UD Trucks Corp, IVECO, Honda Motor Co Ltd, MITSUBISHI MOTORS CORPORATION, Ford Motor Company.
3. What are the main segments of the ASEAN Vehicle Industry?
The market segments include Vehicle Type.
4. Can you provide details about the market size?
The market size is estimated to be USD 55.74 Million as of 2022.
5. What are some drivers contributing to market growth?
Technological Advancements In Vehicles Driving Demand; Others.
6. What are the notable trends driving market growth?
The Light Commercial Vehicle Segment Dominates the Market.
7. Are there any restraints impacting market growth?
High Scan Tool Costs to Limit Growth; Others.
8. Can you provide examples of recent developments in the market?
Oct 2022- Energy Absolute PCL revealed that the development of its 100% electric passenger car MINE SPA1 under MINE Mobility was still one of EA's major business plans. The current focus of EA would be on commercial vehicles first, while the MINE SPA1 electric car project would be continued. EA also revealed that it plans to launch a 1-ton electric pickup truck under the brand MINE in Q4/2022.
9. What pricing options are available for accessing the report?
Pricing options include single-user, multi-user, and enterprise licenses priced at USD 3800, USD 4500, and USD 5800 respectively.
10. Is the market size provided in terms of value or volume?
The market size is provided in terms of value, measured in Million.
11. Are there any specific market keywords associated with the report?
Yes, the market keyword associated with the report is "ASEAN Vehicle Industry," which aids in identifying and referencing the specific market segment covered.
12. How do I determine which pricing option suits my needs best?
The pricing options vary based on user requirements and access needs. Individual users may opt for single-user licenses, while businesses requiring broader access may choose multi-user or enterprise licenses for cost-effective access to the report.
13. Are there any additional resources or data provided in the ASEAN Vehicle Industry report?
While the report offers comprehensive insights, it's advisable to review the specific contents or supplementary materials provided to ascertain if additional resources or data are available.
14. How can I stay updated on further developments or reports in the ASEAN Vehicle Industry?
To stay informed about further developments, trends, and reports in the ASEAN Vehicle Industry, consider subscribing to industry newsletters, following relevant companies and organizations, or regularly checking reputable industry news sources and publications.
Methodology
Step 1 - Identification of Relevant Samples Size from Population Database


Step 2 - Approaches for Defining Global Market Size (Value, Volume* & Price*)

Note*: In applicable scenarios
Step 3 - Data Sources
Primary Research
- Web Analytics
- Survey Reports
- Research Institute
- Latest Research Reports
- Opinion Leaders
Secondary Research
- Annual Reports
- White Paper
- Latest Press Release
- Industry Association
- Paid Database
- Investor Presentations

Step 4 - Data Triangulation
Involves using different sources of information in order to increase the validity of a study
These sources are likely to be stakeholders in a program - participants, other researchers, program staff, other community members, and so on.
Then we put all data in single framework & apply various statistical tools to find out the dynamic on the market.
During the analysis stage, feedback from the stakeholder groups would be compared to determine areas of agreement as well as areas of divergence


