


Key Insights
The Asia-Pacific offshore energy market is poised for substantial growth, driven by escalating energy demands, supportive government mandates for renewable energy adoption, and technological innovations that boost the efficiency and cost-effectiveness of offshore wind, wave, and tidal energy projects. Key markets including China, Japan, South Korea, and Australia are spearheading this expansion through significant investments in renewable energy infrastructure and a strong commitment to carbon emission reduction. The declining costs of offshore wind technology are also a major catalyst, making it increasingly competitive against fossil fuels. However, high initial capital requirements, complex permitting, and environmental considerations for marine ecosystems present ongoing challenges. The region's diverse geography offers varied opportunities and hurdles, with specific locations being more conducive to certain offshore energy technologies. Over the forecast period of 2025-2033, sustained expansion is expected, fueled by large-scale project deployments and continuous technological advancements. Niche segments like Ocean Thermal Energy Conversion (OTEC) may see slower development due to technological limitations and higher costs compared to established offshore wind solutions.
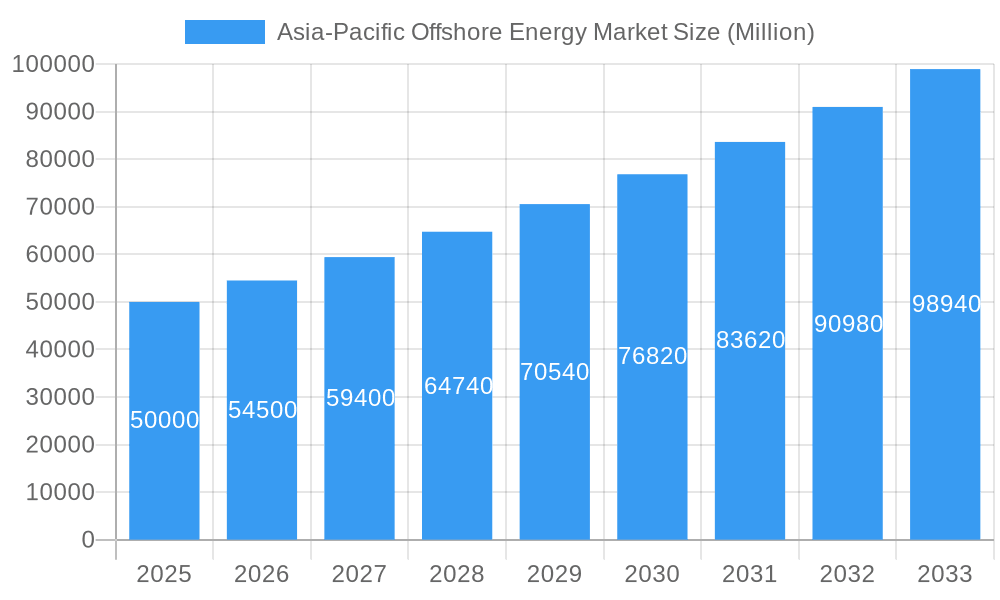
Asia-Pacific Offshore Energy Market Market Size (In Billion)

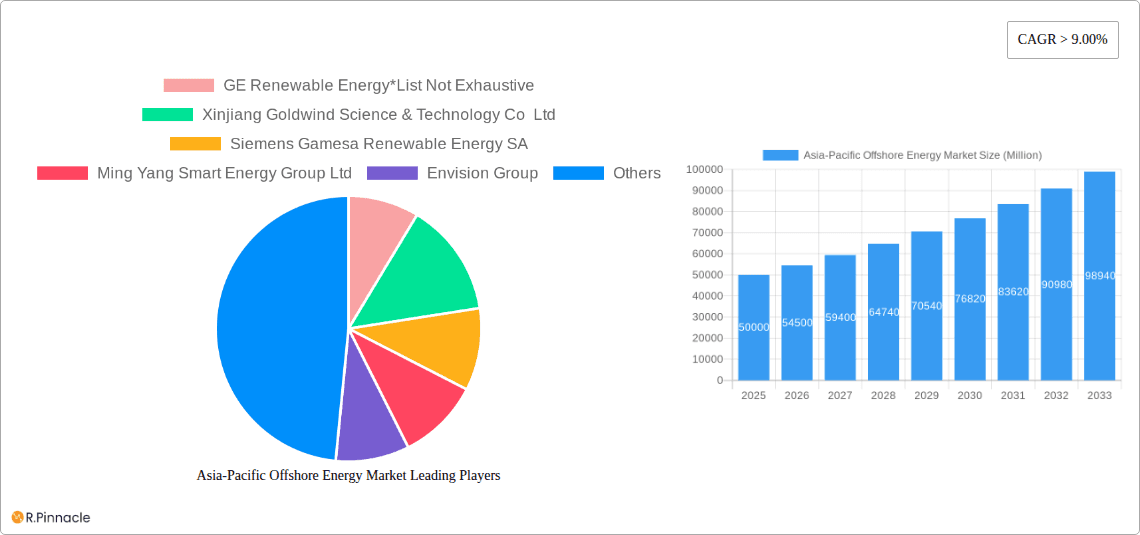
The Asia-Pacific offshore energy sector is projected to experience significant expansion, with a Compound Annual Growth Rate (CAGR) exceeding 13.1%. The market size in 2025 is estimated at $34.07 billion. This surge is driven by the imperative transition to cleaner energy sources and the region's vast potential for marine renewable energy. Key players such as GE Renewable Energy, Goldwind, and Siemens Gamesa are making substantial investments, underscoring market appeal. Consistent policy support and streamlined regulatory frameworks are crucial for mitigating risks and accelerating growth across the region's diverse landscapes. Diversification beyond offshore wind will be a key indicator of market maturity and long-term sustainability.
Asia-Pacific Offshore Energy Market Company Market Share
This report delivers an in-depth analysis of the Asia-Pacific offshore energy market, providing critical insights for industry leaders, investors, and policymakers. Covering the period from 2019 to 2033, with a specific focus on the 2025 base year, this study examines market dynamics, technological progress, prominent players, and future growth trajectories across various segments. Leveraging comprehensive data and expert analysis, this report offers actionable intelligence for navigating this dynamic market.
Asia-Pacific Offshore Energy Market Market Structure & Innovation Trends
The Asia-Pacific offshore energy market is characterized by a moderately concentrated structure, with several multinational corporations and regional players dominating different segments. Market share is fluid, with ongoing M&A activity influencing the competitive landscape. Innovation is driven by the need to reduce costs, enhance efficiency, and develop more sustainable energy solutions. Regulatory frameworks vary across the region, impacting investment decisions and project timelines. Product substitutes, primarily fossil fuels, continue to pose a challenge, although government incentives and growing environmental awareness are steadily shifting the market dynamics. End-user demographics are expanding, with increasing demand from both industrial and residential sectors.
- Market Concentration: Moderate, with key players holding significant shares (specific figures unavailable, but analysis included in the full report).
- Innovation Drivers: Cost reduction, efficiency improvements, sustainability goals.
- Regulatory Frameworks: Vary significantly across countries, impacting project viability.
- M&A Activity: Ongoing consolidation and expansion through mergers and acquisitions (Total M&A deal value for the period: xx Million).
Asia-Pacific Offshore Energy Market Market Dynamics & Trends
The Asia-Pacific offshore energy market is experiencing robust growth, driven by increasing energy demand, supportive government policies, and technological advancements. The Compound Annual Growth Rate (CAGR) is projected at xx% during the forecast period (2025-2033). Technological disruptions, such as advancements in wind turbine technology and the development of innovative wave and tidal energy systems, are accelerating market expansion. Consumer preferences are shifting towards cleaner and more sustainable energy sources, bolstering the market’s growth trajectory. Competitive dynamics are intense, with companies vying for market share through innovation, strategic partnerships, and aggressive expansion strategies. Market penetration for offshore wind energy, for example, is projected to reach xx% by 2033.
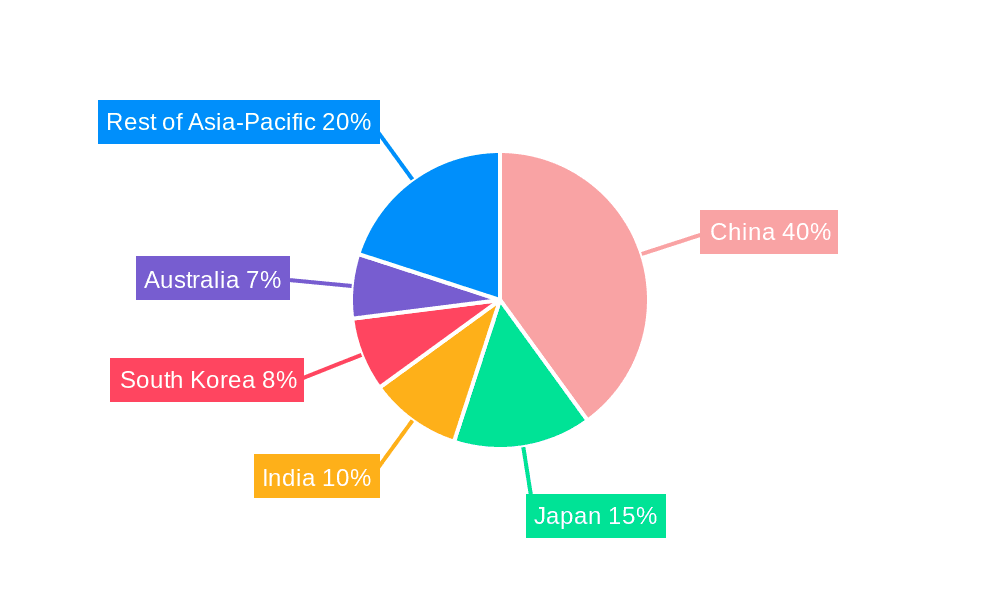
Dominant Regions & Segments in Asia-Pacific Offshore Energy Market
The report identifies [Specific Country/Region - e.g., China or Australia] as the dominant region in the Asia-Pacific offshore energy market. Wind energy currently constitutes the largest segment, owing to significant technological advancements and governmental support.
- Key Drivers for [Specific Country/Region]:
- Favorable government policies and incentives for renewable energy.
- Robust infrastructure development.
- High energy demand.
- Wind Energy: The dominant technology, fueled by substantial investments in offshore wind farms.
- Other Technologies (Wave, Tidal, OTEC): Show promising growth potential, but face challenges related to technological maturity and cost-effectiveness. Further detailed analysis is provided in the full report.
Asia-Pacific Offshore Energy Market Product Innovations
Recent product innovations focus on enhancing the efficiency and cost-effectiveness of offshore energy technologies. Advancements in wind turbine design, the development of more robust and durable subsea infrastructure, and improved energy storage solutions are shaping the market landscape. These innovations are increasingly addressing issues of scalability and environmental impact, further enhancing market appeal.
Report Scope & Segmentation Analysis
This report segments the Asia-Pacific offshore energy market by technology:
- Wind Energy: Market size in 2025: xx Million; Growth projection (2025-2033): xx%; Competitive dynamics: High.
- Wave Energy: Market size in 2025: xx Million; Growth projection (2025-2033): xx%; Competitive dynamics: Moderate.
- Tidal Stream Energy: Market size in 2025: xx Million; Growth projection (2025-2033): xx%; Competitive dynamics: Low.
- Ocean Thermal Energy Conversion (OTEC): Market size in 2025: xx Million; Growth projection (2025-2033): xx%; Competitive dynamics: Low.
- Other Technologies: Market size in 2025: xx Million; Growth projection (2025-2033): xx%; Competitive dynamics: Emerging.
Key Drivers of Asia-Pacific Offshore Energy Market Growth
The growth of the Asia-Pacific offshore energy market is primarily fueled by several key factors: a rising demand for cleaner energy sources to mitigate climate change, significant governmental investments in renewable energy infrastructure, and continuous technological advancements leading to improved efficiency and cost reductions in offshore energy technologies. Furthermore, favorable regulatory frameworks in several key countries are incentivizing private sector investment, contributing significantly to market expansion.
Challenges in the Asia-Pacific Offshore Energy Market Sector
Challenges include the high initial investment costs associated with offshore energy projects, logistical complexities involved in offshore construction and maintenance, and regulatory uncertainties in some regions. Supply chain disruptions can also impact project timelines and costs. Competition from established fossil fuel industries presents another significant hurdle. These factors collectively influence the overall market growth rate and investor confidence.
Emerging Opportunities in Asia-Pacific Offshore Energy Market
Emerging opportunities lie in the development of hybrid energy systems, combining different offshore energy sources to enhance reliability and efficiency. Further advancements in energy storage technologies will enable better grid integration and reduce reliance on fossil fuel backups. The increasing adoption of digitalization and AI in project management and operation could further boost the market's growth trajectory. The expansion into previously untapped regions with high offshore energy potential also presents significant opportunities.
Leading Players in the Asia-Pacific Offshore Energy Market Market
- GE Renewable Energy
- Xinjiang Goldwind Science & Technology Co Ltd
- Siemens Gamesa Renewable Energy SA
- Ming Yang Smart Energy Group Ltd
- Envision Group
- Suzlon Energy Ltd
- Vestas Wind Systems AS
- Hann-Ocean Energy
- Nordex SE
- Mitsubishi Heavy Industries Ltd
Key Developments in Asia-Pacific Offshore Energy Market Industry
- August 2022: The Australian federal government declared the first offshore wind zone in Gippsland, Victoria, paving the way for significant offshore wind farm development. This signifies a major milestone for the Australian offshore energy sector.
- June 2022: India announced transmission plans for 10 GW of offshore wind energy projects off Gujarat and Tamil Nadu coasts, involving a 4.0 GW annual capacity bid-out for three years, followed by 5 GW annually until FY 29-30. This demonstrates India's commitment to expanding its offshore renewable energy capacity and will significantly impact market growth.
Future Outlook for Asia-Pacific Offshore Energy Market Market
The Asia-Pacific offshore energy market is poised for substantial growth in the coming years. Continued technological advancements, supportive government policies, and rising demand for renewable energy will act as major growth accelerators. Strategic partnerships and investments in research and development will further propel market expansion. The market is expected to witness significant investment inflows, driving innovation and competition across all segments.
Asia-Pacific Offshore Energy Market Segmentation
-
1. Technology
- 1.1. Wind Energy
- 1.2. Wave Energy
- 1.3. Tidal Stream
- 1.4. Ocean Thermal Energy Conversion (OTEC)
- 1.5. Other Technologies
-
2. Geography
- 2.1. China
- 2.2. Taiwan
- 2.3. South Korea
- 2.4. Japan
- 2.5. Vietnam
- 2.6. Rest of Asia-Pacific
Asia-Pacific Offshore Energy Market Segmentation By Geography
- 1. China
- 2. Taiwan
- 3. South Korea
- 4. Japan
- 5. Vietnam
- 6. Rest of Asia Pacific
Asia-Pacific Offshore Energy Market Regional Market Share
Geographic Coverage of Asia-Pacific Offshore Energy Market
Asia-Pacific Offshore Energy Market REPORT HIGHLIGHTS
| Aspects | Details |
|---|---|
| Study Period | 2020-2034 |
| Base Year | 2025 |
| Estimated Year | 2026 |
| Forecast Period | 2026-2034 |
| Historical Period | 2020-2025 |
| Growth Rate | CAGR of 13.1% from 2020-2034 |
| Segmentation |
|
Table of Contents
- 1. Introduction
- 1.1. Research Scope
- 1.2. Market Segmentation
- 1.3. Research Methodology
- 1.4. Definitions and Assumptions
- 2. Executive Summary
- 2.1. Introduction
- 3. Market Dynamics
- 3.1. Introduction
- 3.2. Market Drivers
- 3.2.1. 4.; Increasing Investments in Offshore Wind Power Projects4.; Supportive Government Policies
- 3.3. Market Restrains
- 3.3.1. 4.; Increasing Adopting of Alternative Clean Energy Sources (Ex
- 3.4. Market Trends
- 3.4.1. Wind Energy Segment to Dominate the Market
- 4. Market Factor Analysis
- 4.1. Porters Five Forces
- 4.2. Supply/Value Chain
- 4.3. PESTEL analysis
- 4.4. Market Entropy
- 4.5. Patent/Trademark Analysis
- 5. Asia-Pacific Offshore Energy Market Analysis, Insights and Forecast, 2020-2032
- 5.1. Market Analysis, Insights and Forecast - by Technology
- 5.1.1. Wind Energy
- 5.1.2. Wave Energy
- 5.1.3. Tidal Stream
- 5.1.4. Ocean Thermal Energy Conversion (OTEC)
- 5.1.5. Other Technologies
- 5.2. Market Analysis, Insights and Forecast - by Geography
- 5.2.1. China
- 5.2.2. Taiwan
- 5.2.3. South Korea
- 5.2.4. Japan
- 5.2.5. Vietnam
- 5.2.6. Rest of Asia-Pacific
- 5.3. Market Analysis, Insights and Forecast - by Region
- 5.3.1. China
- 5.3.2. Taiwan
- 5.3.3. South Korea
- 5.3.4. Japan
- 5.3.5. Vietnam
- 5.3.6. Rest of Asia Pacific
- 5.1. Market Analysis, Insights and Forecast - by Technology
- 6. China Asia-Pacific Offshore Energy Market Analysis, Insights and Forecast, 2020-2032
- 6.1. Market Analysis, Insights and Forecast - by Technology
- 6.1.1. Wind Energy
- 6.1.2. Wave Energy
- 6.1.3. Tidal Stream
- 6.1.4. Ocean Thermal Energy Conversion (OTEC)
- 6.1.5. Other Technologies
- 6.2. Market Analysis, Insights and Forecast - by Geography
- 6.2.1. China
- 6.2.2. Taiwan
- 6.2.3. South Korea
- 6.2.4. Japan
- 6.2.5. Vietnam
- 6.2.6. Rest of Asia-Pacific
- 6.1. Market Analysis, Insights and Forecast - by Technology
- 7. Taiwan Asia-Pacific Offshore Energy Market Analysis, Insights and Forecast, 2020-2032
- 7.1. Market Analysis, Insights and Forecast - by Technology
- 7.1.1. Wind Energy
- 7.1.2. Wave Energy
- 7.1.3. Tidal Stream
- 7.1.4. Ocean Thermal Energy Conversion (OTEC)
- 7.1.5. Other Technologies
- 7.2. Market Analysis, Insights and Forecast - by Geography
- 7.2.1. China
- 7.2.2. Taiwan
- 7.2.3. South Korea
- 7.2.4. Japan
- 7.2.5. Vietnam
- 7.2.6. Rest of Asia-Pacific
- 7.1. Market Analysis, Insights and Forecast - by Technology
- 8. South Korea Asia-Pacific Offshore Energy Market Analysis, Insights and Forecast, 2020-2032
- 8.1. Market Analysis, Insights and Forecast - by Technology
- 8.1.1. Wind Energy
- 8.1.2. Wave Energy
- 8.1.3. Tidal Stream
- 8.1.4. Ocean Thermal Energy Conversion (OTEC)
- 8.1.5. Other Technologies
- 8.2. Market Analysis, Insights and Forecast - by Geography
- 8.2.1. China
- 8.2.2. Taiwan
- 8.2.3. South Korea
- 8.2.4. Japan
- 8.2.5. Vietnam
- 8.2.6. Rest of Asia-Pacific
- 8.1. Market Analysis, Insights and Forecast - by Technology
- 9. Japan Asia-Pacific Offshore Energy Market Analysis, Insights and Forecast, 2020-2032
- 9.1. Market Analysis, Insights and Forecast - by Technology
- 9.1.1. Wind Energy
- 9.1.2. Wave Energy
- 9.1.3. Tidal Stream
- 9.1.4. Ocean Thermal Energy Conversion (OTEC)
- 9.1.5. Other Technologies
- 9.2. Market Analysis, Insights and Forecast - by Geography
- 9.2.1. China
- 9.2.2. Taiwan
- 9.2.3. South Korea
- 9.2.4. Japan
- 9.2.5. Vietnam
- 9.2.6. Rest of Asia-Pacific
- 9.1. Market Analysis, Insights and Forecast - by Technology
- 10. Vietnam Asia-Pacific Offshore Energy Market Analysis, Insights and Forecast, 2020-2032
- 10.1. Market Analysis, Insights and Forecast - by Technology
- 10.1.1. Wind Energy
- 10.1.2. Wave Energy
- 10.1.3. Tidal Stream
- 10.1.4. Ocean Thermal Energy Conversion (OTEC)
- 10.1.5. Other Technologies
- 10.2. Market Analysis, Insights and Forecast - by Geography
- 10.2.1. China
- 10.2.2. Taiwan
- 10.2.3. South Korea
- 10.2.4. Japan
- 10.2.5. Vietnam
- 10.2.6. Rest of Asia-Pacific
- 10.1. Market Analysis, Insights and Forecast - by Technology
- 11. Rest of Asia Pacific Asia-Pacific Offshore Energy Market Analysis, Insights and Forecast, 2020-2032
- 11.1. Market Analysis, Insights and Forecast - by Technology
- 11.1.1. Wind Energy
- 11.1.2. Wave Energy
- 11.1.3. Tidal Stream
- 11.1.4. Ocean Thermal Energy Conversion (OTEC)
- 11.1.5. Other Technologies
- 11.2. Market Analysis, Insights and Forecast - by Geography
- 11.2.1. China
- 11.2.2. Taiwan
- 11.2.3. South Korea
- 11.2.4. Japan
- 11.2.5. Vietnam
- 11.2.6. Rest of Asia-Pacific
- 11.1. Market Analysis, Insights and Forecast - by Technology
- 12. Competitive Analysis
- 12.1. Market Share Analysis 2025
- 12.2. Company Profiles
- 12.2.1 GE Renewable Energy*List Not Exhaustive
- 12.2.1.1. Overview
- 12.2.1.2. Products
- 12.2.1.3. SWOT Analysis
- 12.2.1.4. Recent Developments
- 12.2.1.5. Financials (Based on Availability)
- 12.2.2 Xinjiang Goldwind Science & Technology Co Ltd
- 12.2.2.1. Overview
- 12.2.2.2. Products
- 12.2.2.3. SWOT Analysis
- 12.2.2.4. Recent Developments
- 12.2.2.5. Financials (Based on Availability)
- 12.2.3 Siemens Gamesa Renewable Energy SA
- 12.2.3.1. Overview
- 12.2.3.2. Products
- 12.2.3.3. SWOT Analysis
- 12.2.3.4. Recent Developments
- 12.2.3.5. Financials (Based on Availability)
- 12.2.4 Ming Yang Smart Energy Group Ltd
- 12.2.4.1. Overview
- 12.2.4.2. Products
- 12.2.4.3. SWOT Analysis
- 12.2.4.4. Recent Developments
- 12.2.4.5. Financials (Based on Availability)
- 12.2.5 Envision Group
- 12.2.5.1. Overview
- 12.2.5.2. Products
- 12.2.5.3. SWOT Analysis
- 12.2.5.4. Recent Developments
- 12.2.5.5. Financials (Based on Availability)
- 12.2.6 Suzlon Energy Ltd
- 12.2.6.1. Overview
- 12.2.6.2. Products
- 12.2.6.3. SWOT Analysis
- 12.2.6.4. Recent Developments
- 12.2.6.5. Financials (Based on Availability)
- 12.2.7 Vestas Wind Systems AS
- 12.2.7.1. Overview
- 12.2.7.2. Products
- 12.2.7.3. SWOT Analysis
- 12.2.7.4. Recent Developments
- 12.2.7.5. Financials (Based on Availability)
- 12.2.8 Hann-Ocean Energy
- 12.2.8.1. Overview
- 12.2.8.2. Products
- 12.2.8.3. SWOT Analysis
- 12.2.8.4. Recent Developments
- 12.2.8.5. Financials (Based on Availability)
- 12.2.9 Nordex SE
- 12.2.9.1. Overview
- 12.2.9.2. Products
- 12.2.9.3. SWOT Analysis
- 12.2.9.4. Recent Developments
- 12.2.9.5. Financials (Based on Availability)
- 12.2.10 Mitsubishi Heavy Industries Ltd
- 12.2.10.1. Overview
- 12.2.10.2. Products
- 12.2.10.3. SWOT Analysis
- 12.2.10.4. Recent Developments
- 12.2.10.5. Financials (Based on Availability)
- 12.2.1 GE Renewable Energy*List Not Exhaustive
List of Figures
- Figure 1: Asia-Pacific Offshore Energy Market Revenue Breakdown (billion, %) by Product 2025 & 2033
- Figure 2: Asia-Pacific Offshore Energy Market Share (%) by Company 2025
List of Tables
- Table 1: Asia-Pacific Offshore Energy Market Revenue billion Forecast, by Technology 2020 & 2033
- Table 2: Asia-Pacific Offshore Energy Market Volume gigawatt Forecast, by Technology 2020 & 2033
- Table 3: Asia-Pacific Offshore Energy Market Revenue billion Forecast, by Geography 2020 & 2033
- Table 4: Asia-Pacific Offshore Energy Market Volume gigawatt Forecast, by Geography 2020 & 2033
- Table 5: Asia-Pacific Offshore Energy Market Revenue billion Forecast, by Region 2020 & 2033
- Table 6: Asia-Pacific Offshore Energy Market Volume gigawatt Forecast, by Region 2020 & 2033
- Table 7: Asia-Pacific Offshore Energy Market Revenue billion Forecast, by Technology 2020 & 2033
- Table 8: Asia-Pacific Offshore Energy Market Volume gigawatt Forecast, by Technology 2020 & 2033
- Table 9: Asia-Pacific Offshore Energy Market Revenue billion Forecast, by Geography 2020 & 2033
- Table 10: Asia-Pacific Offshore Energy Market Volume gigawatt Forecast, by Geography 2020 & 2033
- Table 11: Asia-Pacific Offshore Energy Market Revenue billion Forecast, by Country 2020 & 2033
- Table 12: Asia-Pacific Offshore Energy Market Volume gigawatt Forecast, by Country 2020 & 2033
- Table 13: Asia-Pacific Offshore Energy Market Revenue billion Forecast, by Technology 2020 & 2033
- Table 14: Asia-Pacific Offshore Energy Market Volume gigawatt Forecast, by Technology 2020 & 2033
- Table 15: Asia-Pacific Offshore Energy Market Revenue billion Forecast, by Geography 2020 & 2033
- Table 16: Asia-Pacific Offshore Energy Market Volume gigawatt Forecast, by Geography 2020 & 2033
- Table 17: Asia-Pacific Offshore Energy Market Revenue billion Forecast, by Country 2020 & 2033
- Table 18: Asia-Pacific Offshore Energy Market Volume gigawatt Forecast, by Country 2020 & 2033
- Table 19: Asia-Pacific Offshore Energy Market Revenue billion Forecast, by Technology 2020 & 2033
- Table 20: Asia-Pacific Offshore Energy Market Volume gigawatt Forecast, by Technology 2020 & 2033
- Table 21: Asia-Pacific Offshore Energy Market Revenue billion Forecast, by Geography 2020 & 2033
- Table 22: Asia-Pacific Offshore Energy Market Volume gigawatt Forecast, by Geography 2020 & 2033
- Table 23: Asia-Pacific Offshore Energy Market Revenue billion Forecast, by Country 2020 & 2033
- Table 24: Asia-Pacific Offshore Energy Market Volume gigawatt Forecast, by Country 2020 & 2033
- Table 25: Asia-Pacific Offshore Energy Market Revenue billion Forecast, by Technology 2020 & 2033
- Table 26: Asia-Pacific Offshore Energy Market Volume gigawatt Forecast, by Technology 2020 & 2033
- Table 27: Asia-Pacific Offshore Energy Market Revenue billion Forecast, by Geography 2020 & 2033
- Table 28: Asia-Pacific Offshore Energy Market Volume gigawatt Forecast, by Geography 2020 & 2033
- Table 29: Asia-Pacific Offshore Energy Market Revenue billion Forecast, by Country 2020 & 2033
- Table 30: Asia-Pacific Offshore Energy Market Volume gigawatt Forecast, by Country 2020 & 2033
- Table 31: Asia-Pacific Offshore Energy Market Revenue billion Forecast, by Technology 2020 & 2033
- Table 32: Asia-Pacific Offshore Energy Market Volume gigawatt Forecast, by Technology 2020 & 2033
- Table 33: Asia-Pacific Offshore Energy Market Revenue billion Forecast, by Geography 2020 & 2033
- Table 34: Asia-Pacific Offshore Energy Market Volume gigawatt Forecast, by Geography 2020 & 2033
- Table 35: Asia-Pacific Offshore Energy Market Revenue billion Forecast, by Country 2020 & 2033
- Table 36: Asia-Pacific Offshore Energy Market Volume gigawatt Forecast, by Country 2020 & 2033
- Table 37: Asia-Pacific Offshore Energy Market Revenue billion Forecast, by Technology 2020 & 2033
- Table 38: Asia-Pacific Offshore Energy Market Volume gigawatt Forecast, by Technology 2020 & 2033
- Table 39: Asia-Pacific Offshore Energy Market Revenue billion Forecast, by Geography 2020 & 2033
- Table 40: Asia-Pacific Offshore Energy Market Volume gigawatt Forecast, by Geography 2020 & 2033
- Table 41: Asia-Pacific Offshore Energy Market Revenue billion Forecast, by Country 2020 & 2033
- Table 42: Asia-Pacific Offshore Energy Market Volume gigawatt Forecast, by Country 2020 & 2033
Frequently Asked Questions
1. What is the projected Compound Annual Growth Rate (CAGR) of the Asia-Pacific Offshore Energy Market?
The projected CAGR is approximately 13.1%.
2. Which companies are prominent players in the Asia-Pacific Offshore Energy Market?
Key companies in the market include GE Renewable Energy*List Not Exhaustive, Xinjiang Goldwind Science & Technology Co Ltd, Siemens Gamesa Renewable Energy SA, Ming Yang Smart Energy Group Ltd, Envision Group, Suzlon Energy Ltd, Vestas Wind Systems AS, Hann-Ocean Energy, Nordex SE, Mitsubishi Heavy Industries Ltd.
3. What are the main segments of the Asia-Pacific Offshore Energy Market?
The market segments include Technology, Geography.
4. Can you provide details about the market size?
The market size is estimated to be USD 34.07 billion as of 2022.
5. What are some drivers contributing to market growth?
4.; Increasing Investments in Offshore Wind Power Projects4.; Supportive Government Policies.
6. What are the notable trends driving market growth?
Wind Energy Segment to Dominate the Market.
7. Are there any restraints impacting market growth?
4.; Increasing Adopting of Alternative Clean Energy Sources (Ex: Solar. Hydro).
8. Can you provide examples of recent developments in the market?
August 2022: It has been announced that the first offshore wind zone in Australia has been declared by the federal government, giving developers the green light to increase planning and consultation for wind farms. The first offshore wind zone is expected to be established off the coast of Gippsland, in Victoria's southeast, with Hunter Valley and Illawarra, Portland in Victoria, Northern Tasmania, Perth in Western Australia, Bunbury in Western Australia, and other areas to follow.
9. What pricing options are available for accessing the report?
Pricing options include single-user, multi-user, and enterprise licenses priced at USD 4750, USD 5250, and USD 8750 respectively.
10. Is the market size provided in terms of value or volume?
The market size is provided in terms of value, measured in billion and volume, measured in gigawatt.
11. Are there any specific market keywords associated with the report?
Yes, the market keyword associated with the report is "Asia-Pacific Offshore Energy Market," which aids in identifying and referencing the specific market segment covered.
12. How do I determine which pricing option suits my needs best?
The pricing options vary based on user requirements and access needs. Individual users may opt for single-user licenses, while businesses requiring broader access may choose multi-user or enterprise licenses for cost-effective access to the report.
13. Are there any additional resources or data provided in the Asia-Pacific Offshore Energy Market report?
While the report offers comprehensive insights, it's advisable to review the specific contents or supplementary materials provided to ascertain if additional resources or data are available.
14. How can I stay updated on further developments or reports in the Asia-Pacific Offshore Energy Market?
To stay informed about further developments, trends, and reports in the Asia-Pacific Offshore Energy Market, consider subscribing to industry newsletters, following relevant companies and organizations, or regularly checking reputable industry news sources and publications.
Methodology
Step 1 - Identification of Relevant Samples Size from Population Database


Step 2 - Approaches for Defining Global Market Size (Value, Volume* & Price*)

Note*: In applicable scenarios
Step 3 - Data Sources
Primary Research
- Web Analytics
- Survey Reports
- Research Institute
- Latest Research Reports
- Opinion Leaders
Secondary Research
- Annual Reports
- White Paper
- Latest Press Release
- Industry Association
- Paid Database
- Investor Presentations

Step 4 - Data Triangulation
Involves using different sources of information in order to increase the validity of a study
These sources are likely to be stakeholders in a program - participants, other researchers, program staff, other community members, and so on.
Then we put all data in single framework & apply various statistical tools to find out the dynamic on the market.
During the analysis stage, feedback from the stakeholder groups would be compared to determine areas of agreement as well as areas of divergence