
Key Insights
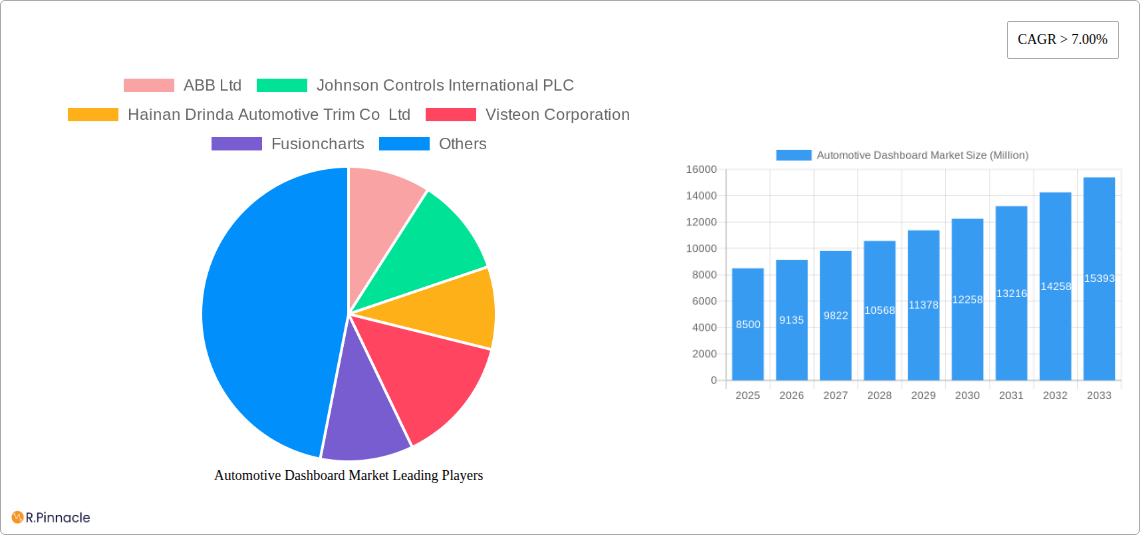
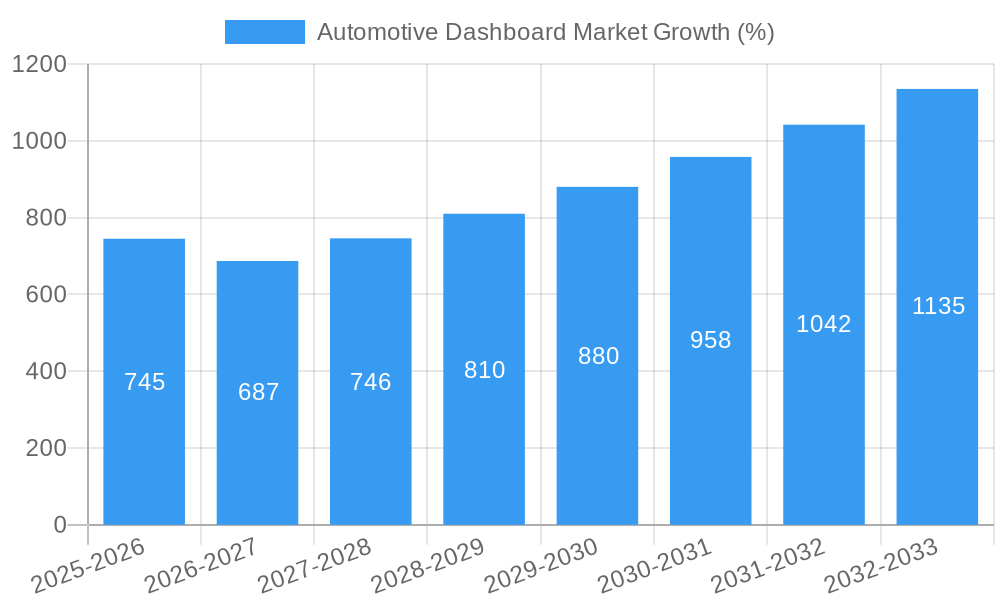
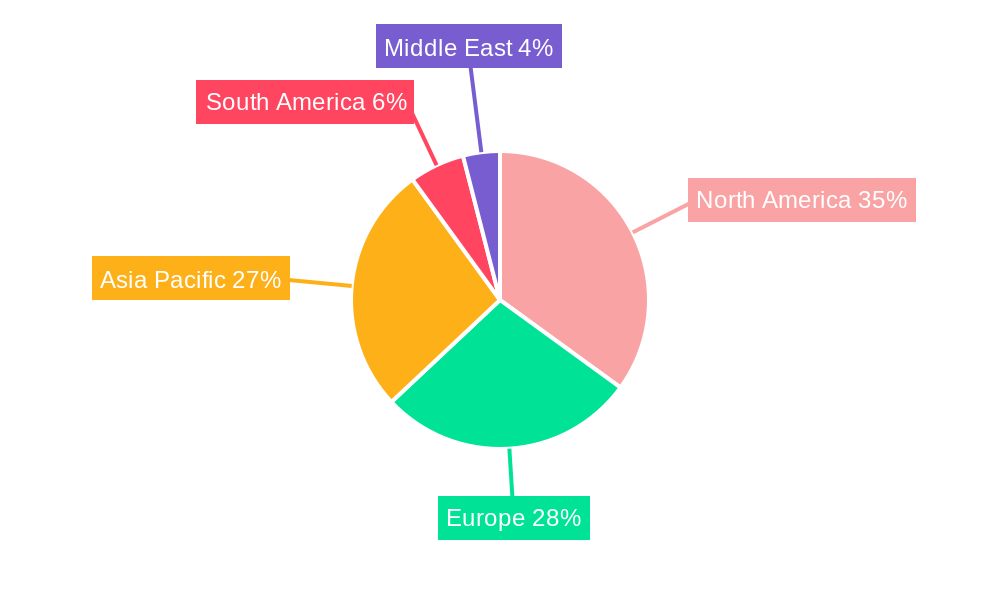
The automotive dashboard market is experiencing robust growth, driven by increasing demand for advanced driver-assistance systems (ADAS), rising vehicle production, and the growing preference for sophisticated infotainment systems. The market's Compound Annual Growth Rate (CAGR) exceeding 7% indicates a significant expansion projected through 2033. This growth is fueled by technological advancements, such as the integration of larger, higher-resolution LCD dashboards, and the increasing adoption of connected car technologies. The passenger car segment currently dominates the market, but commercial vehicles are also witnessing a steady rise in demand for advanced dashboards, particularly in heavy-duty trucks and buses, due to safety and fleet management needs. The OEM (Original Equipment Manufacturer) sales channel holds a larger share compared to the aftermarket, reflecting the initial integration of dashboards during vehicle manufacturing. However, the aftermarket segment is expected to grow at a faster pace due to the increasing popularity of dashboard upgrades and replacements. Key players like ABB, Johnson Controls, and Visteon are at the forefront of innovation, constantly striving to enhance features, design, and user experience. Geographic analysis reveals that North America and Asia Pacific represent the largest market segments, driven by significant automotive production volumes and consumer demand for advanced technologies in these regions.
The market segmentation reveals diverse opportunities. The LCD dashboard segment is experiencing rapid growth due to its superior display quality and capabilities for integrating advanced features. The shift towards digital cockpits and driver information systems will further propel this segment's growth. While conventional dashboards still hold a market presence, their market share is gradually declining as LCD and other digital displays become more affordable and widely adopted. Regional variations in growth are expected, with developing economies in Asia Pacific exhibiting particularly strong growth potential, fueled by rising disposable incomes and increasing vehicle ownership. Regulatory changes mandating advanced safety features also contribute to the market's overall growth trajectory. Competitive dynamics are intense, with major players focusing on strategic partnerships, mergers, and acquisitions to strengthen their market positions and technological capabilities. This highly dynamic market presents a compelling investment opportunity for companies capable of adapting to rapid technological changes and consumer preferences.
Automotive Dashboard Market: A Comprehensive Report (2019-2033)
This in-depth report provides a comprehensive analysis of the Automotive Dashboard Market, covering market structure, innovation trends, dynamics, regional performance, and future outlook. The study period spans from 2019 to 2033, with 2025 serving as the base and estimated year. The report is invaluable for industry professionals, investors, and strategists seeking actionable insights into this dynamic market. The market is projected to reach xx Million by 2033, exhibiting a CAGR of xx% during the forecast period (2025-2033).
Automotive Dashboard Market Market Structure & Innovation Trends
The Automotive Dashboard Market exhibits a moderately consolidated structure, with key players like ABB Ltd, Johnson Controls International PLC, and Visteon Corporation holding significant market share. Market concentration is estimated at xx%, driven by economies of scale and technological advancements. Innovation in the sector is fueled by increasing demand for advanced driver-assistance systems (ADAS), rising adoption of connected car technologies, and stringent safety regulations.
- Innovation Drivers: Advancements in display technology (LCD, OLED), integration of infotainment systems, and development of augmented reality (AR) dashboards.
- Regulatory Frameworks: Government mandates on vehicle safety and emissions contribute significantly to market growth, driving demand for sophisticated dashboards.
- Product Substitutes: While limited direct substitutes exist, the market faces indirect competition from alternative infotainment and navigation solutions.
- End-User Demographics: The market is primarily driven by passenger car segment with increasing demand from luxury and high-end vehicles.
- M&A Activities: The market has witnessed several mergers and acquisitions in recent years, with deal values totaling an estimated xx Million in the period 2019-2024. These activities aim to enhance technological capabilities and expand market reach.
Automotive Dashboard Market Market Dynamics & Trends
The Automotive Dashboard Market is experiencing robust growth driven by several factors. The increasing adoption of advanced driver-assistance systems (ADAS), the growing popularity of connected cars, and the rising demand for improved vehicle safety features are key market drivers. Technological advancements, such as the integration of artificial intelligence (AI) and machine learning (ML), are revolutionizing dashboard functionalities, leading to more intuitive and personalized user experiences. The shift towards electric vehicles (EVs) presents a significant opportunity, as EVs often feature larger and more sophisticated dashboards. The competitive landscape is highly dynamic, with established players and new entrants vying for market share through product innovation and strategic partnerships. The market penetration of LCD dashboards is expected to increase significantly, driven by their superior visual quality and functionality.
Dominant Regions & Segments in Automotive Dashboard Market
The Asia-Pacific region currently dominates the Automotive Dashboard Market, driven by strong automotive production in countries like China, Japan, and India. Within the regional segment, China represents the largest market share due to its vast automotive manufacturing base and rapidly growing consumer demand for advanced vehicle features.
- Key Drivers in Asia-Pacific:
- Robust automotive manufacturing base.
- Growing disposable income and rising consumer preference for advanced vehicle features.
- Favorable government policies supporting technological advancements.
- Passenger Cars Segment: This segment accounts for the largest share of the Automotive Dashboard Market, driven by higher sales volume and increasing demand for advanced features in passenger cars.
- OEM Sales Channel: The original equipment manufacturer (OEM) channel holds the major market share, with a significant number of dashboards being installed during vehicle manufacturing.
The conventional dashboard segment currently holds the larger market share, but the LCD dashboard segment is expected to witness significant growth, driven by its superior visual capabilities and increasing affordability.
Automotive Dashboard Market Product Innovations
Recent innovations focus on integrating larger, higher-resolution displays, incorporating advanced driver-assistance systems (ADAS), and seamless integration with smartphone connectivity. These advancements enhance user experience, safety features, and convenience. The trend toward personalized dashboards, adaptable to individual driver preferences and driving styles, is gaining traction. The competitive advantage lies in offering unique functionalities, high-quality displays, and efficient integration with existing vehicle systems.
Report Scope & Segmentation Analysis
This report segments the Automotive Dashboard Market based on vehicle type (Passenger Cars, Commercial Vehicles), sales channel (OEM, Aftermarket), and type (LCD Dashboard, Conventional Dashboard). Each segment is analyzed based on its market size, growth projections, and competitive dynamics. The passenger car segment is expected to dominate owing to higher volume sales. The OEM channel holds the larger market share, reflecting the integration of dashboards during vehicle manufacturing. The LCD dashboard segment is poised for significant growth due to its superior features.
Key Drivers of Automotive Dashboard Market Growth
Technological advancements like improved display technologies (LCD, OLED), integration of advanced driver assistance systems (ADAS), and connectivity features are major drivers. The increasing demand for enhanced safety and convenience in vehicles further fuels growth. Stringent government regulations promoting vehicle safety and emission reduction also contribute significantly.
Challenges in the Automotive Dashboard Market Sector
The Automotive Dashboard Market faces challenges such as fluctuating raw material prices, supply chain disruptions, and intense competition among manufacturers. Stringent quality and safety standards further increase production complexity and costs.
Emerging Opportunities in Automotive Dashboard Market
Emerging opportunities include the integration of augmented reality (AR) and virtual reality (VR) technologies, the development of more sustainable and eco-friendly dashboards, and expansion into new markets in developing economies. The growing demand for customized and personalized dashboards provides substantial opportunity for market players.
Leading Players in the Automotive Dashboard Market Market
- ABB Ltd
- Johnson Controls International PLC
- Hainan Drinda Automotive Trim Co Ltd
- Visteon Corporation
- Fusioncharts
- Dongfeng Electronic
- Huayu Automotive Systems Co Ltd
- Toyoda Gosei Co Ltd
- IA
- Faurecia SE
Key Developments in Automotive Dashboard Market Industry
- Jan 2023: Visteon Corporation launched a new generation of digital clusters with advanced graphics capabilities.
- Oct 2022: ABB Ltd. partnered with a major automotive OEM to develop a new dashboard featuring AI-powered functionalities.
- Further key developments will be listed in the full report.
Future Outlook for Automotive Dashboard Market Market
The Automotive Dashboard Market is poised for continued growth, driven by technological innovation and increasing demand for advanced features. Strategic partnerships, investments in R&D, and expansion into emerging markets will be crucial for future success. The market is expected to witness significant growth opportunities due to the increasing demand for customized dashboards, along with the integration of new technologies like AR and VR.
Automotive Dashboard Market Segmentation
-
1. Type
- 1.1. LCD Dashboard
- 1.2. Conventional Dashboard
-
2. Vehicle Type
- 2.1. Passenger Cars
- 2.2. Commercial Vehicles
-
3. Sales Channel
- 3.1. OEM
- 3.2. Aftermarket
Automotive Dashboard Market Segmentation By Geography
-
1. North America
- 1.1. United Sates
- 1.2. Canada
- 1.3. Rest of North America
-
2. Europe
- 2.1. Germany
- 2.2. United Kingdom
- 2.3. France
- 2.4. Russia
- 2.5. Rest of Europe
-
3. Asia Pacific
- 3.1. India
- 3.2. China
- 3.3. Japan
- 3.4. Rest of Asia Pacific
-
4. South America
- 4.1. Brazil
- 4.2. Argentina
- 4.3. Rest of South America
- 5. Middle East
-
6. United Arab Emirates
- 6.1. Saudi Arabia
- 6.2. Rest of Middle East
Automotive Dashboard Market REPORT HIGHLIGHTS
| Aspects | Details |
|---|---|
| Study Period | 2019-2033 |
| Base Year | 2024 |
| Estimated Year | 2025 |
| Forecast Period | 2025-2033 |
| Historical Period | 2019-2024 |
| Growth Rate | CAGR of > 7.00% from 2019-2033 |
| Segmentation |
|
Table of Contents
- 1. Introduction
- 1.1. Research Scope
- 1.2. Market Segmentation
- 1.3. Research Methodology
- 1.4. Definitions and Assumptions
- 2. Executive Summary
- 2.1. Introduction
- 3. Market Dynamics
- 3.1. Introduction
- 3.2. Market Drivers
- 3.2.1. Ease of Steering
- 3.3. Market Restrains
- 3.3.1. Cost and Price Sensitivity
- 3.4. Market Trends
- 3.4.1. Technological Developments Creating Demand for LCD Dashboards
- 4. Market Factor Analysis
- 4.1. Porters Five Forces
- 4.2. Supply/Value Chain
- 4.3. PESTEL analysis
- 4.4. Market Entropy
- 4.5. Patent/Trademark Analysis
- 5. Global Automotive Dashboard Market Analysis, Insights and Forecast, 2019-2031
- 5.1. Market Analysis, Insights and Forecast - by Type
- 5.1.1. LCD Dashboard
- 5.1.2. Conventional Dashboard
- 5.2. Market Analysis, Insights and Forecast - by Vehicle Type
- 5.2.1. Passenger Cars
- 5.2.2. Commercial Vehicles
- 5.3. Market Analysis, Insights and Forecast - by Sales Channel
- 5.3.1. OEM
- 5.3.2. Aftermarket
- 5.4. Market Analysis, Insights and Forecast - by Region
- 5.4.1. North America
- 5.4.2. Europe
- 5.4.3. Asia Pacific
- 5.4.4. South America
- 5.4.5. Middle East
- 5.4.6. United Arab Emirates
- 5.1. Market Analysis, Insights and Forecast - by Type
- 6. North America Automotive Dashboard Market Analysis, Insights and Forecast, 2019-2031
- 6.1. Market Analysis, Insights and Forecast - by Type
- 6.1.1. LCD Dashboard
- 6.1.2. Conventional Dashboard
- 6.2. Market Analysis, Insights and Forecast - by Vehicle Type
- 6.2.1. Passenger Cars
- 6.2.2. Commercial Vehicles
- 6.3. Market Analysis, Insights and Forecast - by Sales Channel
- 6.3.1. OEM
- 6.3.2. Aftermarket
- 6.1. Market Analysis, Insights and Forecast - by Type
- 7. Europe Automotive Dashboard Market Analysis, Insights and Forecast, 2019-2031
- 7.1. Market Analysis, Insights and Forecast - by Type
- 7.1.1. LCD Dashboard
- 7.1.2. Conventional Dashboard
- 7.2. Market Analysis, Insights and Forecast - by Vehicle Type
- 7.2.1. Passenger Cars
- 7.2.2. Commercial Vehicles
- 7.3. Market Analysis, Insights and Forecast - by Sales Channel
- 7.3.1. OEM
- 7.3.2. Aftermarket
- 7.1. Market Analysis, Insights and Forecast - by Type
- 8. Asia Pacific Automotive Dashboard Market Analysis, Insights and Forecast, 2019-2031
- 8.1. Market Analysis, Insights and Forecast - by Type
- 8.1.1. LCD Dashboard
- 8.1.2. Conventional Dashboard
- 8.2. Market Analysis, Insights and Forecast - by Vehicle Type
- 8.2.1. Passenger Cars
- 8.2.2. Commercial Vehicles
- 8.3. Market Analysis, Insights and Forecast - by Sales Channel
- 8.3.1. OEM
- 8.3.2. Aftermarket
- 8.1. Market Analysis, Insights and Forecast - by Type
- 9. South America Automotive Dashboard Market Analysis, Insights and Forecast, 2019-2031
- 9.1. Market Analysis, Insights and Forecast - by Type
- 9.1.1. LCD Dashboard
- 9.1.2. Conventional Dashboard
- 9.2. Market Analysis, Insights and Forecast - by Vehicle Type
- 9.2.1. Passenger Cars
- 9.2.2. Commercial Vehicles
- 9.3. Market Analysis, Insights and Forecast - by Sales Channel
- 9.3.1. OEM
- 9.3.2. Aftermarket
- 9.1. Market Analysis, Insights and Forecast - by Type
- 10. Middle East Automotive Dashboard Market Analysis, Insights and Forecast, 2019-2031
- 10.1. Market Analysis, Insights and Forecast - by Type
- 10.1.1. LCD Dashboard
- 10.1.2. Conventional Dashboard
- 10.2. Market Analysis, Insights and Forecast - by Vehicle Type
- 10.2.1. Passenger Cars
- 10.2.2. Commercial Vehicles
- 10.3. Market Analysis, Insights and Forecast - by Sales Channel
- 10.3.1. OEM
- 10.3.2. Aftermarket
- 10.1. Market Analysis, Insights and Forecast - by Type
- 11. United Arab Emirates Automotive Dashboard Market Analysis, Insights and Forecast, 2019-2031
- 11.1. Market Analysis, Insights and Forecast - by Type
- 11.1.1. LCD Dashboard
- 11.1.2. Conventional Dashboard
- 11.2. Market Analysis, Insights and Forecast - by Vehicle Type
- 11.2.1. Passenger Cars
- 11.2.2. Commercial Vehicles
- 11.3. Market Analysis, Insights and Forecast - by Sales Channel
- 11.3.1. OEM
- 11.3.2. Aftermarket
- 11.1. Market Analysis, Insights and Forecast - by Type
- 12. North America Automotive Dashboard Market Analysis, Insights and Forecast, 2019-2031
- 12.1. Market Analysis, Insights and Forecast - By Country/Sub-region
- 12.1.1 United Sates
- 12.1.2 Canada
- 12.1.3 Rest of North America
- 13. Europe Automotive Dashboard Market Analysis, Insights and Forecast, 2019-2031
- 13.1. Market Analysis, Insights and Forecast - By Country/Sub-region
- 13.1.1 Germany
- 13.1.2 United Kingdom
- 13.1.3 France
- 13.1.4 Russia
- 13.1.5 Rest of Europe
- 14. Asia Pacific Automotive Dashboard Market Analysis, Insights and Forecast, 2019-2031
- 14.1. Market Analysis, Insights and Forecast - By Country/Sub-region
- 14.1.1 India
- 14.1.2 China
- 14.1.3 Japan
- 14.1.4 Rest of Asia Pacific
- 15. South America Automotive Dashboard Market Analysis, Insights and Forecast, 2019-2031
- 15.1. Market Analysis, Insights and Forecast - By Country/Sub-region
- 15.1.1 Brazil
- 15.1.2 Argentina
- 15.1.3 Rest of South America
- 16. Middle East Automotive Dashboard Market Analysis, Insights and Forecast, 2019-2031
- 16.1. Market Analysis, Insights and Forecast - By Country/Sub-region
- 16.1.1.
- 17. United Arab Emirates Automotive Dashboard Market Analysis, Insights and Forecast, 2019-2031
- 17.1. Market Analysis, Insights and Forecast - By Country/Sub-region
- 17.1.1 Saudi Arabia
- 17.1.2 Rest of Middle East
- 18. Competitive Analysis
- 18.1. Global Market Share Analysis 2024
- 18.2. Company Profiles
- 18.2.1 ABB Ltd
- 18.2.1.1. Overview
- 18.2.1.2. Products
- 18.2.1.3. SWOT Analysis
- 18.2.1.4. Recent Developments
- 18.2.1.5. Financials (Based on Availability)
- 18.2.2 Johnson Controls International PLC
- 18.2.2.1. Overview
- 18.2.2.2. Products
- 18.2.2.3. SWOT Analysis
- 18.2.2.4. Recent Developments
- 18.2.2.5. Financials (Based on Availability)
- 18.2.3 Hainan Drinda Automotive Trim Co Ltd
- 18.2.3.1. Overview
- 18.2.3.2. Products
- 18.2.3.3. SWOT Analysis
- 18.2.3.4. Recent Developments
- 18.2.3.5. Financials (Based on Availability)
- 18.2.4 Visteon Corporation
- 18.2.4.1. Overview
- 18.2.4.2. Products
- 18.2.4.3. SWOT Analysis
- 18.2.4.4. Recent Developments
- 18.2.4.5. Financials (Based on Availability)
- 18.2.5 Fusioncharts
- 18.2.5.1. Overview
- 18.2.5.2. Products
- 18.2.5.3. SWOT Analysis
- 18.2.5.4. Recent Developments
- 18.2.5.5. Financials (Based on Availability)
- 18.2.6 Dongfeng Electronic
- 18.2.6.1. Overview
- 18.2.6.2. Products
- 18.2.6.3. SWOT Analysis
- 18.2.6.4. Recent Developments
- 18.2.6.5. Financials (Based on Availability)
- 18.2.7 Huayu Automotive Systems Co Ltd
- 18.2.7.1. Overview
- 18.2.7.2. Products
- 18.2.7.3. SWOT Analysis
- 18.2.7.4. Recent Developments
- 18.2.7.5. Financials (Based on Availability)
- 18.2.8 Toyoda Gosei Co Ltd
- 18.2.8.1. Overview
- 18.2.8.2. Products
- 18.2.8.3. SWOT Analysis
- 18.2.8.4. Recent Developments
- 18.2.8.5. Financials (Based on Availability)
- 18.2.9 IA
- 18.2.9.1. Overview
- 18.2.9.2. Products
- 18.2.9.3. SWOT Analysis
- 18.2.9.4. Recent Developments
- 18.2.9.5. Financials (Based on Availability)
- 18.2.10 Faurecia SE
- 18.2.10.1. Overview
- 18.2.10.2. Products
- 18.2.10.3. SWOT Analysis
- 18.2.10.4. Recent Developments
- 18.2.10.5. Financials (Based on Availability)
- 18.2.1 ABB Ltd
List of Figures
- Figure 1: Global Automotive Dashboard Market Revenue Breakdown (Million, %) by Region 2024 & 2032
- Figure 2: North America Automotive Dashboard Market Revenue (Million), by Country 2024 & 2032
- Figure 3: North America Automotive Dashboard Market Revenue Share (%), by Country 2024 & 2032
- Figure 4: Europe Automotive Dashboard Market Revenue (Million), by Country 2024 & 2032
- Figure 5: Europe Automotive Dashboard Market Revenue Share (%), by Country 2024 & 2032
- Figure 6: Asia Pacific Automotive Dashboard Market Revenue (Million), by Country 2024 & 2032
- Figure 7: Asia Pacific Automotive Dashboard Market Revenue Share (%), by Country 2024 & 2032
- Figure 8: South America Automotive Dashboard Market Revenue (Million), by Country 2024 & 2032
- Figure 9: South America Automotive Dashboard Market Revenue Share (%), by Country 2024 & 2032
- Figure 10: Middle East Automotive Dashboard Market Revenue (Million), by Country 2024 & 2032
- Figure 11: Middle East Automotive Dashboard Market Revenue Share (%), by Country 2024 & 2032
- Figure 12: United Arab Emirates Automotive Dashboard Market Revenue (Million), by Country 2024 & 2032
- Figure 13: United Arab Emirates Automotive Dashboard Market Revenue Share (%), by Country 2024 & 2032
- Figure 14: North America Automotive Dashboard Market Revenue (Million), by Type 2024 & 2032
- Figure 15: North America Automotive Dashboard Market Revenue Share (%), by Type 2024 & 2032
- Figure 16: North America Automotive Dashboard Market Revenue (Million), by Vehicle Type 2024 & 2032
- Figure 17: North America Automotive Dashboard Market Revenue Share (%), by Vehicle Type 2024 & 2032
- Figure 18: North America Automotive Dashboard Market Revenue (Million), by Sales Channel 2024 & 2032
- Figure 19: North America Automotive Dashboard Market Revenue Share (%), by Sales Channel 2024 & 2032
- Figure 20: North America Automotive Dashboard Market Revenue (Million), by Country 2024 & 2032
- Figure 21: North America Automotive Dashboard Market Revenue Share (%), by Country 2024 & 2032
- Figure 22: Europe Automotive Dashboard Market Revenue (Million), by Type 2024 & 2032
- Figure 23: Europe Automotive Dashboard Market Revenue Share (%), by Type 2024 & 2032
- Figure 24: Europe Automotive Dashboard Market Revenue (Million), by Vehicle Type 2024 & 2032
- Figure 25: Europe Automotive Dashboard Market Revenue Share (%), by Vehicle Type 2024 & 2032
- Figure 26: Europe Automotive Dashboard Market Revenue (Million), by Sales Channel 2024 & 2032
- Figure 27: Europe Automotive Dashboard Market Revenue Share (%), by Sales Channel 2024 & 2032
- Figure 28: Europe Automotive Dashboard Market Revenue (Million), by Country 2024 & 2032
- Figure 29: Europe Automotive Dashboard Market Revenue Share (%), by Country 2024 & 2032
- Figure 30: Asia Pacific Automotive Dashboard Market Revenue (Million), by Type 2024 & 2032
- Figure 31: Asia Pacific Automotive Dashboard Market Revenue Share (%), by Type 2024 & 2032
- Figure 32: Asia Pacific Automotive Dashboard Market Revenue (Million), by Vehicle Type 2024 & 2032
- Figure 33: Asia Pacific Automotive Dashboard Market Revenue Share (%), by Vehicle Type 2024 & 2032
- Figure 34: Asia Pacific Automotive Dashboard Market Revenue (Million), by Sales Channel 2024 & 2032
- Figure 35: Asia Pacific Automotive Dashboard Market Revenue Share (%), by Sales Channel 2024 & 2032
- Figure 36: Asia Pacific Automotive Dashboard Market Revenue (Million), by Country 2024 & 2032
- Figure 37: Asia Pacific Automotive Dashboard Market Revenue Share (%), by Country 2024 & 2032
- Figure 38: South America Automotive Dashboard Market Revenue (Million), by Type 2024 & 2032
- Figure 39: South America Automotive Dashboard Market Revenue Share (%), by Type 2024 & 2032
- Figure 40: South America Automotive Dashboard Market Revenue (Million), by Vehicle Type 2024 & 2032
- Figure 41: South America Automotive Dashboard Market Revenue Share (%), by Vehicle Type 2024 & 2032
- Figure 42: South America Automotive Dashboard Market Revenue (Million), by Sales Channel 2024 & 2032
- Figure 43: South America Automotive Dashboard Market Revenue Share (%), by Sales Channel 2024 & 2032
- Figure 44: South America Automotive Dashboard Market Revenue (Million), by Country 2024 & 2032
- Figure 45: South America Automotive Dashboard Market Revenue Share (%), by Country 2024 & 2032
- Figure 46: Middle East Automotive Dashboard Market Revenue (Million), by Type 2024 & 2032
- Figure 47: Middle East Automotive Dashboard Market Revenue Share (%), by Type 2024 & 2032
- Figure 48: Middle East Automotive Dashboard Market Revenue (Million), by Vehicle Type 2024 & 2032
- Figure 49: Middle East Automotive Dashboard Market Revenue Share (%), by Vehicle Type 2024 & 2032
- Figure 50: Middle East Automotive Dashboard Market Revenue (Million), by Sales Channel 2024 & 2032
- Figure 51: Middle East Automotive Dashboard Market Revenue Share (%), by Sales Channel 2024 & 2032
- Figure 52: Middle East Automotive Dashboard Market Revenue (Million), by Country 2024 & 2032
- Figure 53: Middle East Automotive Dashboard Market Revenue Share (%), by Country 2024 & 2032
- Figure 54: United Arab Emirates Automotive Dashboard Market Revenue (Million), by Type 2024 & 2032
- Figure 55: United Arab Emirates Automotive Dashboard Market Revenue Share (%), by Type 2024 & 2032
- Figure 56: United Arab Emirates Automotive Dashboard Market Revenue (Million), by Vehicle Type 2024 & 2032
- Figure 57: United Arab Emirates Automotive Dashboard Market Revenue Share (%), by Vehicle Type 2024 & 2032
- Figure 58: United Arab Emirates Automotive Dashboard Market Revenue (Million), by Sales Channel 2024 & 2032
- Figure 59: United Arab Emirates Automotive Dashboard Market Revenue Share (%), by Sales Channel 2024 & 2032
- Figure 60: United Arab Emirates Automotive Dashboard Market Revenue (Million), by Country 2024 & 2032
- Figure 61: United Arab Emirates Automotive Dashboard Market Revenue Share (%), by Country 2024 & 2032
List of Tables
- Table 1: Global Automotive Dashboard Market Revenue Million Forecast, by Region 2019 & 2032
- Table 2: Global Automotive Dashboard Market Revenue Million Forecast, by Type 2019 & 2032
- Table 3: Global Automotive Dashboard Market Revenue Million Forecast, by Vehicle Type 2019 & 2032
- Table 4: Global Automotive Dashboard Market Revenue Million Forecast, by Sales Channel 2019 & 2032
- Table 5: Global Automotive Dashboard Market Revenue Million Forecast, by Region 2019 & 2032
- Table 6: Global Automotive Dashboard Market Revenue Million Forecast, by Country 2019 & 2032
- Table 7: United Sates Automotive Dashboard Market Revenue (Million) Forecast, by Application 2019 & 2032
- Table 8: Canada Automotive Dashboard Market Revenue (Million) Forecast, by Application 2019 & 2032
- Table 9: Rest of North America Automotive Dashboard Market Revenue (Million) Forecast, by Application 2019 & 2032
- Table 10: Global Automotive Dashboard Market Revenue Million Forecast, by Country 2019 & 2032
- Table 11: Germany Automotive Dashboard Market Revenue (Million) Forecast, by Application 2019 & 2032
- Table 12: United Kingdom Automotive Dashboard Market Revenue (Million) Forecast, by Application 2019 & 2032
- Table 13: France Automotive Dashboard Market Revenue (Million) Forecast, by Application 2019 & 2032
- Table 14: Russia Automotive Dashboard Market Revenue (Million) Forecast, by Application 2019 & 2032
- Table 15: Rest of Europe Automotive Dashboard Market Revenue (Million) Forecast, by Application 2019 & 2032
- Table 16: Global Automotive Dashboard Market Revenue Million Forecast, by Country 2019 & 2032
- Table 17: India Automotive Dashboard Market Revenue (Million) Forecast, by Application 2019 & 2032
- Table 18: China Automotive Dashboard Market Revenue (Million) Forecast, by Application 2019 & 2032
- Table 19: Japan Automotive Dashboard Market Revenue (Million) Forecast, by Application 2019 & 2032
- Table 20: Rest of Asia Pacific Automotive Dashboard Market Revenue (Million) Forecast, by Application 2019 & 2032
- Table 21: Global Automotive Dashboard Market Revenue Million Forecast, by Country 2019 & 2032
- Table 22: Brazil Automotive Dashboard Market Revenue (Million) Forecast, by Application 2019 & 2032
- Table 23: Argentina Automotive Dashboard Market Revenue (Million) Forecast, by Application 2019 & 2032
- Table 24: Rest of South America Automotive Dashboard Market Revenue (Million) Forecast, by Application 2019 & 2032
- Table 25: Global Automotive Dashboard Market Revenue Million Forecast, by Country 2019 & 2032
- Table 26: Automotive Dashboard Market Revenue (Million) Forecast, by Application 2019 & 2032
- Table 27: Global Automotive Dashboard Market Revenue Million Forecast, by Country 2019 & 2032
- Table 28: Saudi Arabia Automotive Dashboard Market Revenue (Million) Forecast, by Application 2019 & 2032
- Table 29: Rest of Middle East Automotive Dashboard Market Revenue (Million) Forecast, by Application 2019 & 2032
- Table 30: Global Automotive Dashboard Market Revenue Million Forecast, by Type 2019 & 2032
- Table 31: Global Automotive Dashboard Market Revenue Million Forecast, by Vehicle Type 2019 & 2032
- Table 32: Global Automotive Dashboard Market Revenue Million Forecast, by Sales Channel 2019 & 2032
- Table 33: Global Automotive Dashboard Market Revenue Million Forecast, by Country 2019 & 2032
- Table 34: United Sates Automotive Dashboard Market Revenue (Million) Forecast, by Application 2019 & 2032
- Table 35: Canada Automotive Dashboard Market Revenue (Million) Forecast, by Application 2019 & 2032
- Table 36: Rest of North America Automotive Dashboard Market Revenue (Million) Forecast, by Application 2019 & 2032
- Table 37: Global Automotive Dashboard Market Revenue Million Forecast, by Type 2019 & 2032
- Table 38: Global Automotive Dashboard Market Revenue Million Forecast, by Vehicle Type 2019 & 2032
- Table 39: Global Automotive Dashboard Market Revenue Million Forecast, by Sales Channel 2019 & 2032
- Table 40: Global Automotive Dashboard Market Revenue Million Forecast, by Country 2019 & 2032
- Table 41: Germany Automotive Dashboard Market Revenue (Million) Forecast, by Application 2019 & 2032
- Table 42: United Kingdom Automotive Dashboard Market Revenue (Million) Forecast, by Application 2019 & 2032
- Table 43: France Automotive Dashboard Market Revenue (Million) Forecast, by Application 2019 & 2032
- Table 44: Russia Automotive Dashboard Market Revenue (Million) Forecast, by Application 2019 & 2032
- Table 45: Rest of Europe Automotive Dashboard Market Revenue (Million) Forecast, by Application 2019 & 2032
- Table 46: Global Automotive Dashboard Market Revenue Million Forecast, by Type 2019 & 2032
- Table 47: Global Automotive Dashboard Market Revenue Million Forecast, by Vehicle Type 2019 & 2032
- Table 48: Global Automotive Dashboard Market Revenue Million Forecast, by Sales Channel 2019 & 2032
- Table 49: Global Automotive Dashboard Market Revenue Million Forecast, by Country 2019 & 2032
- Table 50: India Automotive Dashboard Market Revenue (Million) Forecast, by Application 2019 & 2032
- Table 51: China Automotive Dashboard Market Revenue (Million) Forecast, by Application 2019 & 2032
- Table 52: Japan Automotive Dashboard Market Revenue (Million) Forecast, by Application 2019 & 2032
- Table 53: Rest of Asia Pacific Automotive Dashboard Market Revenue (Million) Forecast, by Application 2019 & 2032
- Table 54: Global Automotive Dashboard Market Revenue Million Forecast, by Type 2019 & 2032
- Table 55: Global Automotive Dashboard Market Revenue Million Forecast, by Vehicle Type 2019 & 2032
- Table 56: Global Automotive Dashboard Market Revenue Million Forecast, by Sales Channel 2019 & 2032
- Table 57: Global Automotive Dashboard Market Revenue Million Forecast, by Country 2019 & 2032
- Table 58: Brazil Automotive Dashboard Market Revenue (Million) Forecast, by Application 2019 & 2032
- Table 59: Argentina Automotive Dashboard Market Revenue (Million) Forecast, by Application 2019 & 2032
- Table 60: Rest of South America Automotive Dashboard Market Revenue (Million) Forecast, by Application 2019 & 2032
- Table 61: Global Automotive Dashboard Market Revenue Million Forecast, by Type 2019 & 2032
- Table 62: Global Automotive Dashboard Market Revenue Million Forecast, by Vehicle Type 2019 & 2032
- Table 63: Global Automotive Dashboard Market Revenue Million Forecast, by Sales Channel 2019 & 2032
- Table 64: Global Automotive Dashboard Market Revenue Million Forecast, by Country 2019 & 2032
- Table 65: Global Automotive Dashboard Market Revenue Million Forecast, by Type 2019 & 2032
- Table 66: Global Automotive Dashboard Market Revenue Million Forecast, by Vehicle Type 2019 & 2032
- Table 67: Global Automotive Dashboard Market Revenue Million Forecast, by Sales Channel 2019 & 2032
- Table 68: Global Automotive Dashboard Market Revenue Million Forecast, by Country 2019 & 2032
- Table 69: Saudi Arabia Automotive Dashboard Market Revenue (Million) Forecast, by Application 2019 & 2032
- Table 70: Rest of Middle East Automotive Dashboard Market Revenue (Million) Forecast, by Application 2019 & 2032
Frequently Asked Questions
1. What is the projected Compound Annual Growth Rate (CAGR) of the Automotive Dashboard Market?
The projected CAGR is approximately > 7.00%.
2. Which companies are prominent players in the Automotive Dashboard Market?
Key companies in the market include ABB Ltd, Johnson Controls International PLC, Hainan Drinda Automotive Trim Co Ltd, Visteon Corporation, Fusioncharts, Dongfeng Electronic, Huayu Automotive Systems Co Ltd, Toyoda Gosei Co Ltd, IA, Faurecia SE.
3. What are the main segments of the Automotive Dashboard Market?
The market segments include Type, Vehicle Type, Sales Channel.
4. Can you provide details about the market size?
The market size is estimated to be USD XX Million as of 2022.
5. What are some drivers contributing to market growth?
Ease of Steering.
6. What are the notable trends driving market growth?
Technological Developments Creating Demand for LCD Dashboards.
7. Are there any restraints impacting market growth?
Cost and Price Sensitivity.
8. Can you provide examples of recent developments in the market?
N/A
9. What pricing options are available for accessing the report?
Pricing options include single-user, multi-user, and enterprise licenses priced at USD 4750, USD 5250, and USD 8750 respectively.
10. Is the market size provided in terms of value or volume?
The market size is provided in terms of value, measured in Million.
11. Are there any specific market keywords associated with the report?
Yes, the market keyword associated with the report is "Automotive Dashboard Market," which aids in identifying and referencing the specific market segment covered.
12. How do I determine which pricing option suits my needs best?
The pricing options vary based on user requirements and access needs. Individual users may opt for single-user licenses, while businesses requiring broader access may choose multi-user or enterprise licenses for cost-effective access to the report.
13. Are there any additional resources or data provided in the Automotive Dashboard Market report?
While the report offers comprehensive insights, it's advisable to review the specific contents or supplementary materials provided to ascertain if additional resources or data are available.
14. How can I stay updated on further developments or reports in the Automotive Dashboard Market?
To stay informed about further developments, trends, and reports in the Automotive Dashboard Market, consider subscribing to industry newsletters, following relevant companies and organizations, or regularly checking reputable industry news sources and publications.
Methodology
Step 1 - Identification of Relevant Samples Size from Population Database


Step 2 - Approaches for Defining Global Market Size (Value, Volume* & Price*)

Note*: In applicable scenarios
Step 3 - Data Sources
Primary Research
- Web Analytics
- Survey Reports
- Research Institute
- Latest Research Reports
- Opinion Leaders
Secondary Research
- Annual Reports
- White Paper
- Latest Press Release
- Industry Association
- Paid Database
- Investor Presentations

Step 4 - Data Triangulation
Involves using different sources of information in order to increase the validity of a study
These sources are likely to be stakeholders in a program - participants, other researchers, program staff, other community members, and so on.
Then we put all data in single framework & apply various statistical tools to find out the dynamic on the market.
During the analysis stage, feedback from the stakeholder groups would be compared to determine areas of agreement as well as areas of divergence


