


Key Insights
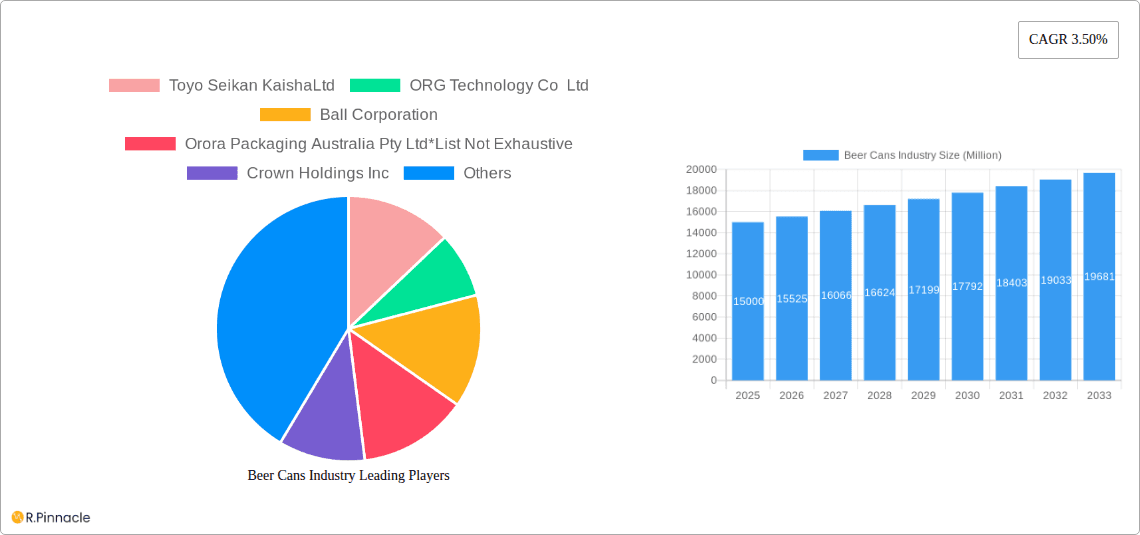
The global beer can market is forecast to reach $65.9 billion by 2025, with a projected Compound Annual Growth Rate (CAGR) of 5.3% through 2033. This expansion is propelled by the rising popularity of craft beers and ready-to-drink (RTD) beverages, with consumers increasingly favoring cans for their portability, lightweight design, and superior recyclability. Technological advancements in can manufacturing, enabling sophisticated designs and enhanced functionality, also contribute to market growth. Key market drivers include evolving consumer preferences for convenient and sustainable packaging solutions. Challenges such as volatile aluminum prices and competition from alternative packaging materials persist, yet the overall market outlook remains robust. Aluminum cans dominate the market, outperforming steel/tin cans due to their inherent lightweight properties and environmental benefits. Leading companies, including Toyo Seikan Kaisha Ltd, Ball Corporation, and Crown Holdings Inc, are actively driving market innovation and strategic growth, particularly in high-potential regions.
Beer Cans Industry Market Size (In Billion)

Regional market dynamics show significant contributions from North America and Europe, owing to mature beer consumption patterns. The Asia-Pacific region is anticipated to experience substantial growth, driven by increasing disposable incomes and evolving consumer tastes in China and India. This region is expected to attract considerable investment in advanced canning infrastructure to meet escalating demand. Latin America and the Middle East also present expansion opportunities, though potentially at a more moderate pace than Asia-Pacific. Sustained growth in the beer can market will hinge on industry players’ ability to adapt to consumer demands, address environmental considerations, and optimize manufacturing for both sustainability and cost-efficiency.

Beer Cans Industry Company Market Share
Beer Cans Industry Market Report: 2019-2033
This comprehensive report provides a detailed analysis of the global beer cans industry, offering invaluable insights for industry professionals, investors, and strategic decision-makers. With a study period spanning 2019-2033, a base year of 2025, and a forecast period of 2025-2033, this report delivers a robust understanding of current market dynamics and future growth trajectories. The report incorporates detailed financial projections, including market size estimations in Millions, and identifies key trends shaping the industry's evolution.
Beer Cans Industry Market Structure & Innovation Trends
The beer cans industry is characterized by a moderately consolidated market structure, with key players holding significant market share. While precise market share figures for each company are proprietary, major players like Ball Corporation and Crown Holdings Inc. command substantial portions of the global market. Mergers and acquisitions (M&A) activity has played a role in shaping this structure, with deal values reaching into the hundreds of Millions in recent years. The industry is driven by innovation in materials science, focusing on lightweighting and recyclability. Stringent regulatory frameworks, particularly regarding sustainability and environmental impact, are increasingly influencing manufacturing processes and product design. Aluminum cans currently dominate the market due to their lightweight, recyclable nature and superior barrier properties compared to steel/tin cans. However, technological advancements in steel/tin can production could potentially reshape the competitive landscape.
- Key Players: Ball Corporation, Crown Holdings Inc., Toyo Seikan Kaisha Ltd., Can-Pack S.A., and others.
- Innovation Drivers: Lightweighting, recyclability, sustainable materials.
- M&A Activity: Significant activity in recent years, with deal values in the xx Million range annually (estimated).
- Regulatory Framework: Growing emphasis on sustainability and environmental regulations.
- End-User Demographics: Primarily driven by beer consumption trends across various regions.
Beer Cans Industry Market Dynamics & Trends
The global beer cans market is experiencing robust growth, driven by several key factors. Rising beer consumption, particularly in developing economies, is fueling demand. Technological advancements, such as improved can manufacturing processes and the use of more sustainable materials, are also contributing to market expansion. The CAGR for the forecast period (2025-2033) is estimated to be xx%, while market penetration is expected to reach xx% by 2033 in key regions. Consumer preferences are shifting towards more sustainable and convenient packaging options, further benefiting aluminum cans due to their recyclability. Competitive dynamics are shaped by innovation in product design, pricing strategies, and branding efforts. Technological disruptions are focused on enhancing production efficiency, reducing environmental footprint, and improving product quality and aesthetics.
Dominant Regions & Segments in Beer Cans Industry
The North American and European markets currently dominate the beer cans industry, driven by high beer consumption rates and established manufacturing infrastructure. Within product types, aluminum cans represent the largest segment, holding a market share of approximately xx%.
- Key Drivers in North America & Europe:
- Established brewing industries and high beer consumption.
- Robust infrastructure and advanced manufacturing capabilities.
- Stringent environmental regulations that promote sustainable packaging.
- Aluminum Can Dominance: Superior recyclability, lightweight nature, and excellent barrier properties.
- Steel/Tin Can Segment: Holds a smaller but growing market share, primarily driven by cost competitiveness in certain regions.
Beer Cans Industry Product Innovations
Recent product innovations focus on lightweighting, improved recyclability, and enhanced aesthetics. Companies are investing in advanced manufacturing technologies to reduce material usage and improve production efficiency. The introduction of infinitely recyclable aluminum cups by Ball Corporation highlights the industry's commitment to sustainability. These innovations contribute to the industry's positive environmental footprint, further reinforcing consumer preference for this type of packaging.
Report Scope & Segmentation Analysis
This report segments the beer cans market by product type:
Aluminum Cans: This segment is expected to witness significant growth driven by its sustainability profile and superior barrier properties. The market size is estimated to be xx Million in 2025, with a projected growth of xx% during the forecast period. Competitive dynamics are intense due to the large number of players in the market.
Steel/Tin Cans: This segment is relatively smaller compared to aluminum cans, yet its cost competitiveness offers potential for growth in price-sensitive markets. The market size is projected to be xx Million in 2025, with a projected growth rate of xx% during the forecast period.
Key Drivers of Beer Cans Industry Growth
Several factors are driving the growth of the beer cans industry:
- Increasing Beer Consumption: Global beer consumption is rising, particularly in developing economies.
- Technological Advancements: Lightweighting and improved recyclability of cans enhance efficiency and sustainability.
- Sustainability Concerns: Growing consumer preference for eco-friendly packaging solutions.
- Favorable Regulatory Environment: In several countries, supportive regulations encourage the use of recyclable packaging materials.
Challenges in the Beer Cans Industry Sector
The beer cans industry faces several challenges:
- Fluctuating Raw Material Prices: Aluminum and steel prices affect production costs, impacting profitability.
- Supply Chain Disruptions: Global supply chain issues can impact production and delivery timelines.
- Intense Competition: The market is highly competitive, requiring companies to innovate constantly.
- Environmental Regulations: Compliance with increasingly stringent environmental regulations requires significant investment.
Emerging Opportunities in Beer Cans Industry
The beer cans industry presents several emerging opportunities:
- Growth in Developing Markets: Expanding beer consumption in developing countries presents significant growth potential.
- Sustainable Packaging Solutions: The focus on sustainable packaging creates demand for innovative, environmentally-friendly can designs and materials.
- Premiumization of Beer Cans: The rising demand for premium beer varieties is driving the development of high-quality cans with enhanced aesthetics and functional features.
Leading Players in the Beer Cans Industry Market
- Toyo Seikan Kaisha Ltd
- ORG Technology Co Ltd
- Ball Corporation
- Orora Packaging Australia Pty Ltd
- Crown Holdings Inc
- Shenzhen Xin Yuheng Can Co Ltd
- Kaufman Container
- Daiwa Can Co
- Can-Pack S.A
Key Developments in Beer Cans Industry
- September 2022: Crown Holdings, Inc. announced a 4% global average reduction in the weight of its standard 12 oz. (330 ml) cans, improving recyclability and reducing GHG emissions.
- October 2022: Ball Corporation expanded its infinitely recyclable aluminum cup portfolio with the launch of two smaller sizes (9-ounce and 12-ounce), made with 90% recycled content.
Future Outlook for Beer Cans Industry Market
The future of the beer cans industry appears promising, driven by continued growth in beer consumption, technological advancements in sustainable packaging solutions, and the increasing adoption of recyclable materials. Strategic opportunities exist for companies that can effectively leverage these trends by investing in innovative technologies and sustainable practices. The market is poised for continued expansion, driven by a growing global population, evolving consumer preferences, and the industry's commitment to environmental sustainability.
Beer Cans Industry Segmentation
-
1. Product Type
- 1.1. Aluminum Can
- 1.2. Steel/Tin Can
Beer Cans Industry Segmentation By Geography
-
1. North America
- 1.1. United States
- 1.2. Canada
-
2. Europe
- 2.1. Germany
- 2.2. France
- 2.3. United Kingdom
- 2.4. Spain
- 2.5. Rest of Europe
-
3. Asia Pacific
- 3.1. China
- 3.2. Japan
- 3.3. India
- 3.4. Australia
- 3.5. Rest of Asia Pacific
-
4. Latin America
- 4.1. Brazil
- 4.2. Rest of Latin America
- 5. Middle East
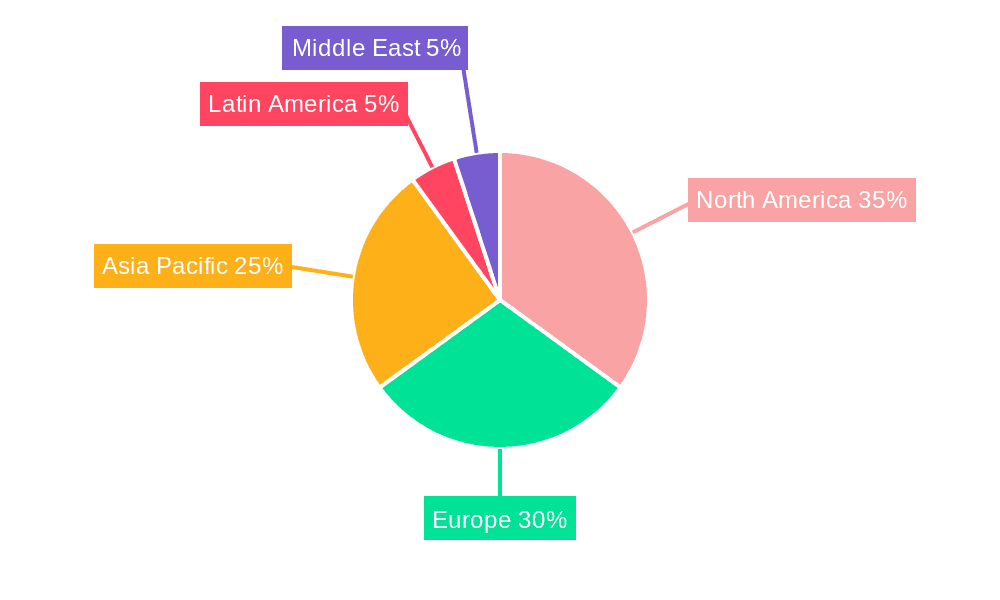
Beer Cans Industry Regional Market Share
Geographic Coverage of Beer Cans Industry
Beer Cans Industry REPORT HIGHLIGHTS
| Aspects | Details |
|---|---|
| Study Period | 2020-2034 |
| Base Year | 2025 |
| Estimated Year | 2026 |
| Forecast Period | 2026-2034 |
| Historical Period | 2020-2025 |
| Growth Rate | CAGR of 5.3% from 2020-2034 |
| Segmentation |
|
Table of Contents
- 1. Introduction
- 1.1. Research Scope
- 1.2. Market Segmentation
- 1.3. Research Methodology
- 1.4. Definitions and Assumptions
- 2. Executive Summary
- 2.1. Introduction
- 3. Market Dynamics
- 3.1. Introduction
- 3.2. Market Drivers
- 3.2.1. Growing Consumption of Craft Beer Across Various Regions; Recreational and Environmental Benefits
- 3.3. Market Restrains
- 3.3.1. Changing Consumer Preferences
- 3.4. Market Trends
- 3.4.1. Aluminium is Expected to Hold the Largest Market Share
- 4. Market Factor Analysis
- 4.1. Porters Five Forces
- 4.2. Supply/Value Chain
- 4.3. PESTEL analysis
- 4.4. Market Entropy
- 4.5. Patent/Trademark Analysis
- 5. Global Beer Cans Industry Analysis, Insights and Forecast, 2020-2032
- 5.1. Market Analysis, Insights and Forecast - by Product Type
- 5.1.1. Aluminum Can
- 5.1.2. Steel/Tin Can
- 5.2. Market Analysis, Insights and Forecast - by Region
- 5.2.1. North America
- 5.2.2. Europe
- 5.2.3. Asia Pacific
- 5.2.4. Latin America
- 5.2.5. Middle East
- 5.1. Market Analysis, Insights and Forecast - by Product Type
- 6. North America Beer Cans Industry Analysis, Insights and Forecast, 2020-2032
- 6.1. Market Analysis, Insights and Forecast - by Product Type
- 6.1.1. Aluminum Can
- 6.1.2. Steel/Tin Can
- 6.1. Market Analysis, Insights and Forecast - by Product Type
- 7. Europe Beer Cans Industry Analysis, Insights and Forecast, 2020-2032
- 7.1. Market Analysis, Insights and Forecast - by Product Type
- 7.1.1. Aluminum Can
- 7.1.2. Steel/Tin Can
- 7.1. Market Analysis, Insights and Forecast - by Product Type
- 8. Asia Pacific Beer Cans Industry Analysis, Insights and Forecast, 2020-2032
- 8.1. Market Analysis, Insights and Forecast - by Product Type
- 8.1.1. Aluminum Can
- 8.1.2. Steel/Tin Can
- 8.1. Market Analysis, Insights and Forecast - by Product Type
- 9. Latin America Beer Cans Industry Analysis, Insights and Forecast, 2020-2032
- 9.1. Market Analysis, Insights and Forecast - by Product Type
- 9.1.1. Aluminum Can
- 9.1.2. Steel/Tin Can
- 9.1. Market Analysis, Insights and Forecast - by Product Type
- 10. Middle East Beer Cans Industry Analysis, Insights and Forecast, 2020-2032
- 10.1. Market Analysis, Insights and Forecast - by Product Type
- 10.1.1. Aluminum Can
- 10.1.2. Steel/Tin Can
- 10.1. Market Analysis, Insights and Forecast - by Product Type
- 11. Competitive Analysis
- 11.1. Global Market Share Analysis 2025
- 11.2. Company Profiles
- 11.2.1 Toyo Seikan KaishaLtd
- 11.2.1.1. Overview
- 11.2.1.2. Products
- 11.2.1.3. SWOT Analysis
- 11.2.1.4. Recent Developments
- 11.2.1.5. Financials (Based on Availability)
- 11.2.2 ORG Technology Co Ltd
- 11.2.2.1. Overview
- 11.2.2.2. Products
- 11.2.2.3. SWOT Analysis
- 11.2.2.4. Recent Developments
- 11.2.2.5. Financials (Based on Availability)
- 11.2.3 Ball Corporation
- 11.2.3.1. Overview
- 11.2.3.2. Products
- 11.2.3.3. SWOT Analysis
- 11.2.3.4. Recent Developments
- 11.2.3.5. Financials (Based on Availability)
- 11.2.4 Orora Packaging Australia Pty Ltd*List Not Exhaustive
- 11.2.4.1. Overview
- 11.2.4.2. Products
- 11.2.4.3. SWOT Analysis
- 11.2.4.4. Recent Developments
- 11.2.4.5. Financials (Based on Availability)
- 11.2.5 Crown Holdings Inc
- 11.2.5.1. Overview
- 11.2.5.2. Products
- 11.2.5.3. SWOT Analysis
- 11.2.5.4. Recent Developments
- 11.2.5.5. Financials (Based on Availability)
- 11.2.6 Shenzhen Xin Yuheng Can Co Ltd
- 11.2.6.1. Overview
- 11.2.6.2. Products
- 11.2.6.3. SWOT Analysis
- 11.2.6.4. Recent Developments
- 11.2.6.5. Financials (Based on Availability)
- 11.2.7 Kaufman Container
- 11.2.7.1. Overview
- 11.2.7.2. Products
- 11.2.7.3. SWOT Analysis
- 11.2.7.4. Recent Developments
- 11.2.7.5. Financials (Based on Availability)
- 11.2.8 Daiwa Can Co
- 11.2.8.1. Overview
- 11.2.8.2. Products
- 11.2.8.3. SWOT Analysis
- 11.2.8.4. Recent Developments
- 11.2.8.5. Financials (Based on Availability)
- 11.2.9 Can-Pack S A
- 11.2.9.1. Overview
- 11.2.9.2. Products
- 11.2.9.3. SWOT Analysis
- 11.2.9.4. Recent Developments
- 11.2.9.5. Financials (Based on Availability)
- 11.2.1 Toyo Seikan KaishaLtd
List of Figures
- Figure 1: Global Beer Cans Industry Revenue Breakdown (billion, %) by Region 2025 & 2033
- Figure 2: North America Beer Cans Industry Revenue (billion), by Product Type 2025 & 2033
- Figure 3: North America Beer Cans Industry Revenue Share (%), by Product Type 2025 & 2033
- Figure 4: North America Beer Cans Industry Revenue (billion), by Country 2025 & 2033
- Figure 5: North America Beer Cans Industry Revenue Share (%), by Country 2025 & 2033
- Figure 6: Europe Beer Cans Industry Revenue (billion), by Product Type 2025 & 2033
- Figure 7: Europe Beer Cans Industry Revenue Share (%), by Product Type 2025 & 2033
- Figure 8: Europe Beer Cans Industry Revenue (billion), by Country 2025 & 2033
- Figure 9: Europe Beer Cans Industry Revenue Share (%), by Country 2025 & 2033
- Figure 10: Asia Pacific Beer Cans Industry Revenue (billion), by Product Type 2025 & 2033
- Figure 11: Asia Pacific Beer Cans Industry Revenue Share (%), by Product Type 2025 & 2033
- Figure 12: Asia Pacific Beer Cans Industry Revenue (billion), by Country 2025 & 2033
- Figure 13: Asia Pacific Beer Cans Industry Revenue Share (%), by Country 2025 & 2033
- Figure 14: Latin America Beer Cans Industry Revenue (billion), by Product Type 2025 & 2033
- Figure 15: Latin America Beer Cans Industry Revenue Share (%), by Product Type 2025 & 2033
- Figure 16: Latin America Beer Cans Industry Revenue (billion), by Country 2025 & 2033
- Figure 17: Latin America Beer Cans Industry Revenue Share (%), by Country 2025 & 2033
- Figure 18: Middle East Beer Cans Industry Revenue (billion), by Product Type 2025 & 2033
- Figure 19: Middle East Beer Cans Industry Revenue Share (%), by Product Type 2025 & 2033
- Figure 20: Middle East Beer Cans Industry Revenue (billion), by Country 2025 & 2033
- Figure 21: Middle East Beer Cans Industry Revenue Share (%), by Country 2025 & 2033
List of Tables
- Table 1: Global Beer Cans Industry Revenue billion Forecast, by Product Type 2020 & 2033
- Table 2: Global Beer Cans Industry Revenue billion Forecast, by Region 2020 & 2033
- Table 3: Global Beer Cans Industry Revenue billion Forecast, by Product Type 2020 & 2033
- Table 4: Global Beer Cans Industry Revenue billion Forecast, by Country 2020 & 2033
- Table 5: United States Beer Cans Industry Revenue (billion) Forecast, by Application 2020 & 2033
- Table 6: Canada Beer Cans Industry Revenue (billion) Forecast, by Application 2020 & 2033
- Table 7: Global Beer Cans Industry Revenue billion Forecast, by Product Type 2020 & 2033
- Table 8: Global Beer Cans Industry Revenue billion Forecast, by Country 2020 & 2033
- Table 9: Germany Beer Cans Industry Revenue (billion) Forecast, by Application 2020 & 2033
- Table 10: France Beer Cans Industry Revenue (billion) Forecast, by Application 2020 & 2033
- Table 11: United Kingdom Beer Cans Industry Revenue (billion) Forecast, by Application 2020 & 2033
- Table 12: Spain Beer Cans Industry Revenue (billion) Forecast, by Application 2020 & 2033
- Table 13: Rest of Europe Beer Cans Industry Revenue (billion) Forecast, by Application 2020 & 2033
- Table 14: Global Beer Cans Industry Revenue billion Forecast, by Product Type 2020 & 2033
- Table 15: Global Beer Cans Industry Revenue billion Forecast, by Country 2020 & 2033
- Table 16: China Beer Cans Industry Revenue (billion) Forecast, by Application 2020 & 2033
- Table 17: Japan Beer Cans Industry Revenue (billion) Forecast, by Application 2020 & 2033
- Table 18: India Beer Cans Industry Revenue (billion) Forecast, by Application 2020 & 2033
- Table 19: Australia Beer Cans Industry Revenue (billion) Forecast, by Application 2020 & 2033
- Table 20: Rest of Asia Pacific Beer Cans Industry Revenue (billion) Forecast, by Application 2020 & 2033
- Table 21: Global Beer Cans Industry Revenue billion Forecast, by Product Type 2020 & 2033
- Table 22: Global Beer Cans Industry Revenue billion Forecast, by Country 2020 & 2033
- Table 23: Brazil Beer Cans Industry Revenue (billion) Forecast, by Application 2020 & 2033
- Table 24: Rest of Latin America Beer Cans Industry Revenue (billion) Forecast, by Application 2020 & 2033
- Table 25: Global Beer Cans Industry Revenue billion Forecast, by Product Type 2020 & 2033
- Table 26: Global Beer Cans Industry Revenue billion Forecast, by Country 2020 & 2033
Frequently Asked Questions
1. What is the projected Compound Annual Growth Rate (CAGR) of the Beer Cans Industry?
The projected CAGR is approximately 5.3%.
2. Which companies are prominent players in the Beer Cans Industry?
Key companies in the market include Toyo Seikan KaishaLtd, ORG Technology Co Ltd, Ball Corporation, Orora Packaging Australia Pty Ltd*List Not Exhaustive, Crown Holdings Inc, Shenzhen Xin Yuheng Can Co Ltd, Kaufman Container, Daiwa Can Co, Can-Pack S A.
3. What are the main segments of the Beer Cans Industry?
The market segments include Product Type.
4. Can you provide details about the market size?
The market size is estimated to be USD 65.9 billion as of 2022.
5. What are some drivers contributing to market growth?
Growing Consumption of Craft Beer Across Various Regions; Recreational and Environmental Benefits.
6. What are the notable trends driving market growth?
Aluminium is Expected to Hold the Largest Market Share.
7. Are there any restraints impacting market growth?
Changing Consumer Preferences.
8. Can you provide examples of recent developments in the market?
October 2022 - Ball Corporation announced the portfolio expansion of its infinitely recyclable ball aluminum cup with the launch of two new, smaller sizes (9-ounce and 12-ounce cup sizes). The Ball Aluminum Cup available for food service customers is now composed of 90% recycled content, making it the cup with the highest recycled content rate of any beverage packaging in its category.
9. What pricing options are available for accessing the report?
Pricing options include single-user, multi-user, and enterprise licenses priced at USD 4750, USD 5250, and USD 8750 respectively.
10. Is the market size provided in terms of value or volume?
The market size is provided in terms of value, measured in billion.
11. Are there any specific market keywords associated with the report?
Yes, the market keyword associated with the report is "Beer Cans Industry," which aids in identifying and referencing the specific market segment covered.
12. How do I determine which pricing option suits my needs best?
The pricing options vary based on user requirements and access needs. Individual users may opt for single-user licenses, while businesses requiring broader access may choose multi-user or enterprise licenses for cost-effective access to the report.
13. Are there any additional resources or data provided in the Beer Cans Industry report?
While the report offers comprehensive insights, it's advisable to review the specific contents or supplementary materials provided to ascertain if additional resources or data are available.
14. How can I stay updated on further developments or reports in the Beer Cans Industry?
To stay informed about further developments, trends, and reports in the Beer Cans Industry, consider subscribing to industry newsletters, following relevant companies and organizations, or regularly checking reputable industry news sources and publications.
Methodology
Step 1 - Identification of Relevant Samples Size from Population Database


Step 2 - Approaches for Defining Global Market Size (Value, Volume* & Price*)

Note*: In applicable scenarios
Step 3 - Data Sources
Primary Research
- Web Analytics
- Survey Reports
- Research Institute
- Latest Research Reports
- Opinion Leaders
Secondary Research
- Annual Reports
- White Paper
- Latest Press Release
- Industry Association
- Paid Database
- Investor Presentations

Step 4 - Data Triangulation
Involves using different sources of information in order to increase the validity of a study
These sources are likely to be stakeholders in a program - participants, other researchers, program staff, other community members, and so on.
Then we put all data in single framework & apply various statistical tools to find out the dynamic on the market.
During the analysis stage, feedback from the stakeholder groups would be compared to determine areas of agreement as well as areas of divergence