
Key Insights
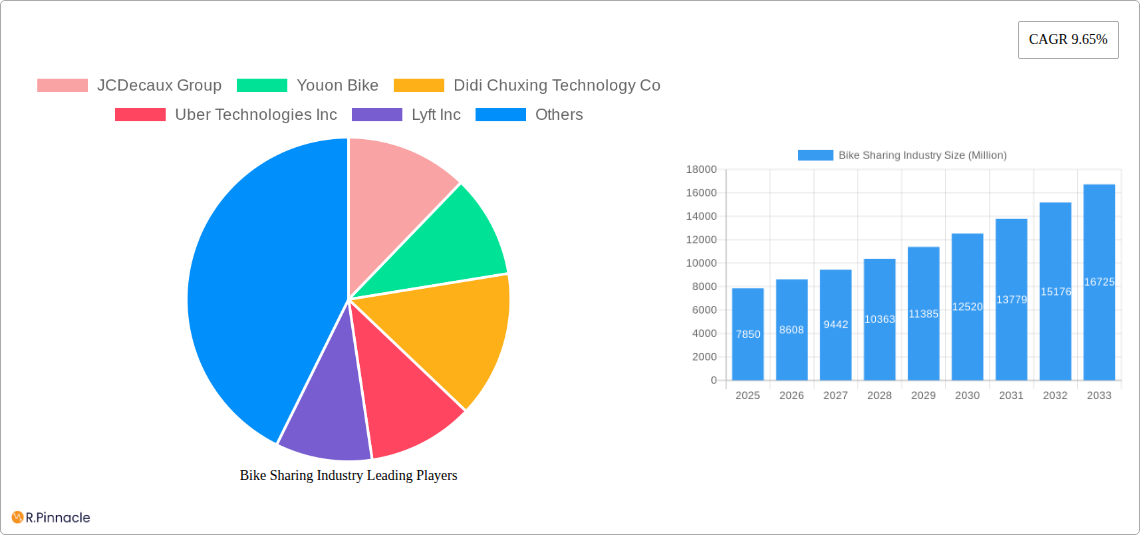
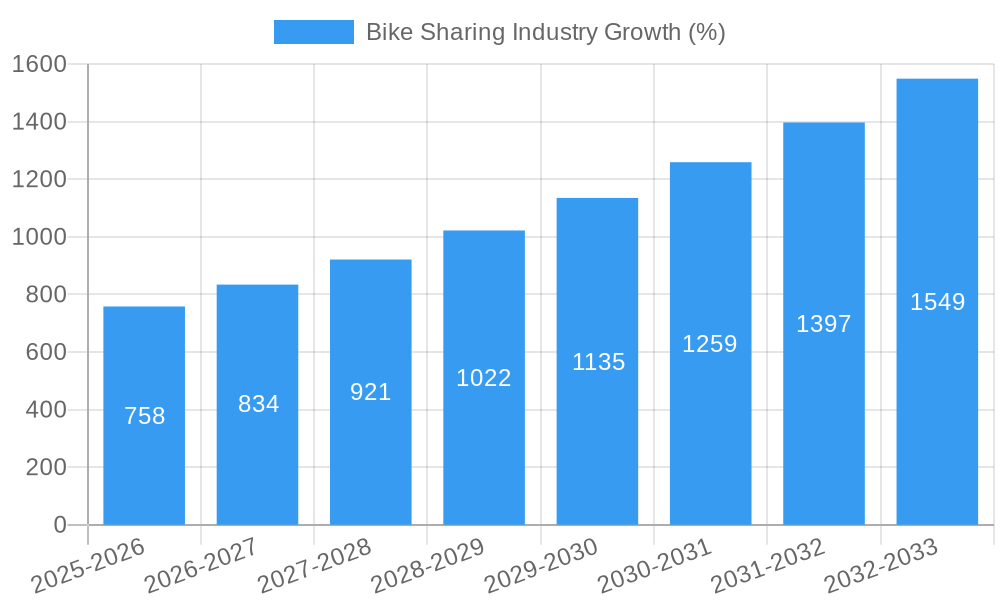
The global bike-sharing market, valued at $7.85 billion in 2025, is projected to experience robust growth, driven by increasing urbanization, rising environmental concerns, and the growing popularity of micro-mobility solutions. The market's Compound Annual Growth Rate (CAGR) of 9.65% from 2025 to 2033 indicates significant expansion potential. Key growth drivers include the increasing adoption of electric bikes (e-bikes) offering longer ranges and faster speeds, the convenience of dockless systems allowing for spontaneous pick-up and drop-off, and supportive government initiatives promoting sustainable transportation. Technological advancements, such as improved GPS tracking, enhanced app functionalities, and smart locking mechanisms, further enhance the user experience and contribute to market growth. However, challenges remain, including vandalism, bike theft, and the need for robust infrastructure to support large-scale bike-sharing programs. The market is segmented into traditional bikes, e-bikes, and sharing systems (docked and dockless), with e-bikes and dockless systems expected to witness the highest growth rates due to their enhanced functionality and convenience. Leading companies like JCDecaux Group, Didi Chuxing, and Uber are actively shaping the market landscape through innovative technologies and strategic expansions. Regional variations in market penetration exist, with Asia Pacific anticipated to hold the largest market share due to its high population density and increasing adoption of shared mobility services.
The competitive landscape is dynamic, with established players and emerging startups constantly vying for market share. The success of individual companies hinges on factors such as efficient operations, effective marketing strategies, strategic partnerships, and the ability to adapt to evolving consumer preferences and technological advancements. Future growth will likely be influenced by factors like the development of integrated multimodal transportation systems, advancements in battery technology for e-bikes, and the integration of bike-sharing services with other mobility options. The increasing awareness of health and fitness benefits further fuels the growth of this market, driving adoption across diverse demographics. Addressing operational challenges and ensuring the long-term sustainability of these programs will be crucial for the market's continued success.
Bike Sharing Industry Market Report: 2019-2033
This comprehensive report provides a detailed analysis of the global bike-sharing industry, covering the period from 2019 to 2033. It offers invaluable insights into market dynamics, technological advancements, competitive landscapes, and future growth prospects, making it an essential resource for industry professionals, investors, and strategists. The report utilizes a robust methodology, incorporating historical data (2019-2024), base year estimations (2025), and forecast projections (2025-2033). Key players like JCDecaux Group, Youon Bike, Didi Chuxing, Uber, Lyft, and others are analyzed to provide a holistic view of this rapidly evolving market. The report projects a market valued at xx Million by 2033, showcasing significant growth potential.
Bike Sharing Industry Market Structure & Innovation Trends
This section analyzes the competitive landscape of the bike-sharing market, encompassing market concentration, innovation drivers, regulatory frameworks, and significant M&A activities. The global bike-sharing market is characterized by a mix of large multinational corporations and smaller, regional players. Market share is currently dominated by a few key players, with JCDecaux Group holding a significant portion, estimated at xx%. However, the market displays considerable fragmentation, particularly in emerging markets.
- Market Concentration: High concentration in developed markets, fragmented in developing regions.
- Innovation Drivers: Technological advancements (e.g., e-bikes, smart locking systems), evolving consumer preferences (sustainability, convenience), and government initiatives promoting micromobility.
- Regulatory Frameworks: Vary widely across regions, impacting operational costs and market entry barriers. Regulations concerning permits, insurance, and safety standards differ significantly.
- Product Substitutes: Other forms of micromobility (e-scooters, e-mopeds), public transportation, and private vehicles.
- End-User Demographics: Primarily young adults and urban professionals, with growing adoption among older demographics.
- M&A Activities: Significant M&A activity observed in the historical period (2019-2024), with deal values exceeding xx Million in aggregate. Consolidation is expected to continue.
Bike Sharing Industry Market Dynamics & Trends
This section delves into the key drivers influencing market growth, technological disruptions shaping the industry, and evolving consumer preferences. The global bike-sharing market exhibits a robust Compound Annual Growth Rate (CAGR) of xx% during the forecast period (2025-2033). This growth is primarily driven by increasing urbanization, rising environmental concerns, and the growing popularity of shared mobility services. Technological advancements, such as the introduction of e-bikes and improved GPS tracking, are further fueling market expansion. Market penetration is expected to reach xx% in key urban centers by 2033. Competitive dynamics are characterized by intense competition, particularly among providers of dockless e-bike services.
Dominant Regions & Segments in Bike Sharing Industry
This section identifies the leading regions and segments within the bike-sharing market. Asia-Pacific currently represents the largest market share, driven by factors such as high population density, increasing urbanization, and supportive government policies.
- Dominant Region: Asia-Pacific (China, India, etc.)
- Dominant Bike Type: E-bikes are experiencing faster growth compared to traditional bikes, due to increased range and convenience.
- Dominant Sharing System: Dockless systems are gaining popularity over docked systems, offering greater flexibility and convenience for users.
Key Drivers for Asia-Pacific Dominance:
- High population density: Providing a large potential customer base.
- Rapid urbanization: Increasing demand for efficient and sustainable transportation solutions.
- Government support: Initiatives promoting micromobility and sustainable urban development.
The European and North American markets are also experiencing significant growth, albeit at a slower pace than Asia-Pacific.
Bike Sharing Industry Product Innovations
Recent product innovations have focused on enhancing user experience, expanding service offerings, and improving operational efficiency. This includes the development of e-bikes with advanced features like improved battery life and integrated GPS tracking, along with the introduction of smart locking systems that enhance security and streamline operations. These innovations are aimed at improving market fit and expanding the appeal of bike-sharing services to a broader range of users, including those with longer commutes or specific accessibility requirements.
Report Scope & Segmentation Analysis
This report segments the bike-sharing market based on bike type (traditional/regular bikes and e-bikes) and sharing system (docked and dockless).
Bike Type:
- Traditional/Regular Bikes: This segment is projected to exhibit steady growth, driven by cost-effectiveness and simplicity.
- E-bikes: This rapidly expanding segment is expected to contribute significantly to the overall market growth due to increasing consumer demand for enhanced convenience and longer ranges.
Sharing System:
- Docked Systems: While declining in market share, docked systems still hold significance in certain areas with established infrastructure.
- Dockless Systems: The dominant segment, offering greater flexibility and user convenience, is experiencing rapid expansion.
Key Drivers of Bike Sharing Industry Growth
The bike-sharing industry's growth is fueled by several key factors:
- Technological advancements: Development of e-bikes, improved GPS tracking, and smart locking systems.
- Government initiatives: Policies promoting micromobility, sustainable transportation, and urban development.
- Rising environmental awareness: Growing preference for eco-friendly transportation options.
- Increasing urbanization: Demand for efficient last-mile connectivity solutions in densely populated urban areas.
Challenges in the Bike Sharing Industry Sector
The bike-sharing industry faces several challenges:
- Regulatory hurdles: Varying regulations across regions create operational complexities and costs.
- Supply chain disruptions: Impacts the availability of bikes and components, leading to potential service interruptions.
- Intense competition: The market is highly competitive, putting pressure on pricing and profitability.
- Vandalism and theft: Losses due to theft and damage contribute to operational costs.
Emerging Opportunities in Bike Sharing Industry
Emerging opportunities include:
- Expansion into new markets: Untapped potential in developing countries with growing urbanization.
- Integration with other mobility services: Creating seamless multi-modal transportation options.
- Subscription models: Offering flexible and affordable access to bike-sharing services.
- Data-driven optimization: Improving service efficiency through advanced analytics.
Leading Players in the Bike Sharing Industry Market
- JCDecaux Group
- Youon Bike
- Didi Chuxing Technology Co
- Uber Technologies Inc
- Lyft Inc
- Bluegogo
- Hellobike
- Meituan Bik
- Bird Rides Inc
- Neutron Holdings Inc
Key Developments in Bike Sharing Industry
- March 2023: MYBYK launched two electric bicycle variants, impacting the e-bike segment and last-mile delivery solutions.
- March 2023: Brighton and Hove launched a bike-sharing scheme with Beryl, expanding service availability in the UK.
- December 2023: USD 23 Million investment in Tembici boosts Latin American expansion of bike-sharing services.
Future Outlook for Bike Sharing Industry Market
The bike-sharing industry is poised for continued growth, driven by technological advancements, supportive government policies, and increasing consumer demand for sustainable transportation. Strategic opportunities lie in expanding into new markets, integrating with other mobility services, and developing innovative business models to enhance user experience and profitability. The market is expected to experience sustained growth, with a significant increase in market size and penetration over the next decade.
Bike Sharing Industry Segmentation
-
1. Bike
- 1.1. Traditional/Regular Bike
- 1.2. E-bike
-
2. Sharing System
- 2.1. Docked
- 2.2. Dockless
Bike Sharing Industry Segmentation By Geography
- 1. North America
- 2. Europe
- 3. Asia Pacific
- 4. Rest of the World

Bike Sharing Industry REPORT HIGHLIGHTS
| Aspects | Details |
|---|---|
| Study Period | 2019-2033 |
| Base Year | 2024 |
| Estimated Year | 2025 |
| Forecast Period | 2025-2033 |
| Historical Period | 2019-2024 |
| Growth Rate | CAGR of 9.65% from 2019-2033 |
| Segmentation |
|
Table of Contents
- 1. Introduction
- 1.1. Research Scope
- 1.2. Market Segmentation
- 1.3. Research Methodology
- 1.4. Definitions and Assumptions
- 2. Executive Summary
- 2.1. Introduction
- 3. Market Dynamics
- 3.1. Introduction
- 3.2. Market Drivers
- 3.2.1. Increasing Inclusion of E-bikes in the Sharing Fleet
- 3.3. Market Restrains
- 3.3.1. Limited Infrastructure May Hinder Market Growth
- 3.4. Market Trends
- 3.4.1. E-bike Segment Expected to be the Fastest-growing Segment Over the Forecast Period
- 4. Market Factor Analysis
- 4.1. Porters Five Forces
- 4.2. Supply/Value Chain
- 4.3. PESTEL analysis
- 4.4. Market Entropy
- 4.5. Patent/Trademark Analysis
- 5. Global Bike Sharing Industry Analysis, Insights and Forecast, 2019-2031
- 5.1. Market Analysis, Insights and Forecast - by Bike
- 5.1.1. Traditional/Regular Bike
- 5.1.2. E-bike
- 5.2. Market Analysis, Insights and Forecast - by Sharing System
- 5.2.1. Docked
- 5.2.2. Dockless
- 5.3. Market Analysis, Insights and Forecast - by Region
- 5.3.1. North America
- 5.3.2. Europe
- 5.3.3. Asia Pacific
- 5.3.4. Rest of the World
- 5.1. Market Analysis, Insights and Forecast - by Bike
- 6. North America Bike Sharing Industry Analysis, Insights and Forecast, 2019-2031
- 6.1. Market Analysis, Insights and Forecast - by Bike
- 6.1.1. Traditional/Regular Bike
- 6.1.2. E-bike
- 6.2. Market Analysis, Insights and Forecast - by Sharing System
- 6.2.1. Docked
- 6.2.2. Dockless
- 6.1. Market Analysis, Insights and Forecast - by Bike
- 7. Europe Bike Sharing Industry Analysis, Insights and Forecast, 2019-2031
- 7.1. Market Analysis, Insights and Forecast - by Bike
- 7.1.1. Traditional/Regular Bike
- 7.1.2. E-bike
- 7.2. Market Analysis, Insights and Forecast - by Sharing System
- 7.2.1. Docked
- 7.2.2. Dockless
- 7.1. Market Analysis, Insights and Forecast - by Bike
- 8. Asia Pacific Bike Sharing Industry Analysis, Insights and Forecast, 2019-2031
- 8.1. Market Analysis, Insights and Forecast - by Bike
- 8.1.1. Traditional/Regular Bike
- 8.1.2. E-bike
- 8.2. Market Analysis, Insights and Forecast - by Sharing System
- 8.2.1. Docked
- 8.2.2. Dockless
- 8.1. Market Analysis, Insights and Forecast - by Bike
- 9. Rest of the World Bike Sharing Industry Analysis, Insights and Forecast, 2019-2031
- 9.1. Market Analysis, Insights and Forecast - by Bike
- 9.1.1. Traditional/Regular Bike
- 9.1.2. E-bike
- 9.2. Market Analysis, Insights and Forecast - by Sharing System
- 9.2.1. Docked
- 9.2.2. Dockless
- 9.1. Market Analysis, Insights and Forecast - by Bike
- 10. North America Bike Sharing Industry Analysis, Insights and Forecast, 2019-2031
- 10.1. Market Analysis, Insights and Forecast - By Country/Sub-region
- 10.1.1.
- 11. Europe Bike Sharing Industry Analysis, Insights and Forecast, 2019-2031
- 11.1. Market Analysis, Insights and Forecast - By Country/Sub-region
- 11.1.1.
- 12. Asia Pacific Bike Sharing Industry Analysis, Insights and Forecast, 2019-2031
- 12.1. Market Analysis, Insights and Forecast - By Country/Sub-region
- 12.1.1.
- 13. Rest of the World Bike Sharing Industry Analysis, Insights and Forecast, 2019-2031
- 13.1. Market Analysis, Insights and Forecast - By Country/Sub-region
- 13.1.1.
- 14. Competitive Analysis
- 14.1. Global Market Share Analysis 2024
- 14.2. Company Profiles
- 14.2.1 JCDecaux Group
- 14.2.1.1. Overview
- 14.2.1.2. Products
- 14.2.1.3. SWOT Analysis
- 14.2.1.4. Recent Developments
- 14.2.1.5. Financials (Based on Availability)
- 14.2.2 Youon Bike
- 14.2.2.1. Overview
- 14.2.2.2. Products
- 14.2.2.3. SWOT Analysis
- 14.2.2.4. Recent Developments
- 14.2.2.5. Financials (Based on Availability)
- 14.2.3 Didi Chuxing Technology Co
- 14.2.3.1. Overview
- 14.2.3.2. Products
- 14.2.3.3. SWOT Analysis
- 14.2.3.4. Recent Developments
- 14.2.3.5. Financials (Based on Availability)
- 14.2.4 Uber Technologies Inc
- 14.2.4.1. Overview
- 14.2.4.2. Products
- 14.2.4.3. SWOT Analysis
- 14.2.4.4. Recent Developments
- 14.2.4.5. Financials (Based on Availability)
- 14.2.5 Lyft Inc
- 14.2.5.1. Overview
- 14.2.5.2. Products
- 14.2.5.3. SWOT Analysis
- 14.2.5.4. Recent Developments
- 14.2.5.5. Financials (Based on Availability)
- 14.2.6 Bluegogo
- 14.2.6.1. Overview
- 14.2.6.2. Products
- 14.2.6.3. SWOT Analysis
- 14.2.6.4. Recent Developments
- 14.2.6.5. Financials (Based on Availability)
- 14.2.7 Hellobike
- 14.2.7.1. Overview
- 14.2.7.2. Products
- 14.2.7.3. SWOT Analysis
- 14.2.7.4. Recent Developments
- 14.2.7.5. Financials (Based on Availability)
- 14.2.8 Meituan Bik
- 14.2.8.1. Overview
- 14.2.8.2. Products
- 14.2.8.3. SWOT Analysis
- 14.2.8.4. Recent Developments
- 14.2.8.5. Financials (Based on Availability)
- 14.2.9 Bird Rides Inc
- 14.2.9.1. Overview
- 14.2.9.2. Products
- 14.2.9.3. SWOT Analysis
- 14.2.9.4. Recent Developments
- 14.2.9.5. Financials (Based on Availability)
- 14.2.10 Neutron Holdings Inc
- 14.2.10.1. Overview
- 14.2.10.2. Products
- 14.2.10.3. SWOT Analysis
- 14.2.10.4. Recent Developments
- 14.2.10.5. Financials (Based on Availability)
- 14.2.1 JCDecaux Group
List of Figures
- Figure 1: Global Bike Sharing Industry Revenue Breakdown (Million, %) by Region 2024 & 2032
- Figure 2: North America Bike Sharing Industry Revenue (Million), by Country 2024 & 2032
- Figure 3: North America Bike Sharing Industry Revenue Share (%), by Country 2024 & 2032
- Figure 4: Europe Bike Sharing Industry Revenue (Million), by Country 2024 & 2032
- Figure 5: Europe Bike Sharing Industry Revenue Share (%), by Country 2024 & 2032
- Figure 6: Asia Pacific Bike Sharing Industry Revenue (Million), by Country 2024 & 2032
- Figure 7: Asia Pacific Bike Sharing Industry Revenue Share (%), by Country 2024 & 2032
- Figure 8: Rest of the World Bike Sharing Industry Revenue (Million), by Country 2024 & 2032
- Figure 9: Rest of the World Bike Sharing Industry Revenue Share (%), by Country 2024 & 2032
- Figure 10: North America Bike Sharing Industry Revenue (Million), by Bike 2024 & 2032
- Figure 11: North America Bike Sharing Industry Revenue Share (%), by Bike 2024 & 2032
- Figure 12: North America Bike Sharing Industry Revenue (Million), by Sharing System 2024 & 2032
- Figure 13: North America Bike Sharing Industry Revenue Share (%), by Sharing System 2024 & 2032
- Figure 14: North America Bike Sharing Industry Revenue (Million), by Country 2024 & 2032
- Figure 15: North America Bike Sharing Industry Revenue Share (%), by Country 2024 & 2032
- Figure 16: Europe Bike Sharing Industry Revenue (Million), by Bike 2024 & 2032
- Figure 17: Europe Bike Sharing Industry Revenue Share (%), by Bike 2024 & 2032
- Figure 18: Europe Bike Sharing Industry Revenue (Million), by Sharing System 2024 & 2032
- Figure 19: Europe Bike Sharing Industry Revenue Share (%), by Sharing System 2024 & 2032
- Figure 20: Europe Bike Sharing Industry Revenue (Million), by Country 2024 & 2032
- Figure 21: Europe Bike Sharing Industry Revenue Share (%), by Country 2024 & 2032
- Figure 22: Asia Pacific Bike Sharing Industry Revenue (Million), by Bike 2024 & 2032
- Figure 23: Asia Pacific Bike Sharing Industry Revenue Share (%), by Bike 2024 & 2032
- Figure 24: Asia Pacific Bike Sharing Industry Revenue (Million), by Sharing System 2024 & 2032
- Figure 25: Asia Pacific Bike Sharing Industry Revenue Share (%), by Sharing System 2024 & 2032
- Figure 26: Asia Pacific Bike Sharing Industry Revenue (Million), by Country 2024 & 2032
- Figure 27: Asia Pacific Bike Sharing Industry Revenue Share (%), by Country 2024 & 2032
- Figure 28: Rest of the World Bike Sharing Industry Revenue (Million), by Bike 2024 & 2032
- Figure 29: Rest of the World Bike Sharing Industry Revenue Share (%), by Bike 2024 & 2032
- Figure 30: Rest of the World Bike Sharing Industry Revenue (Million), by Sharing System 2024 & 2032
- Figure 31: Rest of the World Bike Sharing Industry Revenue Share (%), by Sharing System 2024 & 2032
- Figure 32: Rest of the World Bike Sharing Industry Revenue (Million), by Country 2024 & 2032
- Figure 33: Rest of the World Bike Sharing Industry Revenue Share (%), by Country 2024 & 2032
List of Tables
- Table 1: Global Bike Sharing Industry Revenue Million Forecast, by Region 2019 & 2032
- Table 2: Global Bike Sharing Industry Revenue Million Forecast, by Bike 2019 & 2032
- Table 3: Global Bike Sharing Industry Revenue Million Forecast, by Sharing System 2019 & 2032
- Table 4: Global Bike Sharing Industry Revenue Million Forecast, by Region 2019 & 2032
- Table 5: Global Bike Sharing Industry Revenue Million Forecast, by Country 2019 & 2032
- Table 6: Bike Sharing Industry Revenue (Million) Forecast, by Application 2019 & 2032
- Table 7: Global Bike Sharing Industry Revenue Million Forecast, by Country 2019 & 2032
- Table 8: Bike Sharing Industry Revenue (Million) Forecast, by Application 2019 & 2032
- Table 9: Global Bike Sharing Industry Revenue Million Forecast, by Country 2019 & 2032
- Table 10: Bike Sharing Industry Revenue (Million) Forecast, by Application 2019 & 2032
- Table 11: Global Bike Sharing Industry Revenue Million Forecast, by Country 2019 & 2032
- Table 12: Bike Sharing Industry Revenue (Million) Forecast, by Application 2019 & 2032
- Table 13: Global Bike Sharing Industry Revenue Million Forecast, by Bike 2019 & 2032
- Table 14: Global Bike Sharing Industry Revenue Million Forecast, by Sharing System 2019 & 2032
- Table 15: Global Bike Sharing Industry Revenue Million Forecast, by Country 2019 & 2032
- Table 16: Global Bike Sharing Industry Revenue Million Forecast, by Bike 2019 & 2032
- Table 17: Global Bike Sharing Industry Revenue Million Forecast, by Sharing System 2019 & 2032
- Table 18: Global Bike Sharing Industry Revenue Million Forecast, by Country 2019 & 2032
- Table 19: Global Bike Sharing Industry Revenue Million Forecast, by Bike 2019 & 2032
- Table 20: Global Bike Sharing Industry Revenue Million Forecast, by Sharing System 2019 & 2032
- Table 21: Global Bike Sharing Industry Revenue Million Forecast, by Country 2019 & 2032
- Table 22: Global Bike Sharing Industry Revenue Million Forecast, by Bike 2019 & 2032
- Table 23: Global Bike Sharing Industry Revenue Million Forecast, by Sharing System 2019 & 2032
- Table 24: Global Bike Sharing Industry Revenue Million Forecast, by Country 2019 & 2032
Frequently Asked Questions
1. What is the projected Compound Annual Growth Rate (CAGR) of the Bike Sharing Industry?
The projected CAGR is approximately 9.65%.
2. Which companies are prominent players in the Bike Sharing Industry?
Key companies in the market include JCDecaux Group, Youon Bike, Didi Chuxing Technology Co, Uber Technologies Inc, Lyft Inc, Bluegogo, Hellobike, Meituan Bik, Bird Rides Inc, Neutron Holdings Inc.
3. What are the main segments of the Bike Sharing Industry?
The market segments include Bike, Sharing System.
4. Can you provide details about the market size?
The market size is estimated to be USD 7.85 Million as of 2022.
5. What are some drivers contributing to market growth?
Increasing Inclusion of E-bikes in the Sharing Fleet.
6. What are the notable trends driving market growth?
E-bike Segment Expected to be the Fastest-growing Segment Over the Forecast Period.
7. Are there any restraints impacting market growth?
Limited Infrastructure May Hinder Market Growth.
8. Can you provide examples of recent developments in the market?
December 2023: The US International Development Finance Corporation (DFC) and IDB Invest announced that they were co-investing a combined USD 23 million in equity in micro-mobility platform Tembici to support the expansion of bicycle-sharing services in Latin America.
9. What pricing options are available for accessing the report?
Pricing options include single-user, multi-user, and enterprise licenses priced at USD 4750, USD 5250, and USD 8750 respectively.
10. Is the market size provided in terms of value or volume?
The market size is provided in terms of value, measured in Million.
11. Are there any specific market keywords associated with the report?
Yes, the market keyword associated with the report is "Bike Sharing Industry," which aids in identifying and referencing the specific market segment covered.
12. How do I determine which pricing option suits my needs best?
The pricing options vary based on user requirements and access needs. Individual users may opt for single-user licenses, while businesses requiring broader access may choose multi-user or enterprise licenses for cost-effective access to the report.
13. Are there any additional resources or data provided in the Bike Sharing Industry report?
While the report offers comprehensive insights, it's advisable to review the specific contents or supplementary materials provided to ascertain if additional resources or data are available.
14. How can I stay updated on further developments or reports in the Bike Sharing Industry?
To stay informed about further developments, trends, and reports in the Bike Sharing Industry, consider subscribing to industry newsletters, following relevant companies and organizations, or regularly checking reputable industry news sources and publications.
Methodology
Step 1 - Identification of Relevant Samples Size from Population Database


Step 2 - Approaches for Defining Global Market Size (Value, Volume* & Price*)

Note*: In applicable scenarios
Step 3 - Data Sources
Primary Research
- Web Analytics
- Survey Reports
- Research Institute
- Latest Research Reports
- Opinion Leaders
Secondary Research
- Annual Reports
- White Paper
- Latest Press Release
- Industry Association
- Paid Database
- Investor Presentations

Step 4 - Data Triangulation
Involves using different sources of information in order to increase the validity of a study
These sources are likely to be stakeholders in a program - participants, other researchers, program staff, other community members, and so on.
Then we put all data in single framework & apply various statistical tools to find out the dynamic on the market.
During the analysis stage, feedback from the stakeholder groups would be compared to determine areas of agreement as well as areas of divergence


