
Key Insights
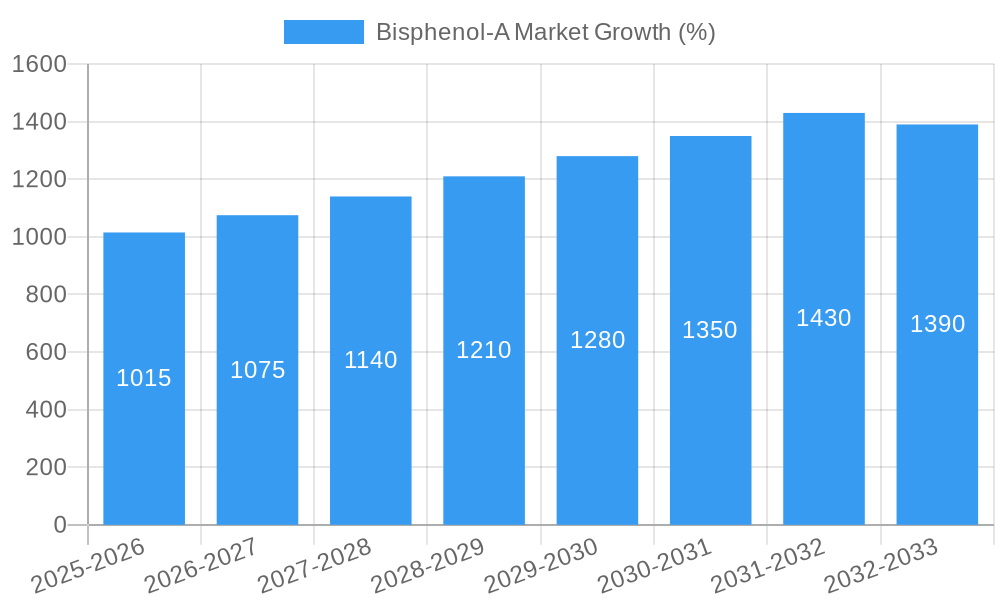
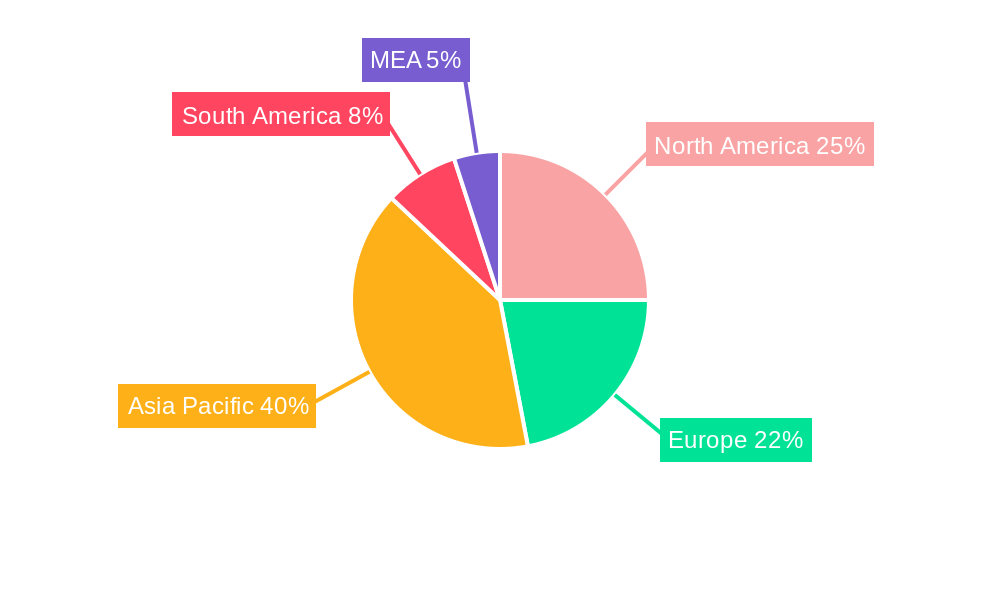
The Bisphenol-A (BPA) market, valued at $19.01 billion in 2025, is projected to experience robust growth, driven by a compound annual growth rate (CAGR) of 5.3% from 2025 to 2033. This expansion is fueled by the increasing demand for BPA in various applications, primarily within the polycarbonate resins sector which benefits from its exceptional transparency and strength. The construction industry's reliance on epoxy resins, another key application, also contributes significantly to market growth. Furthermore, the burgeoning electronics industry, requiring flame-retardant materials, presents a substantial opportunity. However, growing environmental concerns surrounding BPA's potential health risks pose a significant restraint. Regulations aimed at limiting BPA usage in consumer products, especially food and beverage containers, are anticipated to moderate market growth in certain segments. Geographic distribution shows a strong concentration in the Asia-Pacific region, driven by rapid industrialization and increased manufacturing activities in countries like China and India. North America and Europe also maintain significant market shares due to established manufacturing bases and high per capita consumption. Competitive dynamics are shaped by established players like Teijin Limited, Mitsui Chemicals Inc., and SABIC, who are continuously innovating and expanding their product portfolios to cater to evolving market needs.
The forecast period, 2025-2033, promises continued growth, although at a potentially moderated pace due to regulatory pressures. Strategic partnerships, mergers, and acquisitions are likely to shape the competitive landscape. Companies are focusing on developing BPA alternatives and exploring more sustainable manufacturing processes to address environmental concerns. Furthermore, the market segmentation by application (polycarbonate resins, epoxy resins, etc.) will continue to evolve, with potential shifts in demand influenced by technological advancements and regulatory changes. The future outlook for the BPA market hinges on a delicate balance between meeting industrial demands and navigating the evolving regulatory environment aimed at minimizing potential health and environmental risks. A deeper understanding of these countervailing forces will be crucial for companies aiming to thrive in this dynamic market.
Bisphenol-A Market: A Comprehensive Report (2019-2033)
This in-depth report provides a comprehensive analysis of the Bisphenol-A (BPA) market, offering invaluable insights for industry professionals, investors, and strategic decision-makers. With a study period spanning 2019-2033, a base year of 2025, and a forecast period of 2025-2033, this report leverages extensive data analysis to predict market trends and opportunities. The global Bisphenol-A market is projected to reach xx Billion by 2033, exhibiting a robust CAGR of xx% during the forecast period.

Bisphenol-A Market Structure & Innovation Trends
The Bisphenol-A market is moderately concentrated, with key players such as Teijin Limited, Mitsui Chemicals Inc., and Mitsubishi Chemical Corporation holding significant market share. However, the presence of several regional players, particularly in Asia, indicates a competitive landscape. Innovation is driven by the need for sustainable alternatives, stringent regulatory frameworks concerning BPA's potential health impacts, and the development of high-performance materials. Recent M&A activity has been moderate, with deal values averaging around xx Billion annually in the historical period (2019-2024), primarily focused on expanding production capacity and geographic reach.
- Market Concentration: Moderately concentrated, with top 5 players holding approximately xx% market share.
- Innovation Drivers: Sustainability concerns, regulatory pressures, demand for high-performance materials.
- Regulatory Frameworks: Varying regulations across regions, influencing product formulations and market access.
- Product Substitutes: Growing research and development in BPA alternatives, creating competitive pressure.
- End-User Demographics: Demand is primarily driven by the construction, automotive, and packaging industries.
- M&A Activity: Moderate activity, focusing on capacity expansion and geographical diversification.
Bisphenol-A Market Dynamics & Trends
The Bisphenol-A market is experiencing dynamic shifts, driven by several factors. The increasing demand for polycarbonate resins in various end-use applications, coupled with technological advancements in production processes, are key growth drivers. However, growing concerns regarding BPA's potential health impacts are leading to stricter regulations and the exploration of alternative materials, posing a significant challenge. Consumer preferences for sustainable and environmentally friendly products are also influencing market dynamics. The competitive landscape is characterized by both established players and emerging regional manufacturers, leading to price fluctuations and innovation. The market penetration of BPA alternatives is currently at approximately xx%, but is expected to increase significantly in the coming years.
Dominant Regions & Segments in Bisphenol-A Market
Asia-Pacific currently dominates the Bisphenol-A market, driven by robust economic growth, expanding infrastructure projects, and a large manufacturing base. China, in particular, holds a significant share due to its substantial production capacity and consumption levels. Within applications, Polycarbonate Resins represents the largest segment, accounting for roughly xx% of the market.
- Key Drivers in Asia-Pacific:
- Rapid industrialization and urbanization.
- Growing automotive and construction sectors.
- Favorable government policies supporting manufacturing.
- Polycarbonate Resins Dominance: High demand from various industries, including electronics and automotive.
- Epoxy Resins Growth: Driven by the increasing demand in the coatings and adhesives industries.
- Unsaturated Polyester Resins Market: Strong demand from the construction industry for composite materials.
- Flame Retardants Segment: Primarily driven by safety regulations and increasing demand in electronics and construction.
- Other Applications: Include medical devices, optical media, and packaging materials.
Bisphenol-A Market Product Innovations
Recent innovations in Bisphenol-A technology focus on enhancing material properties, improving sustainability, and addressing regulatory concerns. Manufacturers are investing in developing bio-based BPA alternatives and improving production processes to reduce environmental impact. The market is witnessing a shift towards high-performance, specialized BPA products tailored to specific end-use applications, enhancing competitive advantages.
Report Scope & Segmentation Analysis
This report provides a granular analysis of the Bisphenol-A market segmented by application:
- Polycarbonate Resins: This segment is projected to maintain its market leadership, driven by strong demand from the automotive and electronics industries. The market size is estimated at xx Billion in 2025 and is expected to reach xx Billion by 2033. Competition is intense, with several major players vying for market share.
- Epoxy Resins: This segment exhibits steady growth, driven by its use in coatings and adhesives. The market size is projected at xx Billion in 2025, increasing to xx Billion by 2033. The competitive landscape is relatively fragmented.
- Unsaturated Polyester Resins: This segment finds significant application in the construction industry, contributing to its moderate growth. Market size is estimated at xx Billion in 2025 and is forecasted to reach xx Billion by 2033.
- Flame Retardants: This segment experiences growth due to stringent safety regulations. The market size is projected at xx Billion in 2025, reaching xx Billion by 2033.
- Other Applications: This diverse segment encompasses various applications and displays moderate growth, driven by niche market expansions.
Key Drivers of Bisphenol-A Market Growth
The Bisphenol-A market is fueled by several factors, including the increasing demand for polycarbonate resins in diverse applications such as electronics, automotive, and construction. Technological advancements in production processes leading to cost reduction and improved efficiency, along with favorable economic conditions in key regions, contribute significantly to market growth. However, evolving regulatory landscapes, particularly concerning health and environmental concerns related to BPA, present both challenges and opportunities for innovation and sustainability.
Challenges in the Bisphenol-A Market Sector
The Bisphenol-A market faces challenges stemming from increasing regulatory scrutiny due to health concerns associated with BPA exposure. This leads to higher production costs and limitations on usage in certain applications. Supply chain disruptions and price volatility of raw materials also impact market stability. Intense competition from both established players and emerging manufacturers further complicates the market dynamics, putting pressure on profit margins. These factors combine to create a complex and evolving landscape for Bisphenol-A producers.
Emerging Opportunities in Bisphenol-A Market
Emerging opportunities exist in developing sustainable and bio-based BPA alternatives to address growing environmental concerns. The focus on high-performance, specialized BPA products catering to niche applications opens avenues for innovation and growth. Expansion into new and emerging markets, particularly in developing economies, offers significant potential for market expansion. Furthermore, collaborations and partnerships focused on research and development of next-generation BPA materials promise to shape future market dynamics.
Leading Players in the Bisphenol-A Market Market
- Teijin Limited
- Mitsui Chemicals Inc
- Mitsubishi Chemical Corporation
- Chang Chun Group
- Zhejiang Petroleum & Chemical Co Ltd
- Nippon Steel Chemical & Material Co Ltd
- Samyang Holdings Corporation
- China National Bluestar (Group) Co Ltd
- Nan Ya Plastics Industry Co Ltd
- SABIC
- LG Chem
- Dow
- Hexion
- Idemitsu Kosan Co Ltd
- Lihua Yiweiyuan Chemical Co Ltd
- PTT Phenol Company Limited
- Covestro AG
- China Petroleum & Chemical Corporation (SINOPEC)
- Altivia Petrochemicals
- Kumho P&B Chemicals Inc
Key Developments in Bisphenol-A Market Industry
- March 2023: Teijin Limited launched new biomass-derived Bisphenol-A (BPA) polycarbonate (PC) resin products, certified as an ISCC PLUS sustainable product, signifying a significant step towards environmentally friendly BPA production. This launch highlights a growing trend towards sustainable alternatives within the industry and directly impacts market dynamics by offering a more environmentally conscious option to consumers.
Future Outlook for Bisphenol-A Market Market
The Bisphenol-A market is poised for continued growth, driven by increasing demand from diverse industries and advancements in material science. While challenges related to health and environmental concerns persist, the development of sustainable alternatives and innovative applications will shape future market potential. Strategic partnerships, technological breakthroughs, and a focus on sustainability will play pivotal roles in determining market leadership and shaping future growth trajectories.
Bisphenol-A Market Segmentation
-
1. Application
- 1.1. Polycarbonate Resins
- 1.2. Epoxy Resins
- 1.3. Unsaturated Polyester Resins
- 1.4. Flame Retardants
- 1.5. Other Applications
Bisphenol-A Market Segmentation By Geography
-
1. Asia Pacific
- 1.1. China
- 1.2. India
- 1.3. Japan
- 1.4. South Korea
- 1.5. ASEAN Countries
- 1.6. Rest of Asia Pacific
-
2. North America
- 2.1. United States
- 2.2. Canada
- 2.3. Mexico
-
3. Europe
- 3.1. Germany
- 3.2. United Kingdom
- 3.3. Italy
- 3.4. France
- 3.5. Spain
- 3.6. Rest of Europe
-
4. South America
- 4.1. Brazil
- 4.2. Argentina
- 4.3. Rest of South America
-
5. Middle East and Africa
- 5.1. Saudi Arabia
- 5.2. South Africa
- 5.3. Rest of Middle East and Africa
Bisphenol-A Market REPORT HIGHLIGHTS
| Aspects | Details |
|---|---|
| Study Period | 2019-2033 |
| Base Year | 2024 |
| Estimated Year | 2025 |
| Forecast Period | 2025-2033 |
| Historical Period | 2019-2024 |
| Growth Rate | CAGR of 5.3% from 2019-2033 |
| Segmentation |
|
Table of Contents
- 1. Introduction
- 1.1. Research Scope
- 1.2. Market Segmentation
- 1.3. Research Methodology
- 1.4. Definitions and Assumptions
- 2. Executive Summary
- 2.1. Introduction
- 3. Market Dynamics
- 3.1. Introduction
- 3.2. Market Drivers
- 3.2.1. Soaring Demand from Polycarbonate Sector; Increasing Demand from Epoxy Resin Production
- 3.3. Market Restrains
- 3.3.1. Increasing Regulations in the Food and Beverage Industry
- 3.4. Market Trends
- 3.4.1. Increasing Demand for Polycarbonate Resins
- 4. Market Factor Analysis
- 4.1. Porters Five Forces
- 4.2. Supply/Value Chain
- 4.3. PESTEL analysis
- 4.4. Market Entropy
- 4.5. Patent/Trademark Analysis
- 5. Global Bisphenol-A Market Analysis, Insights and Forecast, 2019-2031
- 5.1. Market Analysis, Insights and Forecast - by Application
- 5.1.1. Polycarbonate Resins
- 5.1.2. Epoxy Resins
- 5.1.3. Unsaturated Polyester Resins
- 5.1.4. Flame Retardants
- 5.1.5. Other Applications
- 5.2. Market Analysis, Insights and Forecast - by Region
- 5.2.1. Asia Pacific
- 5.2.2. North America
- 5.2.3. Europe
- 5.2.4. South America
- 5.2.5. Middle East and Africa
- 5.1. Market Analysis, Insights and Forecast - by Application
- 6. Asia Pacific Bisphenol-A Market Analysis, Insights and Forecast, 2019-2031
- 6.1. Market Analysis, Insights and Forecast - by Application
- 6.1.1. Polycarbonate Resins
- 6.1.2. Epoxy Resins
- 6.1.3. Unsaturated Polyester Resins
- 6.1.4. Flame Retardants
- 6.1.5. Other Applications
- 6.1. Market Analysis, Insights and Forecast - by Application
- 7. North America Bisphenol-A Market Analysis, Insights and Forecast, 2019-2031
- 7.1. Market Analysis, Insights and Forecast - by Application
- 7.1.1. Polycarbonate Resins
- 7.1.2. Epoxy Resins
- 7.1.3. Unsaturated Polyester Resins
- 7.1.4. Flame Retardants
- 7.1.5. Other Applications
- 7.1. Market Analysis, Insights and Forecast - by Application
- 8. Europe Bisphenol-A Market Analysis, Insights and Forecast, 2019-2031
- 8.1. Market Analysis, Insights and Forecast - by Application
- 8.1.1. Polycarbonate Resins
- 8.1.2. Epoxy Resins
- 8.1.3. Unsaturated Polyester Resins
- 8.1.4. Flame Retardants
- 8.1.5. Other Applications
- 8.1. Market Analysis, Insights and Forecast - by Application
- 9. South America Bisphenol-A Market Analysis, Insights and Forecast, 2019-2031
- 9.1. Market Analysis, Insights and Forecast - by Application
- 9.1.1. Polycarbonate Resins
- 9.1.2. Epoxy Resins
- 9.1.3. Unsaturated Polyester Resins
- 9.1.4. Flame Retardants
- 9.1.5. Other Applications
- 9.1. Market Analysis, Insights and Forecast - by Application
- 10. Middle East and Africa Bisphenol-A Market Analysis, Insights and Forecast, 2019-2031
- 10.1. Market Analysis, Insights and Forecast - by Application
- 10.1.1. Polycarbonate Resins
- 10.1.2. Epoxy Resins
- 10.1.3. Unsaturated Polyester Resins
- 10.1.4. Flame Retardants
- 10.1.5. Other Applications
- 10.1. Market Analysis, Insights and Forecast - by Application
- 11. North America Bisphenol-A Market Analysis, Insights and Forecast, 2019-2031
- 11.1. Market Analysis, Insights and Forecast - By Country/Sub-region
- 11.1.1 United States
- 11.1.2 Canada
- 11.1.3 Mexico
- 12. Europe Bisphenol-A Market Analysis, Insights and Forecast, 2019-2031
- 12.1. Market Analysis, Insights and Forecast - By Country/Sub-region
- 12.1.1 Germany
- 12.1.2 France
- 12.1.3 Italy
- 12.1.4 United Kingdom
- 12.1.5 Netherlands
- 12.1.6 Rest of Europe
- 13. Asia Pacific Bisphenol-A Market Analysis, Insights and Forecast, 2019-2031
- 13.1. Market Analysis, Insights and Forecast - By Country/Sub-region
- 13.1.1 China
- 13.1.2 Japan
- 13.1.3 India
- 13.1.4 South Korea
- 13.1.5 Taiwan
- 13.1.6 Australia
- 13.1.7 Rest of Asia-Pacific
- 14. South America Bisphenol-A Market Analysis, Insights and Forecast, 2019-2031
- 14.1. Market Analysis, Insights and Forecast - By Country/Sub-region
- 14.1.1 Brazil
- 14.1.2 Argentina
- 14.1.3 Rest of South America
- 15. MEA Bisphenol-A Market Analysis, Insights and Forecast, 2019-2031
- 15.1. Market Analysis, Insights and Forecast - By Country/Sub-region
- 15.1.1 Middle East
- 15.1.2 Africa
- 16. Competitive Analysis
- 16.1. Global Market Share Analysis 2024
- 16.2. Company Profiles
- 16.2.1 Teijin Limited
- 16.2.1.1. Overview
- 16.2.1.2. Products
- 16.2.1.3. SWOT Analysis
- 16.2.1.4. Recent Developments
- 16.2.1.5. Financials (Based on Availability)
- 16.2.2 Mitsui Chemicals Inc
- 16.2.2.1. Overview
- 16.2.2.2. Products
- 16.2.2.3. SWOT Analysis
- 16.2.2.4. Recent Developments
- 16.2.2.5. Financials (Based on Availability)
- 16.2.3 Mitsubishi Chemical Corporation
- 16.2.3.1. Overview
- 16.2.3.2. Products
- 16.2.3.3. SWOT Analysis
- 16.2.3.4. Recent Developments
- 16.2.3.5. Financials (Based on Availability)
- 16.2.4 Chang Chun Group
- 16.2.4.1. Overview
- 16.2.4.2. Products
- 16.2.4.3. SWOT Analysis
- 16.2.4.4. Recent Developments
- 16.2.4.5. Financials (Based on Availability)
- 16.2.5 Zhejiang Petroleum & Chemical Co Ltd
- 16.2.5.1. Overview
- 16.2.5.2. Products
- 16.2.5.3. SWOT Analysis
- 16.2.5.4. Recent Developments
- 16.2.5.5. Financials (Based on Availability)
- 16.2.6 Nippon Steel Chemical & Material Co Ltd
- 16.2.6.1. Overview
- 16.2.6.2. Products
- 16.2.6.3. SWOT Analysis
- 16.2.6.4. Recent Developments
- 16.2.6.5. Financials (Based on Availability)
- 16.2.7 Samyang Holdings Corporation
- 16.2.7.1. Overview
- 16.2.7.2. Products
- 16.2.7.3. SWOT Analysis
- 16.2.7.4. Recent Developments
- 16.2.7.5. Financials (Based on Availability)
- 16.2.8 China National Bluestar (Group) Co Ltd
- 16.2.8.1. Overview
- 16.2.8.2. Products
- 16.2.8.3. SWOT Analysis
- 16.2.8.4. Recent Developments
- 16.2.8.5. Financials (Based on Availability)
- 16.2.9 Nan Ya Plastics Industry Co Ltd
- 16.2.9.1. Overview
- 16.2.9.2. Products
- 16.2.9.3. SWOT Analysis
- 16.2.9.4. Recent Developments
- 16.2.9.5. Financials (Based on Availability)
- 16.2.10 SABIC
- 16.2.10.1. Overview
- 16.2.10.2. Products
- 16.2.10.3. SWOT Analysis
- 16.2.10.4. Recent Developments
- 16.2.10.5. Financials (Based on Availability)
- 16.2.11 LG Chem
- 16.2.11.1. Overview
- 16.2.11.2. Products
- 16.2.11.3. SWOT Analysis
- 16.2.11.4. Recent Developments
- 16.2.11.5. Financials (Based on Availability)
- 16.2.12 Dow
- 16.2.12.1. Overview
- 16.2.12.2. Products
- 16.2.12.3. SWOT Analysis
- 16.2.12.4. Recent Developments
- 16.2.12.5. Financials (Based on Availability)
- 16.2.13 Hexion
- 16.2.13.1. Overview
- 16.2.13.2. Products
- 16.2.13.3. SWOT Analysis
- 16.2.13.4. Recent Developments
- 16.2.13.5. Financials (Based on Availability)
- 16.2.14 Idemitsu Kosan Co Ltd
- 16.2.14.1. Overview
- 16.2.14.2. Products
- 16.2.14.3. SWOT Analysis
- 16.2.14.4. Recent Developments
- 16.2.14.5. Financials (Based on Availability)
- 16.2.15 Lihua Yiweiyuan Chemical Co Ltd
- 16.2.15.1. Overview
- 16.2.15.2. Products
- 16.2.15.3. SWOT Analysis
- 16.2.15.4. Recent Developments
- 16.2.15.5. Financials (Based on Availability)
- 16.2.16 PTT Phenol Company Limited
- 16.2.16.1. Overview
- 16.2.16.2. Products
- 16.2.16.3. SWOT Analysis
- 16.2.16.4. Recent Developments
- 16.2.16.5. Financials (Based on Availability)
- 16.2.17 Covestro AG
- 16.2.17.1. Overview
- 16.2.17.2. Products
- 16.2.17.3. SWOT Analysis
- 16.2.17.4. Recent Developments
- 16.2.17.5. Financials (Based on Availability)
- 16.2.18 China Petroleum & Chemical Corporation (SINOPEC)
- 16.2.18.1. Overview
- 16.2.18.2. Products
- 16.2.18.3. SWOT Analysis
- 16.2.18.4. Recent Developments
- 16.2.18.5. Financials (Based on Availability)
- 16.2.19 Altivia Petrochemicals
- 16.2.19.1. Overview
- 16.2.19.2. Products
- 16.2.19.3. SWOT Analysis
- 16.2.19.4. Recent Developments
- 16.2.19.5. Financials (Based on Availability)
- 16.2.20 Kumho P&B Chemicals Inc
- 16.2.20.1. Overview
- 16.2.20.2. Products
- 16.2.20.3. SWOT Analysis
- 16.2.20.4. Recent Developments
- 16.2.20.5. Financials (Based on Availability)
- 16.2.1 Teijin Limited
List of Figures
- Figure 1: Global Bisphenol-A Market Revenue Breakdown (Billion, %) by Region 2024 & 2032
- Figure 2: Global Bisphenol-A Market Volume Breakdown (K Tons, %) by Region 2024 & 2032
- Figure 3: North America Bisphenol-A Market Revenue (Billion), by Country 2024 & 2032
- Figure 4: North America Bisphenol-A Market Volume (K Tons), by Country 2024 & 2032
- Figure 5: North America Bisphenol-A Market Revenue Share (%), by Country 2024 & 2032
- Figure 6: North America Bisphenol-A Market Volume Share (%), by Country 2024 & 2032
- Figure 7: Europe Bisphenol-A Market Revenue (Billion), by Country 2024 & 2032
- Figure 8: Europe Bisphenol-A Market Volume (K Tons), by Country 2024 & 2032
- Figure 9: Europe Bisphenol-A Market Revenue Share (%), by Country 2024 & 2032
- Figure 10: Europe Bisphenol-A Market Volume Share (%), by Country 2024 & 2032
- Figure 11: Asia Pacific Bisphenol-A Market Revenue (Billion), by Country 2024 & 2032
- Figure 12: Asia Pacific Bisphenol-A Market Volume (K Tons), by Country 2024 & 2032
- Figure 13: Asia Pacific Bisphenol-A Market Revenue Share (%), by Country 2024 & 2032
- Figure 14: Asia Pacific Bisphenol-A Market Volume Share (%), by Country 2024 & 2032
- Figure 15: South America Bisphenol-A Market Revenue (Billion), by Country 2024 & 2032
- Figure 16: South America Bisphenol-A Market Volume (K Tons), by Country 2024 & 2032
- Figure 17: South America Bisphenol-A Market Revenue Share (%), by Country 2024 & 2032
- Figure 18: South America Bisphenol-A Market Volume Share (%), by Country 2024 & 2032
- Figure 19: MEA Bisphenol-A Market Revenue (Billion), by Country 2024 & 2032
- Figure 20: MEA Bisphenol-A Market Volume (K Tons), by Country 2024 & 2032
- Figure 21: MEA Bisphenol-A Market Revenue Share (%), by Country 2024 & 2032
- Figure 22: MEA Bisphenol-A Market Volume Share (%), by Country 2024 & 2032
- Figure 23: Asia Pacific Bisphenol-A Market Revenue (Billion), by Application 2024 & 2032
- Figure 24: Asia Pacific Bisphenol-A Market Volume (K Tons), by Application 2024 & 2032
- Figure 25: Asia Pacific Bisphenol-A Market Revenue Share (%), by Application 2024 & 2032
- Figure 26: Asia Pacific Bisphenol-A Market Volume Share (%), by Application 2024 & 2032
- Figure 27: Asia Pacific Bisphenol-A Market Revenue (Billion), by Country 2024 & 2032
- Figure 28: Asia Pacific Bisphenol-A Market Volume (K Tons), by Country 2024 & 2032
- Figure 29: Asia Pacific Bisphenol-A Market Revenue Share (%), by Country 2024 & 2032
- Figure 30: Asia Pacific Bisphenol-A Market Volume Share (%), by Country 2024 & 2032
- Figure 31: North America Bisphenol-A Market Revenue (Billion), by Application 2024 & 2032
- Figure 32: North America Bisphenol-A Market Volume (K Tons), by Application 2024 & 2032
- Figure 33: North America Bisphenol-A Market Revenue Share (%), by Application 2024 & 2032
- Figure 34: North America Bisphenol-A Market Volume Share (%), by Application 2024 & 2032
- Figure 35: North America Bisphenol-A Market Revenue (Billion), by Country 2024 & 2032
- Figure 36: North America Bisphenol-A Market Volume (K Tons), by Country 2024 & 2032
- Figure 37: North America Bisphenol-A Market Revenue Share (%), by Country 2024 & 2032
- Figure 38: North America Bisphenol-A Market Volume Share (%), by Country 2024 & 2032
- Figure 39: Europe Bisphenol-A Market Revenue (Billion), by Application 2024 & 2032
- Figure 40: Europe Bisphenol-A Market Volume (K Tons), by Application 2024 & 2032
- Figure 41: Europe Bisphenol-A Market Revenue Share (%), by Application 2024 & 2032
- Figure 42: Europe Bisphenol-A Market Volume Share (%), by Application 2024 & 2032
- Figure 43: Europe Bisphenol-A Market Revenue (Billion), by Country 2024 & 2032
- Figure 44: Europe Bisphenol-A Market Volume (K Tons), by Country 2024 & 2032
- Figure 45: Europe Bisphenol-A Market Revenue Share (%), by Country 2024 & 2032
- Figure 46: Europe Bisphenol-A Market Volume Share (%), by Country 2024 & 2032
- Figure 47: South America Bisphenol-A Market Revenue (Billion), by Application 2024 & 2032
- Figure 48: South America Bisphenol-A Market Volume (K Tons), by Application 2024 & 2032
- Figure 49: South America Bisphenol-A Market Revenue Share (%), by Application 2024 & 2032
- Figure 50: South America Bisphenol-A Market Volume Share (%), by Application 2024 & 2032
- Figure 51: South America Bisphenol-A Market Revenue (Billion), by Country 2024 & 2032
- Figure 52: South America Bisphenol-A Market Volume (K Tons), by Country 2024 & 2032
- Figure 53: South America Bisphenol-A Market Revenue Share (%), by Country 2024 & 2032
- Figure 54: South America Bisphenol-A Market Volume Share (%), by Country 2024 & 2032
- Figure 55: Middle East and Africa Bisphenol-A Market Revenue (Billion), by Application 2024 & 2032
- Figure 56: Middle East and Africa Bisphenol-A Market Volume (K Tons), by Application 2024 & 2032
- Figure 57: Middle East and Africa Bisphenol-A Market Revenue Share (%), by Application 2024 & 2032
- Figure 58: Middle East and Africa Bisphenol-A Market Volume Share (%), by Application 2024 & 2032
- Figure 59: Middle East and Africa Bisphenol-A Market Revenue (Billion), by Country 2024 & 2032
- Figure 60: Middle East and Africa Bisphenol-A Market Volume (K Tons), by Country 2024 & 2032
- Figure 61: Middle East and Africa Bisphenol-A Market Revenue Share (%), by Country 2024 & 2032
- Figure 62: Middle East and Africa Bisphenol-A Market Volume Share (%), by Country 2024 & 2032
List of Tables
- Table 1: Global Bisphenol-A Market Revenue Billion Forecast, by Region 2019 & 2032
- Table 2: Global Bisphenol-A Market Volume K Tons Forecast, by Region 2019 & 2032
- Table 3: Global Bisphenol-A Market Revenue Billion Forecast, by Application 2019 & 2032
- Table 4: Global Bisphenol-A Market Volume K Tons Forecast, by Application 2019 & 2032
- Table 5: Global Bisphenol-A Market Revenue Billion Forecast, by Region 2019 & 2032
- Table 6: Global Bisphenol-A Market Volume K Tons Forecast, by Region 2019 & 2032
- Table 7: Global Bisphenol-A Market Revenue Billion Forecast, by Country 2019 & 2032
- Table 8: Global Bisphenol-A Market Volume K Tons Forecast, by Country 2019 & 2032
- Table 9: United States Bisphenol-A Market Revenue (Billion) Forecast, by Application 2019 & 2032
- Table 10: United States Bisphenol-A Market Volume (K Tons) Forecast, by Application 2019 & 2032
- Table 11: Canada Bisphenol-A Market Revenue (Billion) Forecast, by Application 2019 & 2032
- Table 12: Canada Bisphenol-A Market Volume (K Tons) Forecast, by Application 2019 & 2032
- Table 13: Mexico Bisphenol-A Market Revenue (Billion) Forecast, by Application 2019 & 2032
- Table 14: Mexico Bisphenol-A Market Volume (K Tons) Forecast, by Application 2019 & 2032
- Table 15: Global Bisphenol-A Market Revenue Billion Forecast, by Country 2019 & 2032
- Table 16: Global Bisphenol-A Market Volume K Tons Forecast, by Country 2019 & 2032
- Table 17: Germany Bisphenol-A Market Revenue (Billion) Forecast, by Application 2019 & 2032
- Table 18: Germany Bisphenol-A Market Volume (K Tons) Forecast, by Application 2019 & 2032
- Table 19: France Bisphenol-A Market Revenue (Billion) Forecast, by Application 2019 & 2032
- Table 20: France Bisphenol-A Market Volume (K Tons) Forecast, by Application 2019 & 2032
- Table 21: Italy Bisphenol-A Market Revenue (Billion) Forecast, by Application 2019 & 2032
- Table 22: Italy Bisphenol-A Market Volume (K Tons) Forecast, by Application 2019 & 2032
- Table 23: United Kingdom Bisphenol-A Market Revenue (Billion) Forecast, by Application 2019 & 2032
- Table 24: United Kingdom Bisphenol-A Market Volume (K Tons) Forecast, by Application 2019 & 2032
- Table 25: Netherlands Bisphenol-A Market Revenue (Billion) Forecast, by Application 2019 & 2032
- Table 26: Netherlands Bisphenol-A Market Volume (K Tons) Forecast, by Application 2019 & 2032
- Table 27: Rest of Europe Bisphenol-A Market Revenue (Billion) Forecast, by Application 2019 & 2032
- Table 28: Rest of Europe Bisphenol-A Market Volume (K Tons) Forecast, by Application 2019 & 2032
- Table 29: Global Bisphenol-A Market Revenue Billion Forecast, by Country 2019 & 2032
- Table 30: Global Bisphenol-A Market Volume K Tons Forecast, by Country 2019 & 2032
- Table 31: China Bisphenol-A Market Revenue (Billion) Forecast, by Application 2019 & 2032
- Table 32: China Bisphenol-A Market Volume (K Tons) Forecast, by Application 2019 & 2032
- Table 33: Japan Bisphenol-A Market Revenue (Billion) Forecast, by Application 2019 & 2032
- Table 34: Japan Bisphenol-A Market Volume (K Tons) Forecast, by Application 2019 & 2032
- Table 35: India Bisphenol-A Market Revenue (Billion) Forecast, by Application 2019 & 2032
- Table 36: India Bisphenol-A Market Volume (K Tons) Forecast, by Application 2019 & 2032
- Table 37: South Korea Bisphenol-A Market Revenue (Billion) Forecast, by Application 2019 & 2032
- Table 38: South Korea Bisphenol-A Market Volume (K Tons) Forecast, by Application 2019 & 2032
- Table 39: Taiwan Bisphenol-A Market Revenue (Billion) Forecast, by Application 2019 & 2032
- Table 40: Taiwan Bisphenol-A Market Volume (K Tons) Forecast, by Application 2019 & 2032
- Table 41: Australia Bisphenol-A Market Revenue (Billion) Forecast, by Application 2019 & 2032
- Table 42: Australia Bisphenol-A Market Volume (K Tons) Forecast, by Application 2019 & 2032
- Table 43: Rest of Asia-Pacific Bisphenol-A Market Revenue (Billion) Forecast, by Application 2019 & 2032
- Table 44: Rest of Asia-Pacific Bisphenol-A Market Volume (K Tons) Forecast, by Application 2019 & 2032
- Table 45: Global Bisphenol-A Market Revenue Billion Forecast, by Country 2019 & 2032
- Table 46: Global Bisphenol-A Market Volume K Tons Forecast, by Country 2019 & 2032
- Table 47: Brazil Bisphenol-A Market Revenue (Billion) Forecast, by Application 2019 & 2032
- Table 48: Brazil Bisphenol-A Market Volume (K Tons) Forecast, by Application 2019 & 2032
- Table 49: Argentina Bisphenol-A Market Revenue (Billion) Forecast, by Application 2019 & 2032
- Table 50: Argentina Bisphenol-A Market Volume (K Tons) Forecast, by Application 2019 & 2032
- Table 51: Rest of South America Bisphenol-A Market Revenue (Billion) Forecast, by Application 2019 & 2032
- Table 52: Rest of South America Bisphenol-A Market Volume (K Tons) Forecast, by Application 2019 & 2032
- Table 53: Global Bisphenol-A Market Revenue Billion Forecast, by Country 2019 & 2032
- Table 54: Global Bisphenol-A Market Volume K Tons Forecast, by Country 2019 & 2032
- Table 55: Middle East Bisphenol-A Market Revenue (Billion) Forecast, by Application 2019 & 2032
- Table 56: Middle East Bisphenol-A Market Volume (K Tons) Forecast, by Application 2019 & 2032
- Table 57: Africa Bisphenol-A Market Revenue (Billion) Forecast, by Application 2019 & 2032
- Table 58: Africa Bisphenol-A Market Volume (K Tons) Forecast, by Application 2019 & 2032
- Table 59: Global Bisphenol-A Market Revenue Billion Forecast, by Application 2019 & 2032
- Table 60: Global Bisphenol-A Market Volume K Tons Forecast, by Application 2019 & 2032
- Table 61: Global Bisphenol-A Market Revenue Billion Forecast, by Country 2019 & 2032
- Table 62: Global Bisphenol-A Market Volume K Tons Forecast, by Country 2019 & 2032
- Table 63: China Bisphenol-A Market Revenue (Billion) Forecast, by Application 2019 & 2032
- Table 64: China Bisphenol-A Market Volume (K Tons) Forecast, by Application 2019 & 2032
- Table 65: India Bisphenol-A Market Revenue (Billion) Forecast, by Application 2019 & 2032
- Table 66: India Bisphenol-A Market Volume (K Tons) Forecast, by Application 2019 & 2032
- Table 67: Japan Bisphenol-A Market Revenue (Billion) Forecast, by Application 2019 & 2032
- Table 68: Japan Bisphenol-A Market Volume (K Tons) Forecast, by Application 2019 & 2032
- Table 69: South Korea Bisphenol-A Market Revenue (Billion) Forecast, by Application 2019 & 2032
- Table 70: South Korea Bisphenol-A Market Volume (K Tons) Forecast, by Application 2019 & 2032
- Table 71: ASEAN Countries Bisphenol-A Market Revenue (Billion) Forecast, by Application 2019 & 2032
- Table 72: ASEAN Countries Bisphenol-A Market Volume (K Tons) Forecast, by Application 2019 & 2032
- Table 73: Rest of Asia Pacific Bisphenol-A Market Revenue (Billion) Forecast, by Application 2019 & 2032
- Table 74: Rest of Asia Pacific Bisphenol-A Market Volume (K Tons) Forecast, by Application 2019 & 2032
- Table 75: Global Bisphenol-A Market Revenue Billion Forecast, by Application 2019 & 2032
- Table 76: Global Bisphenol-A Market Volume K Tons Forecast, by Application 2019 & 2032
- Table 77: Global Bisphenol-A Market Revenue Billion Forecast, by Country 2019 & 2032
- Table 78: Global Bisphenol-A Market Volume K Tons Forecast, by Country 2019 & 2032
- Table 79: United States Bisphenol-A Market Revenue (Billion) Forecast, by Application 2019 & 2032
- Table 80: United States Bisphenol-A Market Volume (K Tons) Forecast, by Application 2019 & 2032
- Table 81: Canada Bisphenol-A Market Revenue (Billion) Forecast, by Application 2019 & 2032
- Table 82: Canada Bisphenol-A Market Volume (K Tons) Forecast, by Application 2019 & 2032
- Table 83: Mexico Bisphenol-A Market Revenue (Billion) Forecast, by Application 2019 & 2032
- Table 84: Mexico Bisphenol-A Market Volume (K Tons) Forecast, by Application 2019 & 2032
- Table 85: Global Bisphenol-A Market Revenue Billion Forecast, by Application 2019 & 2032
- Table 86: Global Bisphenol-A Market Volume K Tons Forecast, by Application 2019 & 2032
- Table 87: Global Bisphenol-A Market Revenue Billion Forecast, by Country 2019 & 2032
- Table 88: Global Bisphenol-A Market Volume K Tons Forecast, by Country 2019 & 2032
- Table 89: Germany Bisphenol-A Market Revenue (Billion) Forecast, by Application 2019 & 2032
- Table 90: Germany Bisphenol-A Market Volume (K Tons) Forecast, by Application 2019 & 2032
- Table 91: United Kingdom Bisphenol-A Market Revenue (Billion) Forecast, by Application 2019 & 2032
- Table 92: United Kingdom Bisphenol-A Market Volume (K Tons) Forecast, by Application 2019 & 2032
- Table 93: Italy Bisphenol-A Market Revenue (Billion) Forecast, by Application 2019 & 2032
- Table 94: Italy Bisphenol-A Market Volume (K Tons) Forecast, by Application 2019 & 2032
- Table 95: France Bisphenol-A Market Revenue (Billion) Forecast, by Application 2019 & 2032
- Table 96: France Bisphenol-A Market Volume (K Tons) Forecast, by Application 2019 & 2032
- Table 97: Spain Bisphenol-A Market Revenue (Billion) Forecast, by Application 2019 & 2032
- Table 98: Spain Bisphenol-A Market Volume (K Tons) Forecast, by Application 2019 & 2032
- Table 99: Rest of Europe Bisphenol-A Market Revenue (Billion) Forecast, by Application 2019 & 2032
- Table 100: Rest of Europe Bisphenol-A Market Volume (K Tons) Forecast, by Application 2019 & 2032
- Table 101: Global Bisphenol-A Market Revenue Billion Forecast, by Application 2019 & 2032
- Table 102: Global Bisphenol-A Market Volume K Tons Forecast, by Application 2019 & 2032
- Table 103: Global Bisphenol-A Market Revenue Billion Forecast, by Country 2019 & 2032
- Table 104: Global Bisphenol-A Market Volume K Tons Forecast, by Country 2019 & 2032
- Table 105: Brazil Bisphenol-A Market Revenue (Billion) Forecast, by Application 2019 & 2032
- Table 106: Brazil Bisphenol-A Market Volume (K Tons) Forecast, by Application 2019 & 2032
- Table 107: Argentina Bisphenol-A Market Revenue (Billion) Forecast, by Application 2019 & 2032
- Table 108: Argentina Bisphenol-A Market Volume (K Tons) Forecast, by Application 2019 & 2032
- Table 109: Rest of South America Bisphenol-A Market Revenue (Billion) Forecast, by Application 2019 & 2032
- Table 110: Rest of South America Bisphenol-A Market Volume (K Tons) Forecast, by Application 2019 & 2032
- Table 111: Global Bisphenol-A Market Revenue Billion Forecast, by Application 2019 & 2032
- Table 112: Global Bisphenol-A Market Volume K Tons Forecast, by Application 2019 & 2032
- Table 113: Global Bisphenol-A Market Revenue Billion Forecast, by Country 2019 & 2032
- Table 114: Global Bisphenol-A Market Volume K Tons Forecast, by Country 2019 & 2032
- Table 115: Saudi Arabia Bisphenol-A Market Revenue (Billion) Forecast, by Application 2019 & 2032
- Table 116: Saudi Arabia Bisphenol-A Market Volume (K Tons) Forecast, by Application 2019 & 2032
- Table 117: South Africa Bisphenol-A Market Revenue (Billion) Forecast, by Application 2019 & 2032
- Table 118: South Africa Bisphenol-A Market Volume (K Tons) Forecast, by Application 2019 & 2032
- Table 119: Rest of Middle East and Africa Bisphenol-A Market Revenue (Billion) Forecast, by Application 2019 & 2032
- Table 120: Rest of Middle East and Africa Bisphenol-A Market Volume (K Tons) Forecast, by Application 2019 & 2032
Frequently Asked Questions
1. What is the projected Compound Annual Growth Rate (CAGR) of the Bisphenol-A Market?
The projected CAGR is approximately 5.3%.
2. Which companies are prominent players in the Bisphenol-A Market?
Key companies in the market include Teijin Limited, Mitsui Chemicals Inc, Mitsubishi Chemical Corporation, Chang Chun Group, Zhejiang Petroleum & Chemical Co Ltd, Nippon Steel Chemical & Material Co Ltd, Samyang Holdings Corporation, China National Bluestar (Group) Co Ltd, Nan Ya Plastics Industry Co Ltd, SABIC, LG Chem, Dow, Hexion, Idemitsu Kosan Co Ltd, Lihua Yiweiyuan Chemical Co Ltd, PTT Phenol Company Limited, Covestro AG, China Petroleum & Chemical Corporation (SINOPEC), Altivia Petrochemicals, Kumho P&B Chemicals Inc.
3. What are the main segments of the Bisphenol-A Market?
The market segments include Application.
4. Can you provide details about the market size?
The market size is estimated to be USD 19.01 Billion as of 2022.
5. What are some drivers contributing to market growth?
Soaring Demand from Polycarbonate Sector; Increasing Demand from Epoxy Resin Production.
6. What are the notable trends driving market growth?
Increasing Demand for Polycarbonate Resins.
7. Are there any restraints impacting market growth?
Increasing Regulations in the Food and Beverage Industry.
8. Can you provide examples of recent developments in the market?
March 2023: Teijin Limited launched new biomass-derived Bisphenol-A (BPA) polycarbonate (PC) resin products, which were certified as an ISCC PLUS sustainable product by the International Sustainability and Carbon Certification (ISCC) system to support efforts to achieve carbon neutrality by reducing greenhouse gas (GHG) emissions throughout product lifecycles.
9. What pricing options are available for accessing the report?
Pricing options include single-user, multi-user, and enterprise licenses priced at USD 4750, USD 5250, and USD 8750 respectively.
10. Is the market size provided in terms of value or volume?
The market size is provided in terms of value, measured in Billion and volume, measured in K Tons.
11. Are there any specific market keywords associated with the report?
Yes, the market keyword associated with the report is "Bisphenol-A Market," which aids in identifying and referencing the specific market segment covered.
12. How do I determine which pricing option suits my needs best?
The pricing options vary based on user requirements and access needs. Individual users may opt for single-user licenses, while businesses requiring broader access may choose multi-user or enterprise licenses for cost-effective access to the report.
13. Are there any additional resources or data provided in the Bisphenol-A Market report?
While the report offers comprehensive insights, it's advisable to review the specific contents or supplementary materials provided to ascertain if additional resources or data are available.
14. How can I stay updated on further developments or reports in the Bisphenol-A Market?
To stay informed about further developments, trends, and reports in the Bisphenol-A Market, consider subscribing to industry newsletters, following relevant companies and organizations, or regularly checking reputable industry news sources and publications.
Methodology
Step 1 - Identification of Relevant Samples Size from Population Database


Step 2 - Approaches for Defining Global Market Size (Value, Volume* & Price*)

Note*: In applicable scenarios
Step 3 - Data Sources
Primary Research
- Web Analytics
- Survey Reports
- Research Institute
- Latest Research Reports
- Opinion Leaders
Secondary Research
- Annual Reports
- White Paper
- Latest Press Release
- Industry Association
- Paid Database
- Investor Presentations

Step 4 - Data Triangulation
Involves using different sources of information in order to increase the validity of a study
These sources are likely to be stakeholders in a program - participants, other researchers, program staff, other community members, and so on.
Then we put all data in single framework & apply various statistical tools to find out the dynamic on the market.
During the analysis stage, feedback from the stakeholder groups would be compared to determine areas of agreement as well as areas of divergence


