

Key Insights
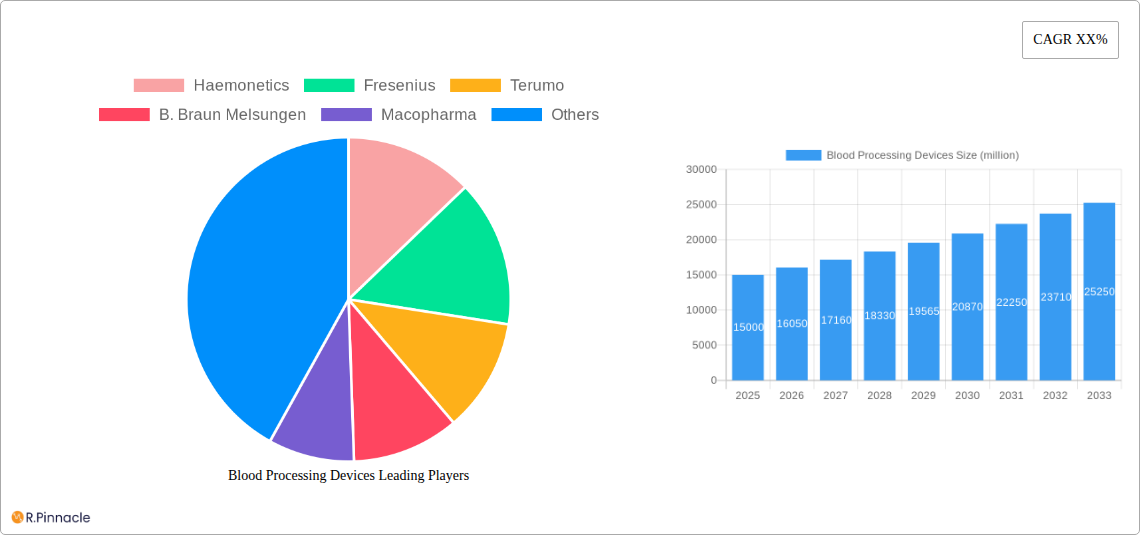
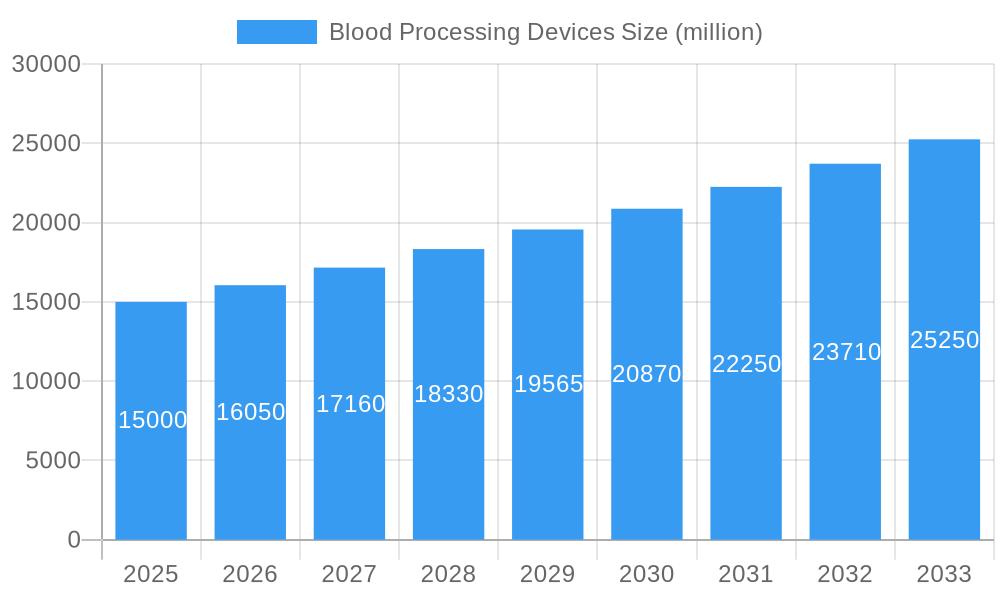
The global blood processing devices market is experiencing robust growth, driven by several key factors. The increasing prevalence of chronic diseases like cancer and cardiovascular ailments necessitates frequent blood transfusions and therapies, significantly boosting demand for efficient and reliable blood processing equipment. Technological advancements, such as the development of automated and closed-system devices, are enhancing safety and efficiency, while simultaneously reducing the risk of contamination. Furthermore, the rising geriatric population, coupled with a growing awareness of the importance of blood donation and transfusion medicine, is further fueling market expansion. A projected Compound Annual Growth Rate (CAGR) of approximately 7% from 2025 to 2033 indicates a significant market opportunity. Leading players like Haemonetics, Fresenius, Terumo, B. Braun Melsungen, Macopharma, and Haier Biomedical are constantly innovating to improve product offerings and cater to the growing market needs. This competitive landscape is fostering advancements in areas like cell separation, plasma fractionation, and blood component storage, leading to improved patient outcomes and healthcare efficiency.
Blood Processing Devices Market Size (In Billion)
Market segmentation reveals strong growth in automated systems, primarily due to their superior performance and reduced risk of human error. The North American and European markets currently hold significant shares, largely owing to established healthcare infrastructure and high per capita healthcare expenditure. However, emerging economies in Asia-Pacific are showing promising growth potential, driven by increasing healthcare investments and rising disposable incomes. While regulatory hurdles and high initial investment costs present certain restraints, the overall market outlook remains positive, driven by continuous technological improvements, favorable government policies supporting blood banking infrastructure, and a consistently rising demand for effective and safe blood processing solutions globally. Future market growth will likely be shaped by the increasing adoption of point-of-care technologies, personalized medicine approaches, and further advancements in blood component separation techniques.
Blood Processing Devices Company Market Share
This comprehensive report provides an in-depth analysis of the global blood processing devices market, offering invaluable insights for industry professionals, investors, and strategic decision-makers. With a study period spanning 2019-2033, a base year of 2025, and a forecast period of 2025-2033, this report delivers a complete overview of market dynamics, trends, and future projections. The market is valued at xx million in 2025 and is projected to reach xx million by 2033, exhibiting a CAGR of xx%. Key players analyzed include Haemonetics, Fresenius, Terumo, B. Braun Melsungen, Macopharma, and Haier Biomedical.
Blood Processing Devices Market Structure & Innovation Trends
The global blood processing devices market is moderately concentrated, with the top five players holding an estimated xx% market share in 2025. Innovation is driven by advancements in automation, miniaturization, and point-of-care technologies, aiming to improve efficiency, reduce costs, and enhance safety. Stringent regulatory frameworks, particularly from agencies like the FDA and EMA, influence product development and market entry. Substitute technologies are limited, primarily focusing on alternative blood preservation methods. The end-user demographics primarily comprise hospitals, blood banks, and transfusion centers, with a growing emphasis on ambulatory and point-of-care settings. M&A activity has been moderate in recent years, with deal values exceeding xx million in the historical period (2019-2024), primarily focused on strengthening product portfolios and expanding geographical reach.
- Market Concentration: Moderately concentrated, top 5 players holding xx% market share (2025).
- Innovation Drivers: Automation, miniaturization, point-of-care diagnostics.
- Regulatory Landscape: Stringent regulations from FDA, EMA, and other global bodies.
- M&A Activity: xx million in deal value (2019-2024).
Blood Processing Devices Market Dynamics & Trends
The blood processing devices market is experiencing robust growth, driven by several factors. Increasing prevalence of chronic diseases requiring blood transfusions, rising geriatric population, and technological advancements contributing to improved efficiency and safety are key growth drivers. Technological disruptions, such as the integration of AI and machine learning for automated blood processing, are transforming the market landscape. Consumer preference is shifting towards technologically advanced, user-friendly devices with improved safety features. Competitive dynamics are intense, with established players focusing on innovation and strategic partnerships to maintain their market position, while new entrants are leveraging technological advancements to gain market share. Market penetration for automated blood processing systems is expected to reach xx% by 2033.
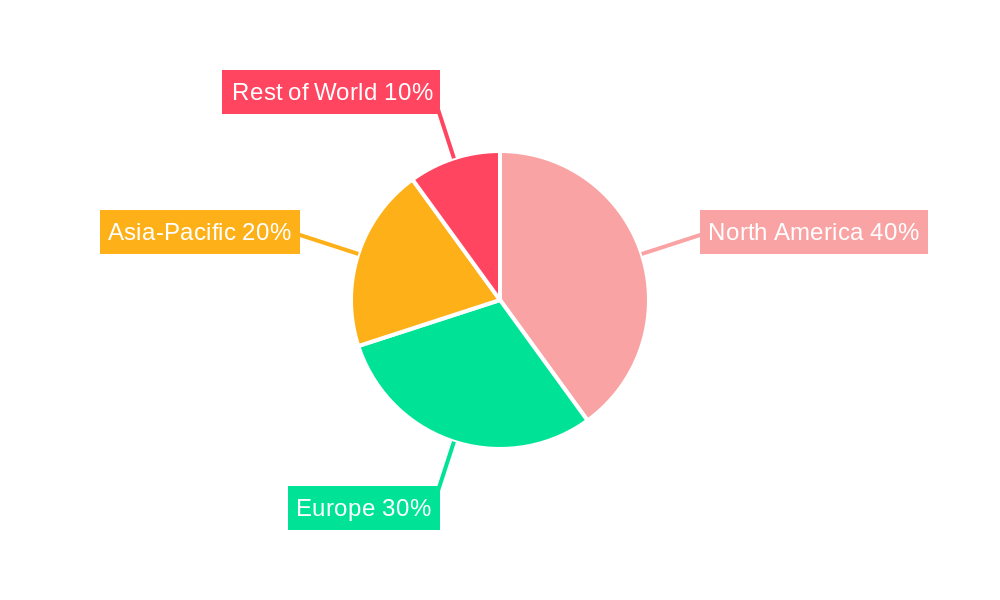
Dominant Regions & Segments in Blood Processing Devices
North America currently holds the dominant position in the blood processing devices market, driven by factors such as high healthcare expenditure, well-established healthcare infrastructure, and a strong regulatory framework encouraging technological innovation. Europe follows closely, while the Asia-Pacific region demonstrates significant growth potential owing to increasing healthcare expenditure and rising prevalence of chronic diseases.
- North America: High healthcare expenditure, robust infrastructure, strong regulatory environment.
- Europe: Well-established healthcare system, increasing demand for advanced blood processing devices.
- Asia-Pacific: Rapid economic growth, rising prevalence of chronic diseases, increasing healthcare investment.
Blood Processing Devices Product Innovations
Recent innovations include automated blood cell separators with improved efficiency and safety features, miniaturized devices for point-of-care applications, and integrated systems combining blood processing with diagnostic capabilities. These advancements address unmet clinical needs, enhancing efficiency and reducing the risk of human error. The market is also witnessing the integration of advanced analytics and data management capabilities, improving decision-making and optimizing resource allocation.
Report Scope & Segmentation Analysis
The report segments the blood processing devices market by product type (e.g., cell separators, plasmapheresis systems, blood component collection systems), application (e.g., blood transfusion, therapeutic apheresis), and end-user (e.g., hospitals, blood banks, research institutions). Each segment is analyzed in terms of market size, growth rate, and competitive landscape, providing detailed insights into market dynamics and future growth opportunities. For example, the automated cell separation segment is expected to exhibit the highest growth rate during the forecast period, driven by increasing demand for improved efficiency and safety.
Key Drivers of Blood Processing Devices Growth
The growth of the blood processing devices market is fueled by several key factors. Technological advancements resulting in improved device efficiency and safety are a major driver. Furthermore, the increasing prevalence of chronic diseases requiring blood transfusions and the growing geriatric population are boosting demand. Favorable regulatory policies promoting innovation and market access also contribute to market growth.
Challenges in the Blood Processing Devices Sector
Significant challenges exist, including the high cost of advanced devices limiting accessibility in resource-constrained settings. Complex regulatory pathways for new product approvals, along with supply chain disruptions impacting the availability of raw materials and components, pose significant hurdles. Intense competition among established players and the emergence of new entrants also present challenges. The impact of these factors can be seen in slower-than-expected market growth in specific regions.
Emerging Opportunities in Blood Processing Devices
Emerging opportunities lie in the development of point-of-care blood processing devices, expansion into untapped markets, and the integration of artificial intelligence and machine learning for improved diagnostics and automation. The increasing focus on personalized medicine and the growing demand for advanced blood management solutions present significant opportunities for growth.
Leading Players in the Blood Processing Devices Market
- Haemonetics
- Fresenius
- Terumo
- B. Braun Melsungen
- Macopharma
- Haier Biomedical
Key Developments in Blood Processing Devices Industry
- 2022 Q4: Haemonetics launched a new blood collection system.
- 2023 Q1: Fresenius acquired a smaller blood processing device company.
- 2023 Q2: Terumo announced a strategic partnership for distribution in a new market. (Further details would be added here based on actual events)
Future Outlook for Blood Processing Devices Market
The future outlook for the blood processing devices market remains positive, with sustained growth projected throughout the forecast period. Technological advancements, expanding applications, and increasing healthcare expenditure will drive market expansion. Strategic partnerships, acquisitions, and the development of innovative products will shape the competitive landscape, creating opportunities for both established players and new entrants.
Blood Processing Devices Segmentation
-
1. Application
- 1.1. Hospitals
- 1.2. Blood Banks
-
2. Types
- 2.1. Centrifuge
- 2.2. Blood Cell Processors
- 2.3. Blood Bank Freezers and Refrigerators
- 2.4. Blood Grouping Analyzers
Blood Processing Devices Segmentation By Geography
-
1. North America
- 1.1. United States
- 1.2. Canada
- 1.3. Mexico
-
2. South America
- 2.1. Brazil
- 2.2. Argentina
- 2.3. Rest of South America
-
3. Europe
- 3.1. United Kingdom
- 3.2. Germany
- 3.3. France
- 3.4. Italy
- 3.5. Spain
- 3.6. Russia
- 3.7. Benelux
- 3.8. Nordics
- 3.9. Rest of Europe
-
4. Middle East & Africa
- 4.1. Turkey
- 4.2. Israel
- 4.3. GCC
- 4.4. North Africa
- 4.5. South Africa
- 4.6. Rest of Middle East & Africa
-
5. Asia Pacific
- 5.1. China
- 5.2. India
- 5.3. Japan
- 5.4. South Korea
- 5.5. ASEAN
- 5.6. Oceania
- 5.7. Rest of Asia Pacific
Blood Processing Devices Regional Market Share
Geographic Coverage of Blood Processing Devices
Blood Processing Devices REPORT HIGHLIGHTS
| Aspects | Details |
|---|---|
| Study Period | 2020-2034 |
| Base Year | 2025 |
| Estimated Year | 2026 |
| Forecast Period | 2026-2034 |
| Historical Period | 2020-2025 |
| Growth Rate | CAGR of 6.5% from 2020-2034 |
| Segmentation |
|
Table of Contents
- 1. Introduction
- 1.1. Research Scope
- 1.2. Market Segmentation
- 1.3. Research Objective
- 1.4. Definitions and Assumptions
- 2. Executive Summary
- 2.1. Market Snapshot
- 3. Market Dynamics
- 3.1. Market Drivers
- 3.2. Market Restrains
- 3.3. Market Trends
- 3.4. Market Opportunities
- 4. Market Factor Analysis
- 4.1. Porters Five Forces
- 4.1.1. Bargaining Power of Suppliers
- 4.1.2. Bargaining Power of Buyers
- 4.1.3. Threat of New Entrants
- 4.1.4. Threat of Substitutes
- 4.1.5. Competitive Rivalry
- 4.2. PESTEL analysis
- 4.3. BCG Analysis
- 4.3.1. Stars (High Growth, High Market Share)
- 4.3.2. Cash Cows (Low Growth, High Market Share)
- 4.3.3. Question Mark (High Growth, Low Market Share)
- 4.3.4. Dogs (Low Growth, Low Market Share)
- 4.4. Ansoff Matrix Analysis
- 4.5. Supply Chain Analysis
- 4.6. Regulatory Landscape
- 4.7. Current Market Potential and Opportunity Assessment (TAM–SAM–SOM Framework)
- 4.8. PRI Analyst Note
- 4.1. Porters Five Forces
- 5. Market Analysis, Insights and Forecast 2021-2033
- 5.1. Market Analysis, Insights and Forecast - by Application
- 5.1.1. Hospitals
- 5.1.2. Blood Banks
- 5.2. Market Analysis, Insights and Forecast - by Types
- 5.2.1. Centrifuge
- 5.2.2. Blood Cell Processors
- 5.2.3. Blood Bank Freezers and Refrigerators
- 5.2.4. Blood Grouping Analyzers
- 5.3. Market Analysis, Insights and Forecast - by Region
- 5.3.1. North America
- 5.3.2. South America
- 5.3.3. Europe
- 5.3.4. Middle East & Africa
- 5.3.5. Asia Pacific
- 5.1. Market Analysis, Insights and Forecast - by Application
- 6. Global Blood Processing Devices Analysis, Insights and Forecast, 2021-2033
- 6.1. Market Analysis, Insights and Forecast - by Application
- 6.1.1. Hospitals
- 6.1.2. Blood Banks
- 6.2. Market Analysis, Insights and Forecast - by Types
- 6.2.1. Centrifuge
- 6.2.2. Blood Cell Processors
- 6.2.3. Blood Bank Freezers and Refrigerators
- 6.2.4. Blood Grouping Analyzers
- 6.1. Market Analysis, Insights and Forecast - by Application
- 7. North America Blood Processing Devices Analysis, Insights and Forecast, 2020-2032
- 7.1. Market Analysis, Insights and Forecast - by Application
- 7.1.1. Hospitals
- 7.1.2. Blood Banks
- 7.2. Market Analysis, Insights and Forecast - by Types
- 7.2.1. Centrifuge
- 7.2.2. Blood Cell Processors
- 7.2.3. Blood Bank Freezers and Refrigerators
- 7.2.4. Blood Grouping Analyzers
- 7.1. Market Analysis, Insights and Forecast - by Application
- 8. South America Blood Processing Devices Analysis, Insights and Forecast, 2020-2032
- 8.1. Market Analysis, Insights and Forecast - by Application
- 8.1.1. Hospitals
- 8.1.2. Blood Banks
- 8.2. Market Analysis, Insights and Forecast - by Types
- 8.2.1. Centrifuge
- 8.2.2. Blood Cell Processors
- 8.2.3. Blood Bank Freezers and Refrigerators
- 8.2.4. Blood Grouping Analyzers
- 8.1. Market Analysis, Insights and Forecast - by Application
- 9. Europe Blood Processing Devices Analysis, Insights and Forecast, 2020-2032
- 9.1. Market Analysis, Insights and Forecast - by Application
- 9.1.1. Hospitals
- 9.1.2. Blood Banks
- 9.2. Market Analysis, Insights and Forecast - by Types
- 9.2.1. Centrifuge
- 9.2.2. Blood Cell Processors
- 9.2.3. Blood Bank Freezers and Refrigerators
- 9.2.4. Blood Grouping Analyzers
- 9.1. Market Analysis, Insights and Forecast - by Application
- 10. Middle East & Africa Blood Processing Devices Analysis, Insights and Forecast, 2020-2032
- 10.1. Market Analysis, Insights and Forecast - by Application
- 10.1.1. Hospitals
- 10.1.2. Blood Banks
- 10.2. Market Analysis, Insights and Forecast - by Types
- 10.2.1. Centrifuge
- 10.2.2. Blood Cell Processors
- 10.2.3. Blood Bank Freezers and Refrigerators
- 10.2.4. Blood Grouping Analyzers
- 10.1. Market Analysis, Insights and Forecast - by Application
- 11. Asia Pacific Blood Processing Devices Analysis, Insights and Forecast, 2020-2032
- 11.1. Market Analysis, Insights and Forecast - by Application
- 11.1.1. Hospitals
- 11.1.2. Blood Banks
- 11.2. Market Analysis, Insights and Forecast - by Types
- 11.2.1. Centrifuge
- 11.2.2. Blood Cell Processors
- 11.2.3. Blood Bank Freezers and Refrigerators
- 11.2.4. Blood Grouping Analyzers
- 11.1. Market Analysis, Insights and Forecast - by Application
- 12. Competitive Analysis
- 12.1. Company Profiles
- 12.1.1 Haemonetics
- 12.1.1.1. Company Overview
- 12.1.1.2. Products
- 12.1.1.3. Company Financials
- 12.1.1.4. SWOT Analysis
- 12.1.2 Fresenius
- 12.1.2.1. Company Overview
- 12.1.2.2. Products
- 12.1.2.3. Company Financials
- 12.1.2.4. SWOT Analysis
- 12.1.3 Terumo
- 12.1.3.1. Company Overview
- 12.1.3.2. Products
- 12.1.3.3. Company Financials
- 12.1.3.4. SWOT Analysis
- 12.1.4 B. Braun Melsungen
- 12.1.4.1. Company Overview
- 12.1.4.2. Products
- 12.1.4.3. Company Financials
- 12.1.4.4. SWOT Analysis
- 12.1.5 Macopharma
- 12.1.5.1. Company Overview
- 12.1.5.2. Products
- 12.1.5.3. Company Financials
- 12.1.5.4. SWOT Analysis
- 12.1.6 Haier Biomedical
- 12.1.6.1. Company Overview
- 12.1.6.2. Products
- 12.1.6.3. Company Financials
- 12.1.6.4. SWOT Analysis
- 12.1.1 Haemonetics
- 12.2. Market Entropy
- 12.2.1 Company's Key Areas Served
- 12.2.2 Recent Developments
- 12.3. Company Market Share Analysis 2025
- 12.3.1 Top 5 Companies Market Share Analysis
- 12.3.2 Top 3 Companies Market Share Analysis
- 12.4. List of Potential Customers
- 13. Research Methodology
List of Figures
- Figure 1: Global Blood Processing Devices Revenue Breakdown (undefined, %) by Region 2025 & 2033
- Figure 2: Global Blood Processing Devices Volume Breakdown (K, %) by Region 2025 & 2033
- Figure 3: North America Blood Processing Devices Revenue (undefined), by Application 2025 & 2033
- Figure 4: North America Blood Processing Devices Volume (K), by Application 2025 & 2033
- Figure 5: North America Blood Processing Devices Revenue Share (%), by Application 2025 & 2033
- Figure 6: North America Blood Processing Devices Volume Share (%), by Application 2025 & 2033
- Figure 7: North America Blood Processing Devices Revenue (undefined), by Types 2025 & 2033
- Figure 8: North America Blood Processing Devices Volume (K), by Types 2025 & 2033
- Figure 9: North America Blood Processing Devices Revenue Share (%), by Types 2025 & 2033
- Figure 10: North America Blood Processing Devices Volume Share (%), by Types 2025 & 2033
- Figure 11: North America Blood Processing Devices Revenue (undefined), by Country 2025 & 2033
- Figure 12: North America Blood Processing Devices Volume (K), by Country 2025 & 2033
- Figure 13: North America Blood Processing Devices Revenue Share (%), by Country 2025 & 2033
- Figure 14: North America Blood Processing Devices Volume Share (%), by Country 2025 & 2033
- Figure 15: South America Blood Processing Devices Revenue (undefined), by Application 2025 & 2033
- Figure 16: South America Blood Processing Devices Volume (K), by Application 2025 & 2033
- Figure 17: South America Blood Processing Devices Revenue Share (%), by Application 2025 & 2033
- Figure 18: South America Blood Processing Devices Volume Share (%), by Application 2025 & 2033
- Figure 19: South America Blood Processing Devices Revenue (undefined), by Types 2025 & 2033
- Figure 20: South America Blood Processing Devices Volume (K), by Types 2025 & 2033
- Figure 21: South America Blood Processing Devices Revenue Share (%), by Types 2025 & 2033
- Figure 22: South America Blood Processing Devices Volume Share (%), by Types 2025 & 2033
- Figure 23: South America Blood Processing Devices Revenue (undefined), by Country 2025 & 2033
- Figure 24: South America Blood Processing Devices Volume (K), by Country 2025 & 2033
- Figure 25: South America Blood Processing Devices Revenue Share (%), by Country 2025 & 2033
- Figure 26: South America Blood Processing Devices Volume Share (%), by Country 2025 & 2033
- Figure 27: Europe Blood Processing Devices Revenue (undefined), by Application 2025 & 2033
- Figure 28: Europe Blood Processing Devices Volume (K), by Application 2025 & 2033
- Figure 29: Europe Blood Processing Devices Revenue Share (%), by Application 2025 & 2033
- Figure 30: Europe Blood Processing Devices Volume Share (%), by Application 2025 & 2033
- Figure 31: Europe Blood Processing Devices Revenue (undefined), by Types 2025 & 2033
- Figure 32: Europe Blood Processing Devices Volume (K), by Types 2025 & 2033
- Figure 33: Europe Blood Processing Devices Revenue Share (%), by Types 2025 & 2033
- Figure 34: Europe Blood Processing Devices Volume Share (%), by Types 2025 & 2033
- Figure 35: Europe Blood Processing Devices Revenue (undefined), by Country 2025 & 2033
- Figure 36: Europe Blood Processing Devices Volume (K), by Country 2025 & 2033
- Figure 37: Europe Blood Processing Devices Revenue Share (%), by Country 2025 & 2033
- Figure 38: Europe Blood Processing Devices Volume Share (%), by Country 2025 & 2033
- Figure 39: Middle East & Africa Blood Processing Devices Revenue (undefined), by Application 2025 & 2033
- Figure 40: Middle East & Africa Blood Processing Devices Volume (K), by Application 2025 & 2033
- Figure 41: Middle East & Africa Blood Processing Devices Revenue Share (%), by Application 2025 & 2033
- Figure 42: Middle East & Africa Blood Processing Devices Volume Share (%), by Application 2025 & 2033
- Figure 43: Middle East & Africa Blood Processing Devices Revenue (undefined), by Types 2025 & 2033
- Figure 44: Middle East & Africa Blood Processing Devices Volume (K), by Types 2025 & 2033
- Figure 45: Middle East & Africa Blood Processing Devices Revenue Share (%), by Types 2025 & 2033
- Figure 46: Middle East & Africa Blood Processing Devices Volume Share (%), by Types 2025 & 2033
- Figure 47: Middle East & Africa Blood Processing Devices Revenue (undefined), by Country 2025 & 2033
- Figure 48: Middle East & Africa Blood Processing Devices Volume (K), by Country 2025 & 2033
- Figure 49: Middle East & Africa Blood Processing Devices Revenue Share (%), by Country 2025 & 2033
- Figure 50: Middle East & Africa Blood Processing Devices Volume Share (%), by Country 2025 & 2033
- Figure 51: Asia Pacific Blood Processing Devices Revenue (undefined), by Application 2025 & 2033
- Figure 52: Asia Pacific Blood Processing Devices Volume (K), by Application 2025 & 2033
- Figure 53: Asia Pacific Blood Processing Devices Revenue Share (%), by Application 2025 & 2033
- Figure 54: Asia Pacific Blood Processing Devices Volume Share (%), by Application 2025 & 2033
- Figure 55: Asia Pacific Blood Processing Devices Revenue (undefined), by Types 2025 & 2033
- Figure 56: Asia Pacific Blood Processing Devices Volume (K), by Types 2025 & 2033
- Figure 57: Asia Pacific Blood Processing Devices Revenue Share (%), by Types 2025 & 2033
- Figure 58: Asia Pacific Blood Processing Devices Volume Share (%), by Types 2025 & 2033
- Figure 59: Asia Pacific Blood Processing Devices Revenue (undefined), by Country 2025 & 2033
- Figure 60: Asia Pacific Blood Processing Devices Volume (K), by Country 2025 & 2033
- Figure 61: Asia Pacific Blood Processing Devices Revenue Share (%), by Country 2025 & 2033
- Figure 62: Asia Pacific Blood Processing Devices Volume Share (%), by Country 2025 & 2033
List of Tables
- Table 1: Global Blood Processing Devices Revenue undefined Forecast, by Application 2020 & 2033
- Table 2: Global Blood Processing Devices Volume K Forecast, by Application 2020 & 2033
- Table 3: Global Blood Processing Devices Revenue undefined Forecast, by Types 2020 & 2033
- Table 4: Global Blood Processing Devices Volume K Forecast, by Types 2020 & 2033
- Table 5: Global Blood Processing Devices Revenue undefined Forecast, by Region 2020 & 2033
- Table 6: Global Blood Processing Devices Volume K Forecast, by Region 2020 & 2033
- Table 7: Global Blood Processing Devices Revenue undefined Forecast, by Application 2020 & 2033
- Table 8: Global Blood Processing Devices Volume K Forecast, by Application 2020 & 2033
- Table 9: Global Blood Processing Devices Revenue undefined Forecast, by Types 2020 & 2033
- Table 10: Global Blood Processing Devices Volume K Forecast, by Types 2020 & 2033
- Table 11: Global Blood Processing Devices Revenue undefined Forecast, by Country 2020 & 2033
- Table 12: Global Blood Processing Devices Volume K Forecast, by Country 2020 & 2033
- Table 13: United States Blood Processing Devices Revenue (undefined) Forecast, by Application 2020 & 2033
- Table 14: United States Blood Processing Devices Volume (K) Forecast, by Application 2020 & 2033
- Table 15: Canada Blood Processing Devices Revenue (undefined) Forecast, by Application 2020 & 2033
- Table 16: Canada Blood Processing Devices Volume (K) Forecast, by Application 2020 & 2033
- Table 17: Mexico Blood Processing Devices Revenue (undefined) Forecast, by Application 2020 & 2033
- Table 18: Mexico Blood Processing Devices Volume (K) Forecast, by Application 2020 & 2033
- Table 19: Global Blood Processing Devices Revenue undefined Forecast, by Application 2020 & 2033
- Table 20: Global Blood Processing Devices Volume K Forecast, by Application 2020 & 2033
- Table 21: Global Blood Processing Devices Revenue undefined Forecast, by Types 2020 & 2033
- Table 22: Global Blood Processing Devices Volume K Forecast, by Types 2020 & 2033
- Table 23: Global Blood Processing Devices Revenue undefined Forecast, by Country 2020 & 2033
- Table 24: Global Blood Processing Devices Volume K Forecast, by Country 2020 & 2033
- Table 25: Brazil Blood Processing Devices Revenue (undefined) Forecast, by Application 2020 & 2033
- Table 26: Brazil Blood Processing Devices Volume (K) Forecast, by Application 2020 & 2033
- Table 27: Argentina Blood Processing Devices Revenue (undefined) Forecast, by Application 2020 & 2033
- Table 28: Argentina Blood Processing Devices Volume (K) Forecast, by Application 2020 & 2033
- Table 29: Rest of South America Blood Processing Devices Revenue (undefined) Forecast, by Application 2020 & 2033
- Table 30: Rest of South America Blood Processing Devices Volume (K) Forecast, by Application 2020 & 2033
- Table 31: Global Blood Processing Devices Revenue undefined Forecast, by Application 2020 & 2033
- Table 32: Global Blood Processing Devices Volume K Forecast, by Application 2020 & 2033
- Table 33: Global Blood Processing Devices Revenue undefined Forecast, by Types 2020 & 2033
- Table 34: Global Blood Processing Devices Volume K Forecast, by Types 2020 & 2033
- Table 35: Global Blood Processing Devices Revenue undefined Forecast, by Country 2020 & 2033
- Table 36: Global Blood Processing Devices Volume K Forecast, by Country 2020 & 2033
- Table 37: United Kingdom Blood Processing Devices Revenue (undefined) Forecast, by Application 2020 & 2033
- Table 38: United Kingdom Blood Processing Devices Volume (K) Forecast, by Application 2020 & 2033
- Table 39: Germany Blood Processing Devices Revenue (undefined) Forecast, by Application 2020 & 2033
- Table 40: Germany Blood Processing Devices Volume (K) Forecast, by Application 2020 & 2033
- Table 41: France Blood Processing Devices Revenue (undefined) Forecast, by Application 2020 & 2033
- Table 42: France Blood Processing Devices Volume (K) Forecast, by Application 2020 & 2033
- Table 43: Italy Blood Processing Devices Revenue (undefined) Forecast, by Application 2020 & 2033
- Table 44: Italy Blood Processing Devices Volume (K) Forecast, by Application 2020 & 2033
- Table 45: Spain Blood Processing Devices Revenue (undefined) Forecast, by Application 2020 & 2033
- Table 46: Spain Blood Processing Devices Volume (K) Forecast, by Application 2020 & 2033
- Table 47: Russia Blood Processing Devices Revenue (undefined) Forecast, by Application 2020 & 2033
- Table 48: Russia Blood Processing Devices Volume (K) Forecast, by Application 2020 & 2033
- Table 49: Benelux Blood Processing Devices Revenue (undefined) Forecast, by Application 2020 & 2033
- Table 50: Benelux Blood Processing Devices Volume (K) Forecast, by Application 2020 & 2033
- Table 51: Nordics Blood Processing Devices Revenue (undefined) Forecast, by Application 2020 & 2033
- Table 52: Nordics Blood Processing Devices Volume (K) Forecast, by Application 2020 & 2033
- Table 53: Rest of Europe Blood Processing Devices Revenue (undefined) Forecast, by Application 2020 & 2033
- Table 54: Rest of Europe Blood Processing Devices Volume (K) Forecast, by Application 2020 & 2033
- Table 55: Global Blood Processing Devices Revenue undefined Forecast, by Application 2020 & 2033
- Table 56: Global Blood Processing Devices Volume K Forecast, by Application 2020 & 2033
- Table 57: Global Blood Processing Devices Revenue undefined Forecast, by Types 2020 & 2033
- Table 58: Global Blood Processing Devices Volume K Forecast, by Types 2020 & 2033
- Table 59: Global Blood Processing Devices Revenue undefined Forecast, by Country 2020 & 2033
- Table 60: Global Blood Processing Devices Volume K Forecast, by Country 2020 & 2033
- Table 61: Turkey Blood Processing Devices Revenue (undefined) Forecast, by Application 2020 & 2033
- Table 62: Turkey Blood Processing Devices Volume (K) Forecast, by Application 2020 & 2033
- Table 63: Israel Blood Processing Devices Revenue (undefined) Forecast, by Application 2020 & 2033
- Table 64: Israel Blood Processing Devices Volume (K) Forecast, by Application 2020 & 2033
- Table 65: GCC Blood Processing Devices Revenue (undefined) Forecast, by Application 2020 & 2033
- Table 66: GCC Blood Processing Devices Volume (K) Forecast, by Application 2020 & 2033
- Table 67: North Africa Blood Processing Devices Revenue (undefined) Forecast, by Application 2020 & 2033
- Table 68: North Africa Blood Processing Devices Volume (K) Forecast, by Application 2020 & 2033
- Table 69: South Africa Blood Processing Devices Revenue (undefined) Forecast, by Application 2020 & 2033
- Table 70: South Africa Blood Processing Devices Volume (K) Forecast, by Application 2020 & 2033
- Table 71: Rest of Middle East & Africa Blood Processing Devices Revenue (undefined) Forecast, by Application 2020 & 2033
- Table 72: Rest of Middle East & Africa Blood Processing Devices Volume (K) Forecast, by Application 2020 & 2033
- Table 73: Global Blood Processing Devices Revenue undefined Forecast, by Application 2020 & 2033
- Table 74: Global Blood Processing Devices Volume K Forecast, by Application 2020 & 2033
- Table 75: Global Blood Processing Devices Revenue undefined Forecast, by Types 2020 & 2033
- Table 76: Global Blood Processing Devices Volume K Forecast, by Types 2020 & 2033
- Table 77: Global Blood Processing Devices Revenue undefined Forecast, by Country 2020 & 2033
- Table 78: Global Blood Processing Devices Volume K Forecast, by Country 2020 & 2033
- Table 79: China Blood Processing Devices Revenue (undefined) Forecast, by Application 2020 & 2033
- Table 80: China Blood Processing Devices Volume (K) Forecast, by Application 2020 & 2033
- Table 81: India Blood Processing Devices Revenue (undefined) Forecast, by Application 2020 & 2033
- Table 82: India Blood Processing Devices Volume (K) Forecast, by Application 2020 & 2033
- Table 83: Japan Blood Processing Devices Revenue (undefined) Forecast, by Application 2020 & 2033
- Table 84: Japan Blood Processing Devices Volume (K) Forecast, by Application 2020 & 2033
- Table 85: South Korea Blood Processing Devices Revenue (undefined) Forecast, by Application 2020 & 2033
- Table 86: South Korea Blood Processing Devices Volume (K) Forecast, by Application 2020 & 2033
- Table 87: ASEAN Blood Processing Devices Revenue (undefined) Forecast, by Application 2020 & 2033
- Table 88: ASEAN Blood Processing Devices Volume (K) Forecast, by Application 2020 & 2033
- Table 89: Oceania Blood Processing Devices Revenue (undefined) Forecast, by Application 2020 & 2033
- Table 90: Oceania Blood Processing Devices Volume (K) Forecast, by Application 2020 & 2033
- Table 91: Rest of Asia Pacific Blood Processing Devices Revenue (undefined) Forecast, by Application 2020 & 2033
- Table 92: Rest of Asia Pacific Blood Processing Devices Volume (K) Forecast, by Application 2020 & 2033
Frequently Asked Questions
1. What is the projected Compound Annual Growth Rate (CAGR) of the Blood Processing Devices?
The projected CAGR is approximately 6.5%.
2. Which companies are prominent players in the Blood Processing Devices?
Key companies in the market include Haemonetics, Fresenius, Terumo, B. Braun Melsungen, Macopharma, Haier Biomedical.
3. What are the main segments of the Blood Processing Devices?
The market segments include Application, Types.
4. Can you provide details about the market size?
The market size is estimated to be USD XXX N/A as of 2022.
5. What are some drivers contributing to market growth?
N/A
6. What are the notable trends driving market growth?
N/A
7. Are there any restraints impacting market growth?
N/A
8. Can you provide examples of recent developments in the market?
N/A
9. What pricing options are available for accessing the report?
Pricing options include single-user, multi-user, and enterprise licenses priced at USD 3950.00, USD 5925.00, and USD 7900.00 respectively.
10. Is the market size provided in terms of value or volume?
The market size is provided in terms of value, measured in N/A and volume, measured in K.
11. Are there any specific market keywords associated with the report?
Yes, the market keyword associated with the report is "Blood Processing Devices," which aids in identifying and referencing the specific market segment covered.
12. How do I determine which pricing option suits my needs best?
The pricing options vary based on user requirements and access needs. Individual users may opt for single-user licenses, while businesses requiring broader access may choose multi-user or enterprise licenses for cost-effective access to the report.
13. Are there any additional resources or data provided in the Blood Processing Devices report?
While the report offers comprehensive insights, it's advisable to review the specific contents or supplementary materials provided to ascertain if additional resources or data are available.
14. How can I stay updated on further developments or reports in the Blood Processing Devices?
To stay informed about further developments, trends, and reports in the Blood Processing Devices, consider subscribing to industry newsletters, following relevant companies and organizations, or regularly checking reputable industry news sources and publications.
Methodology
Step 1 - Identification of Relevant Samples Size from Population Database


Step 2 - Approaches for Defining Global Market Size (Value, Volume* & Price*)

Note*: In applicable scenarios
Step 3 - Data Sources
Primary Research
- Web Analytics
- Survey Reports
- Research Institute
- Latest Research Reports
- Opinion Leaders
Secondary Research
- Annual Reports
- White Paper
- Latest Press Release
- Industry Association
- Paid Database
- Investor Presentations

Step 4 - Data Triangulation
Involves using different sources of information in order to increase the validity of a study
These sources are likely to be stakeholders in a program - participants, other researchers, program staff, other community members, and so on.
Then we put all data in single framework & apply various statistical tools to find out the dynamic on the market.
During the analysis stage, feedback from the stakeholder groups would be compared to determine areas of agreement as well as areas of divergence