
Key Insights
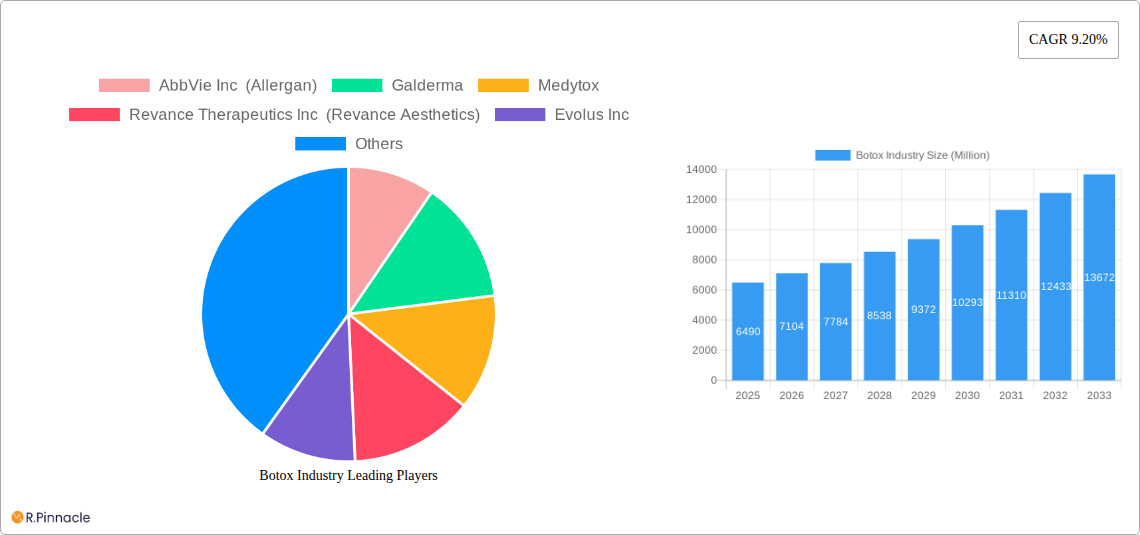
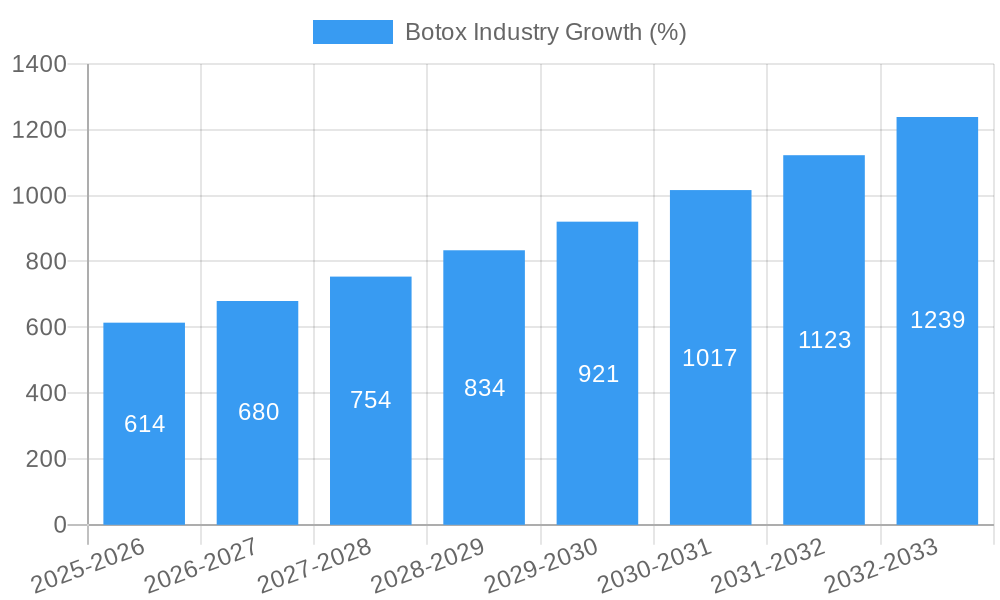
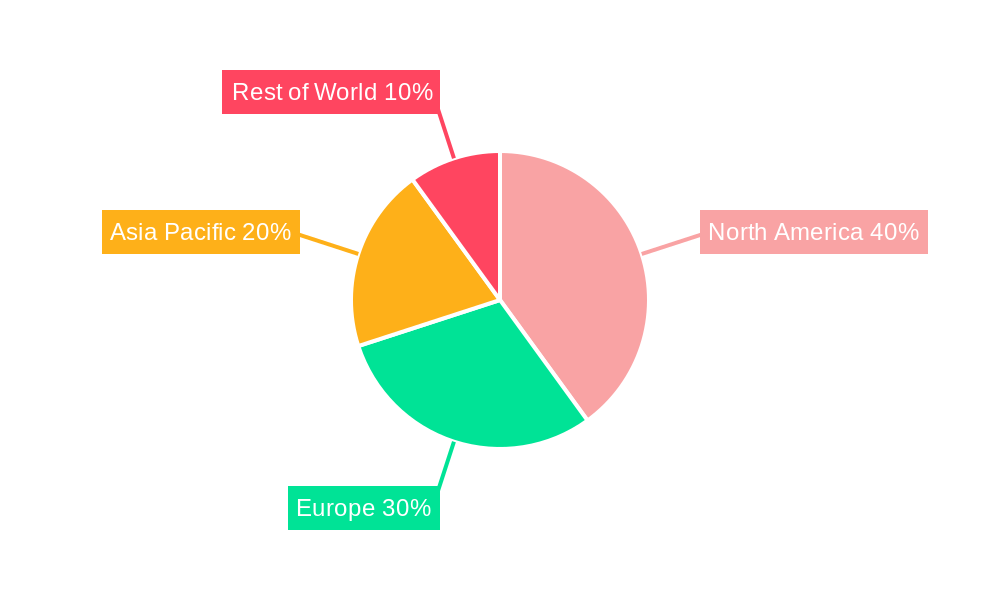
The global Botox market, valued at $6.49 billion in 2025, is projected to experience robust growth, driven by increasing demand for aesthetic procedures and a rising geriatric population susceptible to neurological conditions treatable with Botox. The 9.20% CAGR indicates a significant expansion over the forecast period (2025-2033). Key growth drivers include the rising prevalence of wrinkles and age-related concerns among consumers, coupled with increasing disposable incomes and a surge in non-surgical cosmetic procedures globally. Technological advancements leading to improved formulations and minimally invasive delivery methods also fuel market expansion. Market segmentation reveals a strong dominance of cosmetic applications, specifically within spas and beauty centers. However, growth is anticipated across all segments, with the non-cosmetic applications segment (treating conditions like migraines and hyperhidrosis) demonstrating considerable potential. Competitive rivalry is intense among established players such as AbbVie Inc (Allergan), Galderma, and Merz Pharma, with smaller companies also contributing to innovation and market expansion. Geographical analysis suggests North America and Europe hold a significant market share currently, but the Asia-Pacific region is poised for accelerated growth due to increasing awareness and acceptance of aesthetic procedures.
The Botox market's future trajectory is positive, influenced by factors such as ongoing research and development into new applications, a growing preference for non-invasive treatments, and the increasing availability of Botox in emerging markets. However, potential restraints include regulatory hurdles in certain regions, the risk of adverse effects associated with Botox injections, and the emergence of alternative aesthetic treatments. Companies must focus on strategic collaborations, product innovation, and expansion into untapped markets to maintain a competitive edge and capitalize on the expanding market opportunities. Successful strategies will involve effective marketing campaigns highlighting safety and efficacy alongside diversifying product portfolios to cater to various application needs and geographical demands.
Botox Industry Market Report: 2019-2033
This comprehensive report provides an in-depth analysis of the global Botox industry, projecting a market valuation exceeding $XX Billion by 2033. The report covers the period from 2019 to 2033, with 2025 serving as the base and estimated year. This crucial resource offers actionable insights for industry professionals, investors, and stakeholders seeking to navigate this dynamic market. Leveraging a robust methodology and extensive data analysis, the report delivers a clear picture of market trends, competitive landscapes, and future growth potential.
Botox Industry Market Structure & Innovation Trends
The global Botox market is moderately consolidated, with key players such as AbbVie Inc (Allergan), Galderma, and Merz Pharma GmbH & Co KGaA holding significant market share. However, emerging players like Revance Therapeutics and Evolus are steadily increasing their presence, driving competitive innovation. The market is characterized by high regulatory scrutiny, necessitating significant investment in research and development (R&D) for new product approvals and formulations. The constant drive for efficacy, safety, and patient experience fuels innovation, leading to novel delivery systems and expanded therapeutic applications beyond cosmetic treatments.
- Market Concentration: The top three players hold approximately XX% of the market share in 2025.
- Innovation Drivers: Increasing demand for minimally invasive cosmetic procedures, the development of long-lasting formulations, and expansion into therapeutic applications.
- Regulatory Frameworks: Stringent regulatory pathways increase the barrier to entry for new players and shape the product lifecycle.
- Product Substitutes: Limited effective substitutes exist for Botox in its primary applications, creating a high barrier to entry.
- End-User Demographics: A growing aging population and rising disposable incomes in key markets drive the demand for Botox treatments.
- M&A Activities: Significant M&A activity has been observed over the past five years, with deal values exceeding $XX Billion. These acquisitions often aim to enhance product portfolios and expand market reach.
Botox Industry Market Dynamics & Trends
The Botox market is experiencing robust growth, driven by several key factors. The rising prevalence of age-related aesthetic concerns among an aging global population is a primary driver. Technological advancements, including improved formulation and delivery methods, have enhanced the efficacy and safety profile of Botox treatments, leading to increased consumer acceptance. Changing consumer preferences, with a focus on minimally invasive cosmetic procedures, are also contributing to market expansion. Moreover, the increasing use of Botox in therapeutic applications such as the treatment of hyperhidrosis and migraine further fuels the growth momentum. The global market is projected to experience a compound annual growth rate (CAGR) of XX% during the forecast period (2025-2033). Market penetration in developing countries remains significant growth opportunities. Competitive dynamics are fierce, with existing players investing heavily in R&D and marketing to maintain their market share.
Dominant Regions & Segments in Botox Industry
North America currently dominates the global Botox market, driven by high per capita disposable income, increased awareness of aesthetic procedures, and a well-established healthcare infrastructure. Within applications, cosmetic applications constitute the largest segment, followed by other medical applications. Clinics and hospitals remain the dominant end-users, though spas and beauty centers are experiencing rapid growth.
- Key Drivers in North America: High disposable income, advanced healthcare infrastructure, and high awareness levels of cosmetic procedures.
- Cosmetic Applications: This segment is characterized by high growth due to increasing consumer demand for non-surgical aesthetic enhancement.
- Non-cosmetic Applications: While smaller than cosmetic applications, this segment shows promising growth potential with expanding therapeutic applications of Botox.
- Clinics and Hospitals: These settings provide the necessary expertise and infrastructure for safe and effective Botox administration.
- Spas and Beauty Centers: This segment shows strong growth potential due to increasing accessibility and affordability of treatment.
Botox Industry Product Innovations
Recent innovations focus on extended duration formulations, improved delivery systems (e.g., micro-needling), and expansion into novel therapeutic areas. Companies are actively developing next-generation products that offer improved efficacy, safety, and patient convenience. These innovations cater to the growing demand for non-invasive and effective cosmetic and therapeutic solutions. The market continues to witness the development of products with extended duration and improved targeting capabilities.
Report Scope & Segmentation Analysis
This report segments the Botox market by application (Cosmetic Applications, Other Cosmetic Applications, Non-cosmetic Applications) and by end-user (Spas and Beauty Centers, Clinics and Hospitals). Each segment provides detailed market size estimations, growth projections, and competitive analysis for the forecast period (2025-2033). The report extensively analyses the competitive dynamics within each segment, identifying key players, market share, and strategies.
- Cosmetic Applications: This segment is expected to witness a CAGR of XX% during the forecast period.
- Other Cosmetic Applications: This segment includes treatments like hyperhidrosis and is expected to experience a CAGR of XX%.
- Non-cosmetic Applications: Market size for this segment is projected to reach $XX Billion by 2033.
- Spas and Beauty Centers: This segment's market size will reach $XX Billion in 2033.
- Clinics and Hospitals: This segment's market is projected at $XX Billion by 2033.
Key Drivers of Botox Industry Growth
The growth of the Botox industry is propelled by several factors: the increasing aging population globally demanding anti-aging solutions, rising disposable incomes enabling access to premium aesthetic treatments, and the expanding therapeutic applications of Botox in diverse medical fields. Furthermore, technological advancements leading to improved formulations and enhanced delivery systems fuel market expansion.
Challenges in the Botox Industry Sector
The Botox industry faces challenges such as stringent regulatory approvals, potential supply chain disruptions affecting raw material availability, and intense competition among established and emerging players. Price competition and the risk of counterfeit products also pose considerable threats. These challenges can lead to variations in product availability and market stability.
Emerging Opportunities in Botox Industry
Emerging opportunities include expansion into untapped markets, particularly in developing economies with growing middle classes. The development of novel formulations with longer-lasting effects and the exploration of new therapeutic applications represent significant growth avenues. Additionally, personalized treatment options tailored to individual patient needs are expected to create new market segments.
Leading Players in the Botox Industry Market
- AbbVie Inc (Allergan)
- Galderma
- Medytox
- Revance Therapeutics Inc (Revance Aesthetics)
- Evolus Inc
- Hughes
- Merz Pharma GmbH & Co KGaA
- Daewoong Pharmaceuticals
- Eisai
- Ipsen Biopharmaceuticals Inc
- HUGEL
- USWM LLC
Key Developments in Botox Industry Industry
- March 2024: Hugel America Inc. announced US FDA approval of Letybo (Neurotoxin) for moderate-to-severe glabellar lines.
- October 2023: Huadong Medicine Aesthetics Investment (HongKong) Limited (Sinclair) formed a global license agreement with ATGC Co. Ltd for ATGC-110 (botulinum toxin).
Future Outlook for Botox Industry Market
The Botox industry is poised for continued growth, driven by increasing demand for aesthetic and therapeutic treatments. The focus on innovation, particularly in extended duration formulations and novel applications, will further fuel market expansion. Strategic partnerships and acquisitions will likely shape the competitive landscape. The market anticipates sustained growth, supported by favorable demographic trends and technological advancements.
Botox Industry Segmentation
-
1. Application
-
1.1. Cosmetic Applications
- 1.1.1. Glabellar Lines
- 1.1.2. Lateral Canthal Lines (Crow's Feet)
- 1.1.3. Forehead Lines
- 1.1.4. Other Cosmetic Applications
-
1.2. Non-cosmetic Applications
- 1.2.1. Dystonia
- 1.2.2. Chronic Migraine
- 1.2.3. Ophthalmologic Disorders
- 1.2.4. Other Non-cosmetic Applications
-
1.1. Cosmetic Applications
-
2. End User
- 2.1. Spas and Beauty Centers
- 2.2. Clinics and Hospitals
Botox Industry Segmentation By Geography
-
1. North America
- 1.1. United States
- 1.2. Canada
- 1.3. Mexico
-
2. Europe
- 2.1. Germany
- 2.2. United Kingdom
- 2.3. France
- 2.4. Italy
- 2.5. Spain
- 2.6. Rest of Europe
-
3. Asia Pacific
- 3.1. China
- 3.2. Japan
- 3.3. India
- 3.4. Australia
- 3.5. South Korea
- 3.6. Rest of Asia Pacific
-
4. Middle East and Africa
- 4.1. GCC
- 4.2. South Africa
- 4.3. Rest of Middle East and Africa
-
5. South America
- 5.1. Brazil
- 5.2. Argentina
- 5.3. Rest of South America
Botox Industry REPORT HIGHLIGHTS
| Aspects | Details |
|---|---|
| Study Period | 2019-2033 |
| Base Year | 2024 |
| Estimated Year | 2025 |
| Forecast Period | 2025-2033 |
| Historical Period | 2019-2024 |
| Growth Rate | CAGR of 9.20% from 2019-2033 |
| Segmentation |
|
Table of Contents
- 1. Introduction
- 1.1. Research Scope
- 1.2. Market Segmentation
- 1.3. Research Methodology
- 1.4. Definitions and Assumptions
- 2. Executive Summary
- 2.1. Introduction
- 3. Market Dynamics
- 3.1. Introduction
- 3.2. Market Drivers
- 3.2.1. Increasing Demand for Aesthetic Procedures; Growing Research and Development Initiatives to Expand the Therapeutic Applications of Botulinum Toxin
- 3.3. Market Restrains
- 3.3.1. Adverse Effects Associated with Botulinum Toxin; Lack of Reimbursement Policies Supporting Cosmetic Procedures
- 3.4. Market Trends
- 3.4.1. Glabellar Lines Segment is Expected to Hold Significant Share in the Market Over the Forecast Period
- 4. Market Factor Analysis
- 4.1. Porters Five Forces
- 4.2. Supply/Value Chain
- 4.3. PESTEL analysis
- 4.4. Market Entropy
- 4.5. Patent/Trademark Analysis
- 5. Global Botox Industry Analysis, Insights and Forecast, 2019-2031
- 5.1. Market Analysis, Insights and Forecast - by Application
- 5.1.1. Cosmetic Applications
- 5.1.1.1. Glabellar Lines
- 5.1.1.2. Lateral Canthal Lines (Crow's Feet)
- 5.1.1.3. Forehead Lines
- 5.1.1.4. Other Cosmetic Applications
- 5.1.2. Non-cosmetic Applications
- 5.1.2.1. Dystonia
- 5.1.2.2. Chronic Migraine
- 5.1.2.3. Ophthalmologic Disorders
- 5.1.2.4. Other Non-cosmetic Applications
- 5.1.1. Cosmetic Applications
- 5.2. Market Analysis, Insights and Forecast - by End User
- 5.2.1. Spas and Beauty Centers
- 5.2.2. Clinics and Hospitals
- 5.3. Market Analysis, Insights and Forecast - by Region
- 5.3.1. North America
- 5.3.2. Europe
- 5.3.3. Asia Pacific
- 5.3.4. Middle East and Africa
- 5.3.5. South America
- 5.1. Market Analysis, Insights and Forecast - by Application
- 6. North America Botox Industry Analysis, Insights and Forecast, 2019-2031
- 6.1. Market Analysis, Insights and Forecast - by Application
- 6.1.1. Cosmetic Applications
- 6.1.1.1. Glabellar Lines
- 6.1.1.2. Lateral Canthal Lines (Crow's Feet)
- 6.1.1.3. Forehead Lines
- 6.1.1.4. Other Cosmetic Applications
- 6.1.2. Non-cosmetic Applications
- 6.1.2.1. Dystonia
- 6.1.2.2. Chronic Migraine
- 6.1.2.3. Ophthalmologic Disorders
- 6.1.2.4. Other Non-cosmetic Applications
- 6.1.1. Cosmetic Applications
- 6.2. Market Analysis, Insights and Forecast - by End User
- 6.2.1. Spas and Beauty Centers
- 6.2.2. Clinics and Hospitals
- 6.1. Market Analysis, Insights and Forecast - by Application
- 7. Europe Botox Industry Analysis, Insights and Forecast, 2019-2031
- 7.1. Market Analysis, Insights and Forecast - by Application
- 7.1.1. Cosmetic Applications
- 7.1.1.1. Glabellar Lines
- 7.1.1.2. Lateral Canthal Lines (Crow's Feet)
- 7.1.1.3. Forehead Lines
- 7.1.1.4. Other Cosmetic Applications
- 7.1.2. Non-cosmetic Applications
- 7.1.2.1. Dystonia
- 7.1.2.2. Chronic Migraine
- 7.1.2.3. Ophthalmologic Disorders
- 7.1.2.4. Other Non-cosmetic Applications
- 7.1.1. Cosmetic Applications
- 7.2. Market Analysis, Insights and Forecast - by End User
- 7.2.1. Spas and Beauty Centers
- 7.2.2. Clinics and Hospitals
- 7.1. Market Analysis, Insights and Forecast - by Application
- 8. Asia Pacific Botox Industry Analysis, Insights and Forecast, 2019-2031
- 8.1. Market Analysis, Insights and Forecast - by Application
- 8.1.1. Cosmetic Applications
- 8.1.1.1. Glabellar Lines
- 8.1.1.2. Lateral Canthal Lines (Crow's Feet)
- 8.1.1.3. Forehead Lines
- 8.1.1.4. Other Cosmetic Applications
- 8.1.2. Non-cosmetic Applications
- 8.1.2.1. Dystonia
- 8.1.2.2. Chronic Migraine
- 8.1.2.3. Ophthalmologic Disorders
- 8.1.2.4. Other Non-cosmetic Applications
- 8.1.1. Cosmetic Applications
- 8.2. Market Analysis, Insights and Forecast - by End User
- 8.2.1. Spas and Beauty Centers
- 8.2.2. Clinics and Hospitals
- 8.1. Market Analysis, Insights and Forecast - by Application
- 9. Middle East and Africa Botox Industry Analysis, Insights and Forecast, 2019-2031
- 9.1. Market Analysis, Insights and Forecast - by Application
- 9.1.1. Cosmetic Applications
- 9.1.1.1. Glabellar Lines
- 9.1.1.2. Lateral Canthal Lines (Crow's Feet)
- 9.1.1.3. Forehead Lines
- 9.1.1.4. Other Cosmetic Applications
- 9.1.2. Non-cosmetic Applications
- 9.1.2.1. Dystonia
- 9.1.2.2. Chronic Migraine
- 9.1.2.3. Ophthalmologic Disorders
- 9.1.2.4. Other Non-cosmetic Applications
- 9.1.1. Cosmetic Applications
- 9.2. Market Analysis, Insights and Forecast - by End User
- 9.2.1. Spas and Beauty Centers
- 9.2.2. Clinics and Hospitals
- 9.1. Market Analysis, Insights and Forecast - by Application
- 10. South America Botox Industry Analysis, Insights and Forecast, 2019-2031
- 10.1. Market Analysis, Insights and Forecast - by Application
- 10.1.1. Cosmetic Applications
- 10.1.1.1. Glabellar Lines
- 10.1.1.2. Lateral Canthal Lines (Crow's Feet)
- 10.1.1.3. Forehead Lines
- 10.1.1.4. Other Cosmetic Applications
- 10.1.2. Non-cosmetic Applications
- 10.1.2.1. Dystonia
- 10.1.2.2. Chronic Migraine
- 10.1.2.3. Ophthalmologic Disorders
- 10.1.2.4. Other Non-cosmetic Applications
- 10.1.1. Cosmetic Applications
- 10.2. Market Analysis, Insights and Forecast - by End User
- 10.2.1. Spas and Beauty Centers
- 10.2.2. Clinics and Hospitals
- 10.1. Market Analysis, Insights and Forecast - by Application
- 11. North America Botox Industry Analysis, Insights and Forecast, 2019-2031
- 11.1. Market Analysis, Insights and Forecast - By Country/Sub-region
- 11.1.1 United States
- 11.1.2 Canada
- 11.1.3 Mexico
- 12. Europe Botox Industry Analysis, Insights and Forecast, 2019-2031
- 12.1. Market Analysis, Insights and Forecast - By Country/Sub-region
- 12.1.1 Germany
- 12.1.2 United Kingdom
- 12.1.3 France
- 12.1.4 Italy
- 12.1.5 Spain
- 12.1.6 Rest of Europe
- 13. Asia Pacific Botox Industry Analysis, Insights and Forecast, 2019-2031
- 13.1. Market Analysis, Insights and Forecast - By Country/Sub-region
- 13.1.1 China
- 13.1.2 Japan
- 13.1.3 India
- 13.1.4 Australia
- 13.1.5 South Korea
- 13.1.6 Rest of Asia Pacific
- 14. Middle East and Africa Botox Industry Analysis, Insights and Forecast, 2019-2031
- 14.1. Market Analysis, Insights and Forecast - By Country/Sub-region
- 14.1.1 GCC
- 14.1.2 South Africa
- 14.1.3 Rest of Middle East and Africa
- 15. South America Botox Industry Analysis, Insights and Forecast, 2019-2031
- 15.1. Market Analysis, Insights and Forecast - By Country/Sub-region
- 15.1.1 Brazil
- 15.1.2 Argentina
- 15.1.3 Rest of South America
- 16. Competitive Analysis
- 16.1. Global Market Share Analysis 2024
- 16.2. Company Profiles
- 16.2.1 AbbVie Inc (Allergan)
- 16.2.1.1. Overview
- 16.2.1.2. Products
- 16.2.1.3. SWOT Analysis
- 16.2.1.4. Recent Developments
- 16.2.1.5. Financials (Based on Availability)
- 16.2.2 Galderma
- 16.2.2.1. Overview
- 16.2.2.2. Products
- 16.2.2.3. SWOT Analysis
- 16.2.2.4. Recent Developments
- 16.2.2.5. Financials (Based on Availability)
- 16.2.3 Medytox
- 16.2.3.1. Overview
- 16.2.3.2. Products
- 16.2.3.3. SWOT Analysis
- 16.2.3.4. Recent Developments
- 16.2.3.5. Financials (Based on Availability)
- 16.2.4 Revance Therapeutics Inc (Revance Aesthetics)
- 16.2.4.1. Overview
- 16.2.4.2. Products
- 16.2.4.3. SWOT Analysis
- 16.2.4.4. Recent Developments
- 16.2.4.5. Financials (Based on Availability)
- 16.2.5 Evolus Inc
- 16.2.5.1. Overview
- 16.2.5.2. Products
- 16.2.5.3. SWOT Analysis
- 16.2.5.4. Recent Developments
- 16.2.5.5. Financials (Based on Availability)
- 16.2.6 Hughs
- 16.2.6.1. Overview
- 16.2.6.2. Products
- 16.2.6.3. SWOT Analysis
- 16.2.6.4. Recent Developments
- 16.2.6.5. Financials (Based on Availability)
- 16.2.7 Merz Pharma GmbH & Co KGaA
- 16.2.7.1. Overview
- 16.2.7.2. Products
- 16.2.7.3. SWOT Analysis
- 16.2.7.4. Recent Developments
- 16.2.7.5. Financials (Based on Availability)
- 16.2.8 Daewoong Pharmaceuticals
- 16.2.8.1. Overview
- 16.2.8.2. Products
- 16.2.8.3. SWOT Analysis
- 16.2.8.4. Recent Developments
- 16.2.8.5. Financials (Based on Availability)
- 16.2.9 Eisai
- 16.2.9.1. Overview
- 16.2.9.2. Products
- 16.2.9.3. SWOT Analysis
- 16.2.9.4. Recent Developments
- 16.2.9.5. Financials (Based on Availability)
- 16.2.10 Ipsen Biopharmaceuticals Inc
- 16.2.10.1. Overview
- 16.2.10.2. Products
- 16.2.10.3. SWOT Analysis
- 16.2.10.4. Recent Developments
- 16.2.10.5. Financials (Based on Availability)
- 16.2.11 HUGEL
- 16.2.11.1. Overview
- 16.2.11.2. Products
- 16.2.11.3. SWOT Analysis
- 16.2.11.4. Recent Developments
- 16.2.11.5. Financials (Based on Availability)
- 16.2.12 USWM LLC
- 16.2.12.1. Overview
- 16.2.12.2. Products
- 16.2.12.3. SWOT Analysis
- 16.2.12.4. Recent Developments
- 16.2.12.5. Financials (Based on Availability)
- 16.2.1 AbbVie Inc (Allergan)
List of Figures
- Figure 1: Global Botox Industry Revenue Breakdown (Million, %) by Region 2024 & 2032
- Figure 2: Global Botox Industry Volume Breakdown (K Unit, %) by Region 2024 & 2032
- Figure 3: North America Botox Industry Revenue (Million), by Country 2024 & 2032
- Figure 4: North America Botox Industry Volume (K Unit), by Country 2024 & 2032
- Figure 5: North America Botox Industry Revenue Share (%), by Country 2024 & 2032
- Figure 6: North America Botox Industry Volume Share (%), by Country 2024 & 2032
- Figure 7: Europe Botox Industry Revenue (Million), by Country 2024 & 2032
- Figure 8: Europe Botox Industry Volume (K Unit), by Country 2024 & 2032
- Figure 9: Europe Botox Industry Revenue Share (%), by Country 2024 & 2032
- Figure 10: Europe Botox Industry Volume Share (%), by Country 2024 & 2032
- Figure 11: Asia Pacific Botox Industry Revenue (Million), by Country 2024 & 2032
- Figure 12: Asia Pacific Botox Industry Volume (K Unit), by Country 2024 & 2032
- Figure 13: Asia Pacific Botox Industry Revenue Share (%), by Country 2024 & 2032
- Figure 14: Asia Pacific Botox Industry Volume Share (%), by Country 2024 & 2032
- Figure 15: Middle East and Africa Botox Industry Revenue (Million), by Country 2024 & 2032
- Figure 16: Middle East and Africa Botox Industry Volume (K Unit), by Country 2024 & 2032
- Figure 17: Middle East and Africa Botox Industry Revenue Share (%), by Country 2024 & 2032
- Figure 18: Middle East and Africa Botox Industry Volume Share (%), by Country 2024 & 2032
- Figure 19: South America Botox Industry Revenue (Million), by Country 2024 & 2032
- Figure 20: South America Botox Industry Volume (K Unit), by Country 2024 & 2032
- Figure 21: South America Botox Industry Revenue Share (%), by Country 2024 & 2032
- Figure 22: South America Botox Industry Volume Share (%), by Country 2024 & 2032
- Figure 23: North America Botox Industry Revenue (Million), by Application 2024 & 2032
- Figure 24: North America Botox Industry Volume (K Unit), by Application 2024 & 2032
- Figure 25: North America Botox Industry Revenue Share (%), by Application 2024 & 2032
- Figure 26: North America Botox Industry Volume Share (%), by Application 2024 & 2032
- Figure 27: North America Botox Industry Revenue (Million), by End User 2024 & 2032
- Figure 28: North America Botox Industry Volume (K Unit), by End User 2024 & 2032
- Figure 29: North America Botox Industry Revenue Share (%), by End User 2024 & 2032
- Figure 30: North America Botox Industry Volume Share (%), by End User 2024 & 2032
- Figure 31: North America Botox Industry Revenue (Million), by Country 2024 & 2032
- Figure 32: North America Botox Industry Volume (K Unit), by Country 2024 & 2032
- Figure 33: North America Botox Industry Revenue Share (%), by Country 2024 & 2032
- Figure 34: North America Botox Industry Volume Share (%), by Country 2024 & 2032
- Figure 35: Europe Botox Industry Revenue (Million), by Application 2024 & 2032
- Figure 36: Europe Botox Industry Volume (K Unit), by Application 2024 & 2032
- Figure 37: Europe Botox Industry Revenue Share (%), by Application 2024 & 2032
- Figure 38: Europe Botox Industry Volume Share (%), by Application 2024 & 2032
- Figure 39: Europe Botox Industry Revenue (Million), by End User 2024 & 2032
- Figure 40: Europe Botox Industry Volume (K Unit), by End User 2024 & 2032
- Figure 41: Europe Botox Industry Revenue Share (%), by End User 2024 & 2032
- Figure 42: Europe Botox Industry Volume Share (%), by End User 2024 & 2032
- Figure 43: Europe Botox Industry Revenue (Million), by Country 2024 & 2032
- Figure 44: Europe Botox Industry Volume (K Unit), by Country 2024 & 2032
- Figure 45: Europe Botox Industry Revenue Share (%), by Country 2024 & 2032
- Figure 46: Europe Botox Industry Volume Share (%), by Country 2024 & 2032
- Figure 47: Asia Pacific Botox Industry Revenue (Million), by Application 2024 & 2032
- Figure 48: Asia Pacific Botox Industry Volume (K Unit), by Application 2024 & 2032
- Figure 49: Asia Pacific Botox Industry Revenue Share (%), by Application 2024 & 2032
- Figure 50: Asia Pacific Botox Industry Volume Share (%), by Application 2024 & 2032
- Figure 51: Asia Pacific Botox Industry Revenue (Million), by End User 2024 & 2032
- Figure 52: Asia Pacific Botox Industry Volume (K Unit), by End User 2024 & 2032
- Figure 53: Asia Pacific Botox Industry Revenue Share (%), by End User 2024 & 2032
- Figure 54: Asia Pacific Botox Industry Volume Share (%), by End User 2024 & 2032
- Figure 55: Asia Pacific Botox Industry Revenue (Million), by Country 2024 & 2032
- Figure 56: Asia Pacific Botox Industry Volume (K Unit), by Country 2024 & 2032
- Figure 57: Asia Pacific Botox Industry Revenue Share (%), by Country 2024 & 2032
- Figure 58: Asia Pacific Botox Industry Volume Share (%), by Country 2024 & 2032
- Figure 59: Middle East and Africa Botox Industry Revenue (Million), by Application 2024 & 2032
- Figure 60: Middle East and Africa Botox Industry Volume (K Unit), by Application 2024 & 2032
- Figure 61: Middle East and Africa Botox Industry Revenue Share (%), by Application 2024 & 2032
- Figure 62: Middle East and Africa Botox Industry Volume Share (%), by Application 2024 & 2032
- Figure 63: Middle East and Africa Botox Industry Revenue (Million), by End User 2024 & 2032
- Figure 64: Middle East and Africa Botox Industry Volume (K Unit), by End User 2024 & 2032
- Figure 65: Middle East and Africa Botox Industry Revenue Share (%), by End User 2024 & 2032
- Figure 66: Middle East and Africa Botox Industry Volume Share (%), by End User 2024 & 2032
- Figure 67: Middle East and Africa Botox Industry Revenue (Million), by Country 2024 & 2032
- Figure 68: Middle East and Africa Botox Industry Volume (K Unit), by Country 2024 & 2032
- Figure 69: Middle East and Africa Botox Industry Revenue Share (%), by Country 2024 & 2032
- Figure 70: Middle East and Africa Botox Industry Volume Share (%), by Country 2024 & 2032
- Figure 71: South America Botox Industry Revenue (Million), by Application 2024 & 2032
- Figure 72: South America Botox Industry Volume (K Unit), by Application 2024 & 2032
- Figure 73: South America Botox Industry Revenue Share (%), by Application 2024 & 2032
- Figure 74: South America Botox Industry Volume Share (%), by Application 2024 & 2032
- Figure 75: South America Botox Industry Revenue (Million), by End User 2024 & 2032
- Figure 76: South America Botox Industry Volume (K Unit), by End User 2024 & 2032
- Figure 77: South America Botox Industry Revenue Share (%), by End User 2024 & 2032
- Figure 78: South America Botox Industry Volume Share (%), by End User 2024 & 2032
- Figure 79: South America Botox Industry Revenue (Million), by Country 2024 & 2032
- Figure 80: South America Botox Industry Volume (K Unit), by Country 2024 & 2032
- Figure 81: South America Botox Industry Revenue Share (%), by Country 2024 & 2032
- Figure 82: South America Botox Industry Volume Share (%), by Country 2024 & 2032
List of Tables
- Table 1: Global Botox Industry Revenue Million Forecast, by Region 2019 & 2032
- Table 2: Global Botox Industry Volume K Unit Forecast, by Region 2019 & 2032
- Table 3: Global Botox Industry Revenue Million Forecast, by Application 2019 & 2032
- Table 4: Global Botox Industry Volume K Unit Forecast, by Application 2019 & 2032
- Table 5: Global Botox Industry Revenue Million Forecast, by End User 2019 & 2032
- Table 6: Global Botox Industry Volume K Unit Forecast, by End User 2019 & 2032
- Table 7: Global Botox Industry Revenue Million Forecast, by Region 2019 & 2032
- Table 8: Global Botox Industry Volume K Unit Forecast, by Region 2019 & 2032
- Table 9: Global Botox Industry Revenue Million Forecast, by Country 2019 & 2032
- Table 10: Global Botox Industry Volume K Unit Forecast, by Country 2019 & 2032
- Table 11: United States Botox Industry Revenue (Million) Forecast, by Application 2019 & 2032
- Table 12: United States Botox Industry Volume (K Unit) Forecast, by Application 2019 & 2032
- Table 13: Canada Botox Industry Revenue (Million) Forecast, by Application 2019 & 2032
- Table 14: Canada Botox Industry Volume (K Unit) Forecast, by Application 2019 & 2032
- Table 15: Mexico Botox Industry Revenue (Million) Forecast, by Application 2019 & 2032
- Table 16: Mexico Botox Industry Volume (K Unit) Forecast, by Application 2019 & 2032
- Table 17: Global Botox Industry Revenue Million Forecast, by Country 2019 & 2032
- Table 18: Global Botox Industry Volume K Unit Forecast, by Country 2019 & 2032
- Table 19: Germany Botox Industry Revenue (Million) Forecast, by Application 2019 & 2032
- Table 20: Germany Botox Industry Volume (K Unit) Forecast, by Application 2019 & 2032
- Table 21: United Kingdom Botox Industry Revenue (Million) Forecast, by Application 2019 & 2032
- Table 22: United Kingdom Botox Industry Volume (K Unit) Forecast, by Application 2019 & 2032
- Table 23: France Botox Industry Revenue (Million) Forecast, by Application 2019 & 2032
- Table 24: France Botox Industry Volume (K Unit) Forecast, by Application 2019 & 2032
- Table 25: Italy Botox Industry Revenue (Million) Forecast, by Application 2019 & 2032
- Table 26: Italy Botox Industry Volume (K Unit) Forecast, by Application 2019 & 2032
- Table 27: Spain Botox Industry Revenue (Million) Forecast, by Application 2019 & 2032
- Table 28: Spain Botox Industry Volume (K Unit) Forecast, by Application 2019 & 2032
- Table 29: Rest of Europe Botox Industry Revenue (Million) Forecast, by Application 2019 & 2032
- Table 30: Rest of Europe Botox Industry Volume (K Unit) Forecast, by Application 2019 & 2032
- Table 31: Global Botox Industry Revenue Million Forecast, by Country 2019 & 2032
- Table 32: Global Botox Industry Volume K Unit Forecast, by Country 2019 & 2032
- Table 33: China Botox Industry Revenue (Million) Forecast, by Application 2019 & 2032
- Table 34: China Botox Industry Volume (K Unit) Forecast, by Application 2019 & 2032
- Table 35: Japan Botox Industry Revenue (Million) Forecast, by Application 2019 & 2032
- Table 36: Japan Botox Industry Volume (K Unit) Forecast, by Application 2019 & 2032
- Table 37: India Botox Industry Revenue (Million) Forecast, by Application 2019 & 2032
- Table 38: India Botox Industry Volume (K Unit) Forecast, by Application 2019 & 2032
- Table 39: Australia Botox Industry Revenue (Million) Forecast, by Application 2019 & 2032
- Table 40: Australia Botox Industry Volume (K Unit) Forecast, by Application 2019 & 2032
- Table 41: South Korea Botox Industry Revenue (Million) Forecast, by Application 2019 & 2032
- Table 42: South Korea Botox Industry Volume (K Unit) Forecast, by Application 2019 & 2032
- Table 43: Rest of Asia Pacific Botox Industry Revenue (Million) Forecast, by Application 2019 & 2032
- Table 44: Rest of Asia Pacific Botox Industry Volume (K Unit) Forecast, by Application 2019 & 2032
- Table 45: Global Botox Industry Revenue Million Forecast, by Country 2019 & 2032
- Table 46: Global Botox Industry Volume K Unit Forecast, by Country 2019 & 2032
- Table 47: GCC Botox Industry Revenue (Million) Forecast, by Application 2019 & 2032
- Table 48: GCC Botox Industry Volume (K Unit) Forecast, by Application 2019 & 2032
- Table 49: South Africa Botox Industry Revenue (Million) Forecast, by Application 2019 & 2032
- Table 50: South Africa Botox Industry Volume (K Unit) Forecast, by Application 2019 & 2032
- Table 51: Rest of Middle East and Africa Botox Industry Revenue (Million) Forecast, by Application 2019 & 2032
- Table 52: Rest of Middle East and Africa Botox Industry Volume (K Unit) Forecast, by Application 2019 & 2032
- Table 53: Global Botox Industry Revenue Million Forecast, by Country 2019 & 2032
- Table 54: Global Botox Industry Volume K Unit Forecast, by Country 2019 & 2032
- Table 55: Brazil Botox Industry Revenue (Million) Forecast, by Application 2019 & 2032
- Table 56: Brazil Botox Industry Volume (K Unit) Forecast, by Application 2019 & 2032
- Table 57: Argentina Botox Industry Revenue (Million) Forecast, by Application 2019 & 2032
- Table 58: Argentina Botox Industry Volume (K Unit) Forecast, by Application 2019 & 2032
- Table 59: Rest of South America Botox Industry Revenue (Million) Forecast, by Application 2019 & 2032
- Table 60: Rest of South America Botox Industry Volume (K Unit) Forecast, by Application 2019 & 2032
- Table 61: Global Botox Industry Revenue Million Forecast, by Application 2019 & 2032
- Table 62: Global Botox Industry Volume K Unit Forecast, by Application 2019 & 2032
- Table 63: Global Botox Industry Revenue Million Forecast, by End User 2019 & 2032
- Table 64: Global Botox Industry Volume K Unit Forecast, by End User 2019 & 2032
- Table 65: Global Botox Industry Revenue Million Forecast, by Country 2019 & 2032
- Table 66: Global Botox Industry Volume K Unit Forecast, by Country 2019 & 2032
- Table 67: United States Botox Industry Revenue (Million) Forecast, by Application 2019 & 2032
- Table 68: United States Botox Industry Volume (K Unit) Forecast, by Application 2019 & 2032
- Table 69: Canada Botox Industry Revenue (Million) Forecast, by Application 2019 & 2032
- Table 70: Canada Botox Industry Volume (K Unit) Forecast, by Application 2019 & 2032
- Table 71: Mexico Botox Industry Revenue (Million) Forecast, by Application 2019 & 2032
- Table 72: Mexico Botox Industry Volume (K Unit) Forecast, by Application 2019 & 2032
- Table 73: Global Botox Industry Revenue Million Forecast, by Application 2019 & 2032
- Table 74: Global Botox Industry Volume K Unit Forecast, by Application 2019 & 2032
- Table 75: Global Botox Industry Revenue Million Forecast, by End User 2019 & 2032
- Table 76: Global Botox Industry Volume K Unit Forecast, by End User 2019 & 2032
- Table 77: Global Botox Industry Revenue Million Forecast, by Country 2019 & 2032
- Table 78: Global Botox Industry Volume K Unit Forecast, by Country 2019 & 2032
- Table 79: Germany Botox Industry Revenue (Million) Forecast, by Application 2019 & 2032
- Table 80: Germany Botox Industry Volume (K Unit) Forecast, by Application 2019 & 2032
- Table 81: United Kingdom Botox Industry Revenue (Million) Forecast, by Application 2019 & 2032
- Table 82: United Kingdom Botox Industry Volume (K Unit) Forecast, by Application 2019 & 2032
- Table 83: France Botox Industry Revenue (Million) Forecast, by Application 2019 & 2032
- Table 84: France Botox Industry Volume (K Unit) Forecast, by Application 2019 & 2032
- Table 85: Italy Botox Industry Revenue (Million) Forecast, by Application 2019 & 2032
- Table 86: Italy Botox Industry Volume (K Unit) Forecast, by Application 2019 & 2032
- Table 87: Spain Botox Industry Revenue (Million) Forecast, by Application 2019 & 2032
- Table 88: Spain Botox Industry Volume (K Unit) Forecast, by Application 2019 & 2032
- Table 89: Rest of Europe Botox Industry Revenue (Million) Forecast, by Application 2019 & 2032
- Table 90: Rest of Europe Botox Industry Volume (K Unit) Forecast, by Application 2019 & 2032
- Table 91: Global Botox Industry Revenue Million Forecast, by Application 2019 & 2032
- Table 92: Global Botox Industry Volume K Unit Forecast, by Application 2019 & 2032
- Table 93: Global Botox Industry Revenue Million Forecast, by End User 2019 & 2032
- Table 94: Global Botox Industry Volume K Unit Forecast, by End User 2019 & 2032
- Table 95: Global Botox Industry Revenue Million Forecast, by Country 2019 & 2032
- Table 96: Global Botox Industry Volume K Unit Forecast, by Country 2019 & 2032
- Table 97: China Botox Industry Revenue (Million) Forecast, by Application 2019 & 2032
- Table 98: China Botox Industry Volume (K Unit) Forecast, by Application 2019 & 2032
- Table 99: Japan Botox Industry Revenue (Million) Forecast, by Application 2019 & 2032
- Table 100: Japan Botox Industry Volume (K Unit) Forecast, by Application 2019 & 2032
- Table 101: India Botox Industry Revenue (Million) Forecast, by Application 2019 & 2032
- Table 102: India Botox Industry Volume (K Unit) Forecast, by Application 2019 & 2032
- Table 103: Australia Botox Industry Revenue (Million) Forecast, by Application 2019 & 2032
- Table 104: Australia Botox Industry Volume (K Unit) Forecast, by Application 2019 & 2032
- Table 105: South Korea Botox Industry Revenue (Million) Forecast, by Application 2019 & 2032
- Table 106: South Korea Botox Industry Volume (K Unit) Forecast, by Application 2019 & 2032
- Table 107: Rest of Asia Pacific Botox Industry Revenue (Million) Forecast, by Application 2019 & 2032
- Table 108: Rest of Asia Pacific Botox Industry Volume (K Unit) Forecast, by Application 2019 & 2032
- Table 109: Global Botox Industry Revenue Million Forecast, by Application 2019 & 2032
- Table 110: Global Botox Industry Volume K Unit Forecast, by Application 2019 & 2032
- Table 111: Global Botox Industry Revenue Million Forecast, by End User 2019 & 2032
- Table 112: Global Botox Industry Volume K Unit Forecast, by End User 2019 & 2032
- Table 113: Global Botox Industry Revenue Million Forecast, by Country 2019 & 2032
- Table 114: Global Botox Industry Volume K Unit Forecast, by Country 2019 & 2032
- Table 115: GCC Botox Industry Revenue (Million) Forecast, by Application 2019 & 2032
- Table 116: GCC Botox Industry Volume (K Unit) Forecast, by Application 2019 & 2032
- Table 117: South Africa Botox Industry Revenue (Million) Forecast, by Application 2019 & 2032
- Table 118: South Africa Botox Industry Volume (K Unit) Forecast, by Application 2019 & 2032
- Table 119: Rest of Middle East and Africa Botox Industry Revenue (Million) Forecast, by Application 2019 & 2032
- Table 120: Rest of Middle East and Africa Botox Industry Volume (K Unit) Forecast, by Application 2019 & 2032
- Table 121: Global Botox Industry Revenue Million Forecast, by Application 2019 & 2032
- Table 122: Global Botox Industry Volume K Unit Forecast, by Application 2019 & 2032
- Table 123: Global Botox Industry Revenue Million Forecast, by End User 2019 & 2032
- Table 124: Global Botox Industry Volume K Unit Forecast, by End User 2019 & 2032
- Table 125: Global Botox Industry Revenue Million Forecast, by Country 2019 & 2032
- Table 126: Global Botox Industry Volume K Unit Forecast, by Country 2019 & 2032
- Table 127: Brazil Botox Industry Revenue (Million) Forecast, by Application 2019 & 2032
- Table 128: Brazil Botox Industry Volume (K Unit) Forecast, by Application 2019 & 2032
- Table 129: Argentina Botox Industry Revenue (Million) Forecast, by Application 2019 & 2032
- Table 130: Argentina Botox Industry Volume (K Unit) Forecast, by Application 2019 & 2032
- Table 131: Rest of South America Botox Industry Revenue (Million) Forecast, by Application 2019 & 2032
- Table 132: Rest of South America Botox Industry Volume (K Unit) Forecast, by Application 2019 & 2032
Frequently Asked Questions
1. What is the projected Compound Annual Growth Rate (CAGR) of the Botox Industry?
The projected CAGR is approximately 9.20%.
2. Which companies are prominent players in the Botox Industry?
Key companies in the market include AbbVie Inc (Allergan), Galderma, Medytox, Revance Therapeutics Inc (Revance Aesthetics), Evolus Inc, Hughs, Merz Pharma GmbH & Co KGaA, Daewoong Pharmaceuticals, Eisai, Ipsen Biopharmaceuticals Inc, HUGEL, USWM LLC.
3. What are the main segments of the Botox Industry?
The market segments include Application, End User.
4. Can you provide details about the market size?
The market size is estimated to be USD 6.49 Million as of 2022.
5. What are some drivers contributing to market growth?
Increasing Demand for Aesthetic Procedures; Growing Research and Development Initiatives to Expand the Therapeutic Applications of Botulinum Toxin.
6. What are the notable trends driving market growth?
Glabellar Lines Segment is Expected to Hold Significant Share in the Market Over the Forecast Period.
7. Are there any restraints impacting market growth?
Adverse Effects Associated with Botulinum Toxin; Lack of Reimbursement Policies Supporting Cosmetic Procedures.
8. Can you provide examples of recent developments in the market?
March 2024: Hugel America Inc. announced that the United States Food and Drugs Administration (US FDA) had approved Letybo (Neurotoxin) for the management of moderate-to-severe glabellar (frown) lines in adults.
9. What pricing options are available for accessing the report?
Pricing options include single-user, multi-user, and enterprise licenses priced at USD 4750, USD 5250, and USD 8750 respectively.
10. Is the market size provided in terms of value or volume?
The market size is provided in terms of value, measured in Million and volume, measured in K Unit.
11. Are there any specific market keywords associated with the report?
Yes, the market keyword associated with the report is "Botox Industry," which aids in identifying and referencing the specific market segment covered.
12. How do I determine which pricing option suits my needs best?
The pricing options vary based on user requirements and access needs. Individual users may opt for single-user licenses, while businesses requiring broader access may choose multi-user or enterprise licenses for cost-effective access to the report.
13. Are there any additional resources or data provided in the Botox Industry report?
While the report offers comprehensive insights, it's advisable to review the specific contents or supplementary materials provided to ascertain if additional resources or data are available.
14. How can I stay updated on further developments or reports in the Botox Industry?
To stay informed about further developments, trends, and reports in the Botox Industry, consider subscribing to industry newsletters, following relevant companies and organizations, or regularly checking reputable industry news sources and publications.
Methodology
Step 1 - Identification of Relevant Samples Size from Population Database


Step 2 - Approaches for Defining Global Market Size (Value, Volume* & Price*)

Note*: In applicable scenarios
Step 3 - Data Sources
Primary Research
- Web Analytics
- Survey Reports
- Research Institute
- Latest Research Reports
- Opinion Leaders
Secondary Research
- Annual Reports
- White Paper
- Latest Press Release
- Industry Association
- Paid Database
- Investor Presentations

Step 4 - Data Triangulation
Involves using different sources of information in order to increase the validity of a study
These sources are likely to be stakeholders in a program - participants, other researchers, program staff, other community members, and so on.
Then we put all data in single framework & apply various statistical tools to find out the dynamic on the market.
During the analysis stage, feedback from the stakeholder groups would be compared to determine areas of agreement as well as areas of divergence


