
Key Insights
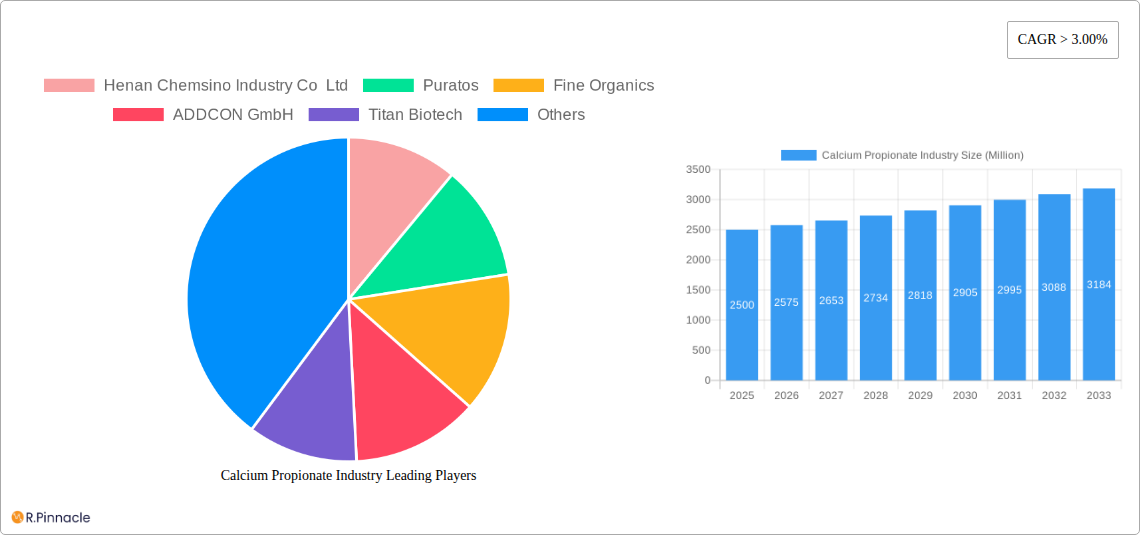
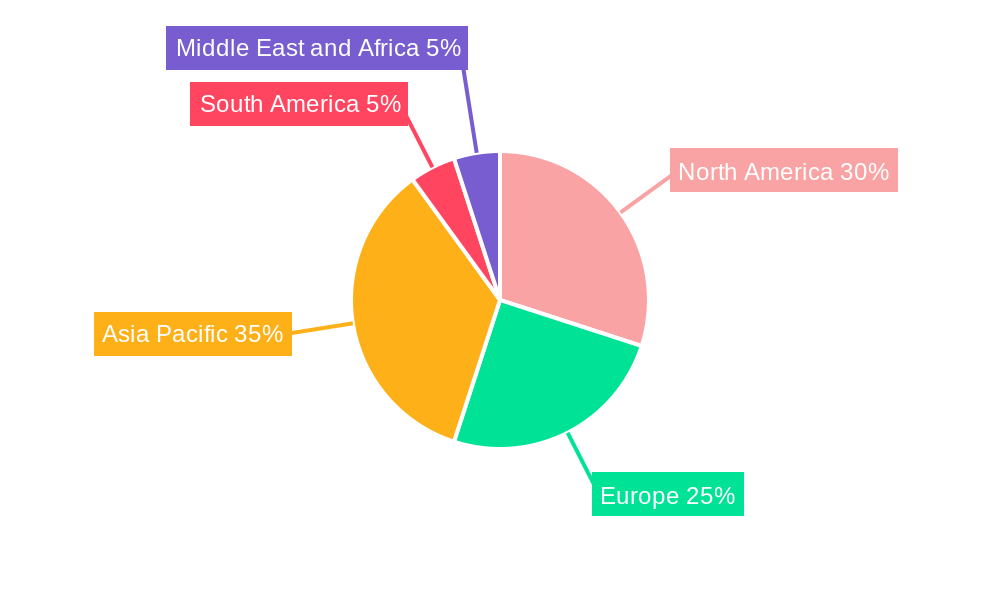
The global calcium propionate market, valued at approximately $XX million in 2025, is projected to experience robust growth, exceeding a 3% compound annual growth rate (CAGR) through 2033. This expansion is driven by the increasing demand for food preservatives across diverse applications, particularly in the food and beverage, pharmaceutical, and animal feed industries. Growing consumer awareness of food safety and the need for extended shelf life are key factors fueling market growth. The pharmaceutical sector's utilization of calcium propionate as an excipient in drug formulations also contributes significantly. Furthermore, the rising adoption of calcium propionate in animal feed to prevent microbial spoilage and enhance feed quality is bolstering market demand. While fluctuating raw material prices and stringent regulatory norms present challenges, the overall market outlook remains positive, with opportunities for growth in emerging economies like those within the Asia-Pacific region, fueled by rising disposable incomes and changing dietary habits. Leading players, such as Henan Chemsino Industry Co Ltd, Puratos, and Kemin Industries Inc., are strategically investing in research and development to introduce innovative calcium propionate formulations and cater to the evolving needs of diverse industry segments. The market is segmented by application (pharmaceutical, food and beverage, animal feed, personal care, and other applications) and geographically spans North America, Europe, Asia Pacific, South America, and the Middle East and Africa.
The continued growth trajectory of the calcium propionate market is anticipated to be driven by several factors. Innovation in food preservation techniques and the development of more efficient and sustainable production methods will contribute to market expansion. Furthermore, increasing investments in food processing and manufacturing infrastructure, especially in developing countries, will create significant opportunities for market players. The growing focus on natural and organic food preservatives will likely influence product development and market segmentation. Regional variations in market dynamics will influence future growth patterns, with emerging economies showing the most significant potential. Competition amongst existing players and the entry of new companies will shape the market landscape and drive innovation. Understanding these market dynamics and trends is crucial for stakeholders aiming to capitalize on the growth opportunities presented by this significant market.
Calcium Propionate Industry Market Report: 2019-2033
This comprehensive report provides a detailed analysis of the global calcium propionate market, offering invaluable insights for industry professionals, investors, and strategic decision-makers. Covering the period 2019-2033, with a focus on 2025, this report illuminates market dynamics, competitive landscapes, and future growth potential. The report leverages extensive data analysis and expert insights to deliver actionable intelligence on market size (reaching xx Million by 2033), segmentation, and key players.
Calcium Propionate Industry Market Structure & Innovation Trends
The calcium propionate market exhibits a moderately concentrated structure, with several major players holding significant market share. Henan Chemsino Industry Co Ltd, Puratos, Fine Organics, and ADDCON GmbH are among the leading companies, collectively accounting for an estimated xx% of the global market in 2025. However, the presence of numerous smaller regional players indicates a competitive landscape.
Market innovation is driven by the increasing demand for clean-label ingredients, particularly within the food and beverage sector. Regulatory pressures regarding food safety and preservation are also significant drivers. Product substitution is limited due to calcium propionate's unique properties as a food preservative. Recent mergers and acquisitions (M&A) activity, while not extensive, indicates consolidation within the industry. Deal values have ranged from xx Million to xx Million in recent years.
- Market Concentration: Moderately concentrated
- Innovation Drivers: Clean-label demands, regulatory pressures
- M&A Activity: Sporadic, with deal values ranging from xx Million to xx Million.
- Key Players' Market Share: xx% (estimated for top 4 players in 2025)
Calcium Propionate Industry Market Dynamics & Trends
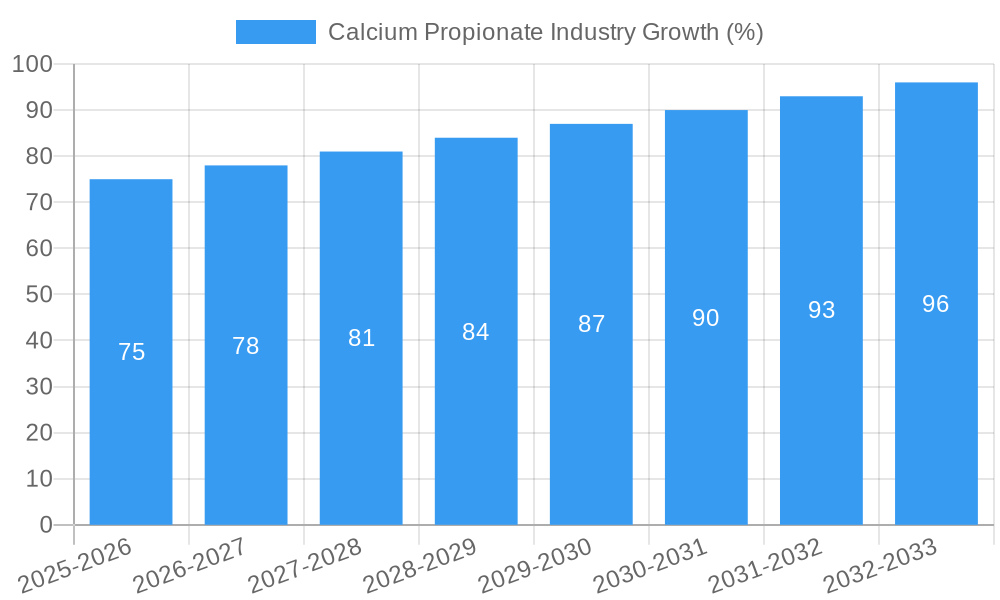
The global calcium propionate market is projected to experience a Compound Annual Growth Rate (CAGR) of xx% during the forecast period (2025-2033). This growth is fueled by the expanding food and beverage industry, rising demand for processed foods, and the increasing adoption of calcium propionate in animal feed. Technological advancements are leading to more efficient and sustainable production methods. Consumer preference for longer shelf-life products also contributes significantly to market growth. However, fluctuating raw material prices and potential regulatory changes could impact market dynamics. Market penetration in emerging economies is expected to increase substantially over the forecast period.
Dominant Regions & Segments in Calcium Propionate Industry
The food and beverage segment dominates the calcium propionate market, accounting for approximately xx% of global consumption in 2025. This is largely due to its widespread use as a preservative in baked goods, dairy products, and other processed foods. Europe and North America represent the largest regional markets, driven by high consumption of processed foods and stringent food safety regulations. However, Asia-Pacific is expected to show the fastest growth due to increasing food processing and urbanization.
Leading Segment: Food and Beverage (xx% market share in 2025)
Leading Regions: Europe, North America (high consumption)
Fastest Growing Region: Asia-Pacific (driven by urbanization and food processing growth)
Key Drivers for Food & Beverage Segment: High processed food consumption, stringent food safety regulations, increasing demand for longer shelf-life products.
Key Drivers for Asia-Pacific Region: Rising disposable incomes, expanding middle class, increased urbanization, and growing processed food consumption.
Calcium Propionate Industry Product Innovations
Recent innovations have focused on developing clean-label and sustainably produced calcium propionate. BioVeritas' March 2023 launch of a clean-label mold inhibitor using a cultured extract exemplifies this trend. This new product extends shelf life by nearly 30%, offering a significant competitive advantage over traditional petrochemical-derived products. These innovations align with growing consumer demand for natural and sustainable food preservatives.
Report Scope & Segmentation Analysis
This report segments the calcium propionate market by application: Pharmaceutical, Food and Beverage, Animal Feed, Personal Care, and Other Applications. Each segment's growth projection, market size, and competitive dynamics are analyzed. The Food and Beverage segment is projected to dominate throughout the forecast period, followed by the Animal Feed segment. The Personal Care segment is expected to show moderate growth.
- Pharmaceutical: Growth driven by its use as an excipient in pharmaceutical formulations. Market size is estimated at xx Million in 2025.
- Food and Beverage: Largest segment with xx Million market value in 2025. Dominated by its role as a preservative.
- Animal Feed: Significant segment showing strong growth due to increasing demand for animal feed preservatives. Estimated at xx Million in 2025.
- Personal Care: Smaller market segment but exhibits steady growth due to its use in cosmetics and personal care products. Market size is predicted at xx Million in 2025.
- Other Applications: Includes industrial applications and niche uses. Estimated at xx Million in 2025.
Key Drivers of Calcium Propionate Industry Growth
The calcium propionate market is driven by several factors: the rising demand for processed foods, stringent food safety regulations necessitating effective preservation, and increasing awareness of foodborne illnesses. The expanding animal feed industry and its need for effective preservatives also contribute to market growth. Technological advancements resulting in cost-effective and sustainable production further boost the market.
Challenges in the Calcium Propionate Industry Sector
The industry faces challenges such as fluctuating raw material prices, potential regulatory changes impacting production and labeling, and intense competition from other preservatives. Supply chain disruptions can also impact production and lead to price volatility. These factors can affect profitability and market growth.
Emerging Opportunities in Calcium Propionate Industry
Emerging opportunities include the development of clean-label and sustainable calcium propionate alternatives, penetration into new markets, especially in developing economies, and exploration of new applications in areas like pharmaceuticals and personal care. Focus on innovation and sustainable production practices will be key for future success.
Leading Players in the Calcium Propionate Industry Market
- Henan Chemsino Industry Co Ltd
- Puratos
- Fine Organics
- ADDCON GmbH
- Titan Biotech
- Pestell Nutrition Inc
- Agailenobel
- Perstorp Holding AB
- Jainex Speciality Chemicals
- Impextraco NV
- Kemin Industries Inc
- Niacet A Kerry Company
- Macco Organiques Inc
- BioVeritas
*List Not Exhaustive
Key Developments in Calcium Propionate Industry
- March 2023: BioVeritas launched a clean-label mold inhibitor, extending shelf life by nearly 30%. This significantly impacts market competition by offering a superior, clean-label alternative.
- April 2022: Perstorp announced plans to increase carboxylic acid production capacity by 70,000 tons/year, indirectly boosting calcium propionate production by 2024. This expansion increases market supply and potentially impacts pricing.
Future Outlook for Calcium Propionate Industry Market
The calcium propionate market is poised for continued growth, driven by increasing demand for food preservation solutions, expansion into new applications, and the development of innovative, sustainable products. Strategic partnerships, investments in R&D, and a focus on meeting evolving consumer preferences will be crucial for success in this dynamic market. The market is expected to reach xx Million by 2033.
Calcium Propionate Industry Segmentation
-
1. Application
- 1.1. Pharmaceutical
- 1.2. Food and Beverage
- 1.3. Animal Feed
- 1.4. Personal Care
- 1.5. Other Applications
Calcium Propionate Industry Segmentation By Geography
-
1. Asia Pacific
- 1.1. China
- 1.2. India
- 1.3. Japan
- 1.4. South Korea
- 1.5. Rest of Asia Pacific
-
2. North America
- 2.1. United States
- 2.2. Canada
- 2.3. Mexico
-
3. Europe
- 3.1. Germany
- 3.2. United Kingdom
- 3.3. Italy
- 3.4. France
- 3.5. Rest of Europe
-
4. South America
- 4.1. Brazil
- 4.2. Argentina
- 4.3. Rest of South America
-
5. Middle East and Africa
- 5.1. Saudi Arabia
- 5.2. South Africa
- 5.3. Rest of Middle East and Africa
Calcium Propionate Industry REPORT HIGHLIGHTS
| Aspects | Details |
|---|---|
| Study Period | 2019-2033 |
| Base Year | 2024 |
| Estimated Year | 2025 |
| Forecast Period | 2025-2033 |
| Historical Period | 2019-2024 |
| Growth Rate | CAGR of > 3.00% from 2019-2033 |
| Segmentation |
|
Table of Contents
- 1. Introduction
- 1.1. Research Scope
- 1.2. Market Segmentation
- 1.3. Research Methodology
- 1.4. Definitions and Assumptions
- 2. Executive Summary
- 2.1. Introduction
- 3. Market Dynamics
- 3.1. Introduction
- 3.2. Market Drivers
- 3.2.1. Increasing Demand for Food Additives; Other Drivers
- 3.3. Market Restrains
- 3.3.1. Growing Demand for Preservative-less Food Products; Other Restraints
- 3.4. Market Trends
- 3.4.1. Increasing Demand from the Food and Beverage Sector
- 4. Market Factor Analysis
- 4.1. Porters Five Forces
- 4.2. Supply/Value Chain
- 4.3. PESTEL analysis
- 4.4. Market Entropy
- 4.5. Patent/Trademark Analysis
- 5. Global Calcium Propionate Industry Analysis, Insights and Forecast, 2019-2031
- 5.1. Market Analysis, Insights and Forecast - by Application
- 5.1.1. Pharmaceutical
- 5.1.2. Food and Beverage
- 5.1.3. Animal Feed
- 5.1.4. Personal Care
- 5.1.5. Other Applications
- 5.2. Market Analysis, Insights and Forecast - by Region
- 5.2.1. Asia Pacific
- 5.2.2. North America
- 5.2.3. Europe
- 5.2.4. South America
- 5.2.5. Middle East and Africa
- 5.1. Market Analysis, Insights and Forecast - by Application
- 6. Asia Pacific Calcium Propionate Industry Analysis, Insights and Forecast, 2019-2031
- 6.1. Market Analysis, Insights and Forecast - by Application
- 6.1.1. Pharmaceutical
- 6.1.2. Food and Beverage
- 6.1.3. Animal Feed
- 6.1.4. Personal Care
- 6.1.5. Other Applications
- 6.1. Market Analysis, Insights and Forecast - by Application
- 7. North America Calcium Propionate Industry Analysis, Insights and Forecast, 2019-2031
- 7.1. Market Analysis, Insights and Forecast - by Application
- 7.1.1. Pharmaceutical
- 7.1.2. Food and Beverage
- 7.1.3. Animal Feed
- 7.1.4. Personal Care
- 7.1.5. Other Applications
- 7.1. Market Analysis, Insights and Forecast - by Application
- 8. Europe Calcium Propionate Industry Analysis, Insights and Forecast, 2019-2031
- 8.1. Market Analysis, Insights and Forecast - by Application
- 8.1.1. Pharmaceutical
- 8.1.2. Food and Beverage
- 8.1.3. Animal Feed
- 8.1.4. Personal Care
- 8.1.5. Other Applications
- 8.1. Market Analysis, Insights and Forecast - by Application
- 9. South America Calcium Propionate Industry Analysis, Insights and Forecast, 2019-2031
- 9.1. Market Analysis, Insights and Forecast - by Application
- 9.1.1. Pharmaceutical
- 9.1.2. Food and Beverage
- 9.1.3. Animal Feed
- 9.1.4. Personal Care
- 9.1.5. Other Applications
- 9.1. Market Analysis, Insights and Forecast - by Application
- 10. Middle East and Africa Calcium Propionate Industry Analysis, Insights and Forecast, 2019-2031
- 10.1. Market Analysis, Insights and Forecast - by Application
- 10.1.1. Pharmaceutical
- 10.1.2. Food and Beverage
- 10.1.3. Animal Feed
- 10.1.4. Personal Care
- 10.1.5. Other Applications
- 10.1. Market Analysis, Insights and Forecast - by Application
- 11. Asia Pacific Calcium Propionate Industry Analysis, Insights and Forecast, 2019-2031
- 11.1. Market Analysis, Insights and Forecast - By Country/Sub-region
- 11.1.1 China
- 11.1.2 India
- 11.1.3 Japan
- 11.1.4 South Korea
- 11.1.5 Rest of Asia Pacific
- 12. North America Calcium Propionate Industry Analysis, Insights and Forecast, 2019-2031
- 12.1. Market Analysis, Insights and Forecast - By Country/Sub-region
- 12.1.1 United States
- 12.1.2 Canada
- 12.1.3 Mexico
- 13. Europe Calcium Propionate Industry Analysis, Insights and Forecast, 2019-2031
- 13.1. Market Analysis, Insights and Forecast - By Country/Sub-region
- 13.1.1 Germany
- 13.1.2 United Kingdom
- 13.1.3 Italy
- 13.1.4 France
- 13.1.5 Rest of Europe
- 14. South America Calcium Propionate Industry Analysis, Insights and Forecast, 2019-2031
- 14.1. Market Analysis, Insights and Forecast - By Country/Sub-region
- 14.1.1 Brazil
- 14.1.2 Argentina
- 14.1.3 Rest of South America
- 15. Middle East and Africa Calcium Propionate Industry Analysis, Insights and Forecast, 2019-2031
- 15.1. Market Analysis, Insights and Forecast - By Country/Sub-region
- 15.1.1 Saudi Arabia
- 15.1.2 South Africa
- 15.1.3 Rest of Middle East and Africa
- 16. Competitive Analysis
- 16.1. Global Market Share Analysis 2024
- 16.2. Company Profiles
- 16.2.1 Henan Chemsino Industry Co Ltd
- 16.2.1.1. Overview
- 16.2.1.2. Products
- 16.2.1.3. SWOT Analysis
- 16.2.1.4. Recent Developments
- 16.2.1.5. Financials (Based on Availability)
- 16.2.2 Puratos
- 16.2.2.1. Overview
- 16.2.2.2. Products
- 16.2.2.3. SWOT Analysis
- 16.2.2.4. Recent Developments
- 16.2.2.5. Financials (Based on Availability)
- 16.2.3 Fine Organics
- 16.2.3.1. Overview
- 16.2.3.2. Products
- 16.2.3.3. SWOT Analysis
- 16.2.3.4. Recent Developments
- 16.2.3.5. Financials (Based on Availability)
- 16.2.4 ADDCON GmbH
- 16.2.4.1. Overview
- 16.2.4.2. Products
- 16.2.4.3. SWOT Analysis
- 16.2.4.4. Recent Developments
- 16.2.4.5. Financials (Based on Availability)
- 16.2.5 Titan Biotech
- 16.2.5.1. Overview
- 16.2.5.2. Products
- 16.2.5.3. SWOT Analysis
- 16.2.5.4. Recent Developments
- 16.2.5.5. Financials (Based on Availability)
- 16.2.6 Pestell Nutrition Inc
- 16.2.6.1. Overview
- 16.2.6.2. Products
- 16.2.6.3. SWOT Analysis
- 16.2.6.4. Recent Developments
- 16.2.6.5. Financials (Based on Availability)
- 16.2.7 Agailenobel
- 16.2.7.1. Overview
- 16.2.7.2. Products
- 16.2.7.3. SWOT Analysis
- 16.2.7.4. Recent Developments
- 16.2.7.5. Financials (Based on Availability)
- 16.2.8 Perstorp Holding AB
- 16.2.8.1. Overview
- 16.2.8.2. Products
- 16.2.8.3. SWOT Analysis
- 16.2.8.4. Recent Developments
- 16.2.8.5. Financials (Based on Availability)
- 16.2.9 Jainex Speciality Chemicals
- 16.2.9.1. Overview
- 16.2.9.2. Products
- 16.2.9.3. SWOT Analysis
- 16.2.9.4. Recent Developments
- 16.2.9.5. Financials (Based on Availability)
- 16.2.10 Impextraco NV
- 16.2.10.1. Overview
- 16.2.10.2. Products
- 16.2.10.3. SWOT Analysis
- 16.2.10.4. Recent Developments
- 16.2.10.5. Financials (Based on Availability)
- 16.2.11 Kemin Industries Inc
- 16.2.11.1. Overview
- 16.2.11.2. Products
- 16.2.11.3. SWOT Analysis
- 16.2.11.4. Recent Developments
- 16.2.11.5. Financials (Based on Availability)
- 16.2.12 Niacet A Kerry Company
- 16.2.12.1. Overview
- 16.2.12.2. Products
- 16.2.12.3. SWOT Analysis
- 16.2.12.4. Recent Developments
- 16.2.12.5. Financials (Based on Availability)
- 16.2.13 Macco Organiques Inc
- 16.2.13.1. Overview
- 16.2.13.2. Products
- 16.2.13.3. SWOT Analysis
- 16.2.13.4. Recent Developments
- 16.2.13.5. Financials (Based on Availability)
- 16.2.14 BioVeritas*List Not Exhaustive
- 16.2.14.1. Overview
- 16.2.14.2. Products
- 16.2.14.3. SWOT Analysis
- 16.2.14.4. Recent Developments
- 16.2.14.5. Financials (Based on Availability)
- 16.2.1 Henan Chemsino Industry Co Ltd
List of Figures
- Figure 1: Global Calcium Propionate Industry Revenue Breakdown (Million, %) by Region 2024 & 2032
- Figure 2: Asia Pacific Calcium Propionate Industry Revenue (Million), by Country 2024 & 2032
- Figure 3: Asia Pacific Calcium Propionate Industry Revenue Share (%), by Country 2024 & 2032
- Figure 4: North America Calcium Propionate Industry Revenue (Million), by Country 2024 & 2032
- Figure 5: North America Calcium Propionate Industry Revenue Share (%), by Country 2024 & 2032
- Figure 6: Europe Calcium Propionate Industry Revenue (Million), by Country 2024 & 2032
- Figure 7: Europe Calcium Propionate Industry Revenue Share (%), by Country 2024 & 2032
- Figure 8: South America Calcium Propionate Industry Revenue (Million), by Country 2024 & 2032
- Figure 9: South America Calcium Propionate Industry Revenue Share (%), by Country 2024 & 2032
- Figure 10: Middle East and Africa Calcium Propionate Industry Revenue (Million), by Country 2024 & 2032
- Figure 11: Middle East and Africa Calcium Propionate Industry Revenue Share (%), by Country 2024 & 2032
- Figure 12: Asia Pacific Calcium Propionate Industry Revenue (Million), by Application 2024 & 2032
- Figure 13: Asia Pacific Calcium Propionate Industry Revenue Share (%), by Application 2024 & 2032
- Figure 14: Asia Pacific Calcium Propionate Industry Revenue (Million), by Country 2024 & 2032
- Figure 15: Asia Pacific Calcium Propionate Industry Revenue Share (%), by Country 2024 & 2032
- Figure 16: North America Calcium Propionate Industry Revenue (Million), by Application 2024 & 2032
- Figure 17: North America Calcium Propionate Industry Revenue Share (%), by Application 2024 & 2032
- Figure 18: North America Calcium Propionate Industry Revenue (Million), by Country 2024 & 2032
- Figure 19: North America Calcium Propionate Industry Revenue Share (%), by Country 2024 & 2032
- Figure 20: Europe Calcium Propionate Industry Revenue (Million), by Application 2024 & 2032
- Figure 21: Europe Calcium Propionate Industry Revenue Share (%), by Application 2024 & 2032
- Figure 22: Europe Calcium Propionate Industry Revenue (Million), by Country 2024 & 2032
- Figure 23: Europe Calcium Propionate Industry Revenue Share (%), by Country 2024 & 2032
- Figure 24: South America Calcium Propionate Industry Revenue (Million), by Application 2024 & 2032
- Figure 25: South America Calcium Propionate Industry Revenue Share (%), by Application 2024 & 2032
- Figure 26: South America Calcium Propionate Industry Revenue (Million), by Country 2024 & 2032
- Figure 27: South America Calcium Propionate Industry Revenue Share (%), by Country 2024 & 2032
- Figure 28: Middle East and Africa Calcium Propionate Industry Revenue (Million), by Application 2024 & 2032
- Figure 29: Middle East and Africa Calcium Propionate Industry Revenue Share (%), by Application 2024 & 2032
- Figure 30: Middle East and Africa Calcium Propionate Industry Revenue (Million), by Country 2024 & 2032
- Figure 31: Middle East and Africa Calcium Propionate Industry Revenue Share (%), by Country 2024 & 2032
List of Tables
- Table 1: Global Calcium Propionate Industry Revenue Million Forecast, by Region 2019 & 2032
- Table 2: Global Calcium Propionate Industry Revenue Million Forecast, by Application 2019 & 2032
- Table 3: Global Calcium Propionate Industry Revenue Million Forecast, by Region 2019 & 2032
- Table 4: Global Calcium Propionate Industry Revenue Million Forecast, by Country 2019 & 2032
- Table 5: China Calcium Propionate Industry Revenue (Million) Forecast, by Application 2019 & 2032
- Table 6: India Calcium Propionate Industry Revenue (Million) Forecast, by Application 2019 & 2032
- Table 7: Japan Calcium Propionate Industry Revenue (Million) Forecast, by Application 2019 & 2032
- Table 8: South Korea Calcium Propionate Industry Revenue (Million) Forecast, by Application 2019 & 2032
- Table 9: Rest of Asia Pacific Calcium Propionate Industry Revenue (Million) Forecast, by Application 2019 & 2032
- Table 10: Global Calcium Propionate Industry Revenue Million Forecast, by Country 2019 & 2032
- Table 11: United States Calcium Propionate Industry Revenue (Million) Forecast, by Application 2019 & 2032
- Table 12: Canada Calcium Propionate Industry Revenue (Million) Forecast, by Application 2019 & 2032
- Table 13: Mexico Calcium Propionate Industry Revenue (Million) Forecast, by Application 2019 & 2032
- Table 14: Global Calcium Propionate Industry Revenue Million Forecast, by Country 2019 & 2032
- Table 15: Germany Calcium Propionate Industry Revenue (Million) Forecast, by Application 2019 & 2032
- Table 16: United Kingdom Calcium Propionate Industry Revenue (Million) Forecast, by Application 2019 & 2032
- Table 17: Italy Calcium Propionate Industry Revenue (Million) Forecast, by Application 2019 & 2032
- Table 18: France Calcium Propionate Industry Revenue (Million) Forecast, by Application 2019 & 2032
- Table 19: Rest of Europe Calcium Propionate Industry Revenue (Million) Forecast, by Application 2019 & 2032
- Table 20: Global Calcium Propionate Industry Revenue Million Forecast, by Country 2019 & 2032
- Table 21: Brazil Calcium Propionate Industry Revenue (Million) Forecast, by Application 2019 & 2032
- Table 22: Argentina Calcium Propionate Industry Revenue (Million) Forecast, by Application 2019 & 2032
- Table 23: Rest of South America Calcium Propionate Industry Revenue (Million) Forecast, by Application 2019 & 2032
- Table 24: Global Calcium Propionate Industry Revenue Million Forecast, by Country 2019 & 2032
- Table 25: Saudi Arabia Calcium Propionate Industry Revenue (Million) Forecast, by Application 2019 & 2032
- Table 26: South Africa Calcium Propionate Industry Revenue (Million) Forecast, by Application 2019 & 2032
- Table 27: Rest of Middle East and Africa Calcium Propionate Industry Revenue (Million) Forecast, by Application 2019 & 2032
- Table 28: Global Calcium Propionate Industry Revenue Million Forecast, by Application 2019 & 2032
- Table 29: Global Calcium Propionate Industry Revenue Million Forecast, by Country 2019 & 2032
- Table 30: China Calcium Propionate Industry Revenue (Million) Forecast, by Application 2019 & 2032
- Table 31: India Calcium Propionate Industry Revenue (Million) Forecast, by Application 2019 & 2032
- Table 32: Japan Calcium Propionate Industry Revenue (Million) Forecast, by Application 2019 & 2032
- Table 33: South Korea Calcium Propionate Industry Revenue (Million) Forecast, by Application 2019 & 2032
- Table 34: Rest of Asia Pacific Calcium Propionate Industry Revenue (Million) Forecast, by Application 2019 & 2032
- Table 35: Global Calcium Propionate Industry Revenue Million Forecast, by Application 2019 & 2032
- Table 36: Global Calcium Propionate Industry Revenue Million Forecast, by Country 2019 & 2032
- Table 37: United States Calcium Propionate Industry Revenue (Million) Forecast, by Application 2019 & 2032
- Table 38: Canada Calcium Propionate Industry Revenue (Million) Forecast, by Application 2019 & 2032
- Table 39: Mexico Calcium Propionate Industry Revenue (Million) Forecast, by Application 2019 & 2032
- Table 40: Global Calcium Propionate Industry Revenue Million Forecast, by Application 2019 & 2032
- Table 41: Global Calcium Propionate Industry Revenue Million Forecast, by Country 2019 & 2032
- Table 42: Germany Calcium Propionate Industry Revenue (Million) Forecast, by Application 2019 & 2032
- Table 43: United Kingdom Calcium Propionate Industry Revenue (Million) Forecast, by Application 2019 & 2032
- Table 44: Italy Calcium Propionate Industry Revenue (Million) Forecast, by Application 2019 & 2032
- Table 45: France Calcium Propionate Industry Revenue (Million) Forecast, by Application 2019 & 2032
- Table 46: Rest of Europe Calcium Propionate Industry Revenue (Million) Forecast, by Application 2019 & 2032
- Table 47: Global Calcium Propionate Industry Revenue Million Forecast, by Application 2019 & 2032
- Table 48: Global Calcium Propionate Industry Revenue Million Forecast, by Country 2019 & 2032
- Table 49: Brazil Calcium Propionate Industry Revenue (Million) Forecast, by Application 2019 & 2032
- Table 50: Argentina Calcium Propionate Industry Revenue (Million) Forecast, by Application 2019 & 2032
- Table 51: Rest of South America Calcium Propionate Industry Revenue (Million) Forecast, by Application 2019 & 2032
- Table 52: Global Calcium Propionate Industry Revenue Million Forecast, by Application 2019 & 2032
- Table 53: Global Calcium Propionate Industry Revenue Million Forecast, by Country 2019 & 2032
- Table 54: Saudi Arabia Calcium Propionate Industry Revenue (Million) Forecast, by Application 2019 & 2032
- Table 55: South Africa Calcium Propionate Industry Revenue (Million) Forecast, by Application 2019 & 2032
- Table 56: Rest of Middle East and Africa Calcium Propionate Industry Revenue (Million) Forecast, by Application 2019 & 2032
Frequently Asked Questions
1. What is the projected Compound Annual Growth Rate (CAGR) of the Calcium Propionate Industry?
The projected CAGR is approximately > 3.00%.
2. Which companies are prominent players in the Calcium Propionate Industry?
Key companies in the market include Henan Chemsino Industry Co Ltd, Puratos, Fine Organics, ADDCON GmbH, Titan Biotech, Pestell Nutrition Inc, Agailenobel, Perstorp Holding AB, Jainex Speciality Chemicals, Impextraco NV, Kemin Industries Inc, Niacet A Kerry Company, Macco Organiques Inc, BioVeritas*List Not Exhaustive.
3. What are the main segments of the Calcium Propionate Industry?
The market segments include Application.
4. Can you provide details about the market size?
The market size is estimated to be USD XX Million as of 2022.
5. What are some drivers contributing to market growth?
Increasing Demand for Food Additives; Other Drivers.
6. What are the notable trends driving market growth?
Increasing Demand from the Food and Beverage Sector.
7. Are there any restraints impacting market growth?
Growing Demand for Preservative-less Food Products; Other Restraints.
8. Can you provide examples of recent developments in the market?
March 2023: BioVeritas invented a clean-label mold inhibitor created through the BioVeritas Process. The BioVeritas calcium propionate cultured extract extended its shelf life by an average of nearly 30% compared to petrochemical-derived calcium propionate.
9. What pricing options are available for accessing the report?
Pricing options include single-user, multi-user, and enterprise licenses priced at USD 4750, USD 5250, and USD 8750 respectively.
10. Is the market size provided in terms of value or volume?
The market size is provided in terms of value, measured in Million.
11. Are there any specific market keywords associated with the report?
Yes, the market keyword associated with the report is "Calcium Propionate Industry," which aids in identifying and referencing the specific market segment covered.
12. How do I determine which pricing option suits my needs best?
The pricing options vary based on user requirements and access needs. Individual users may opt for single-user licenses, while businesses requiring broader access may choose multi-user or enterprise licenses for cost-effective access to the report.
13. Are there any additional resources or data provided in the Calcium Propionate Industry report?
While the report offers comprehensive insights, it's advisable to review the specific contents or supplementary materials provided to ascertain if additional resources or data are available.
14. How can I stay updated on further developments or reports in the Calcium Propionate Industry?
To stay informed about further developments, trends, and reports in the Calcium Propionate Industry, consider subscribing to industry newsletters, following relevant companies and organizations, or regularly checking reputable industry news sources and publications.
Methodology
Step 1 - Identification of Relevant Samples Size from Population Database


Step 2 - Approaches for Defining Global Market Size (Value, Volume* & Price*)

Note*: In applicable scenarios
Step 3 - Data Sources
Primary Research
- Web Analytics
- Survey Reports
- Research Institute
- Latest Research Reports
- Opinion Leaders
Secondary Research
- Annual Reports
- White Paper
- Latest Press Release
- Industry Association
- Paid Database
- Investor Presentations

Step 4 - Data Triangulation
Involves using different sources of information in order to increase the validity of a study
These sources are likely to be stakeholders in a program - participants, other researchers, program staff, other community members, and so on.
Then we put all data in single framework & apply various statistical tools to find out the dynamic on the market.
During the analysis stage, feedback from the stakeholder groups would be compared to determine areas of agreement as well as areas of divergence


