
Key Insights
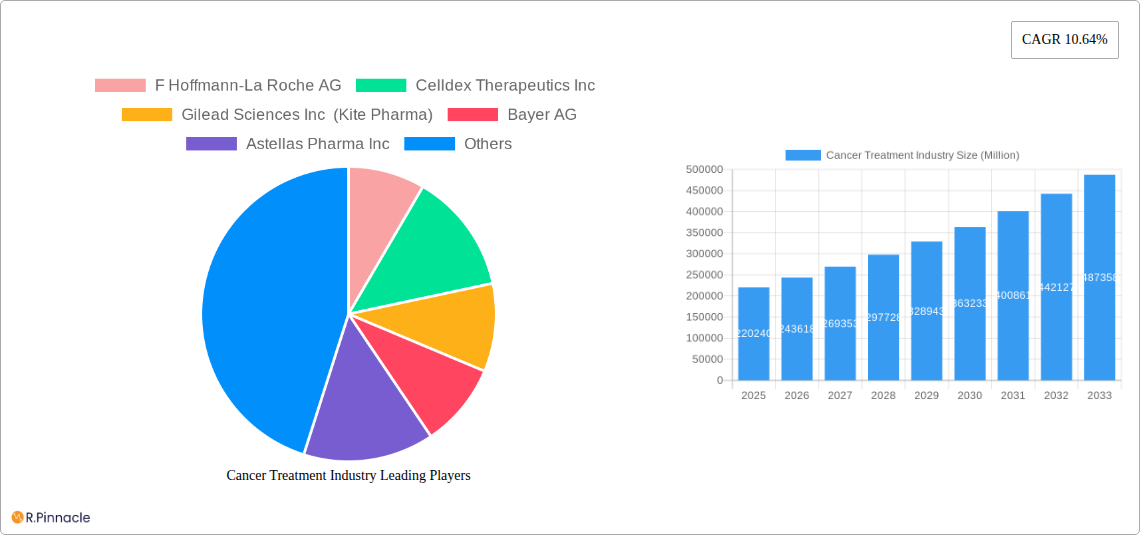
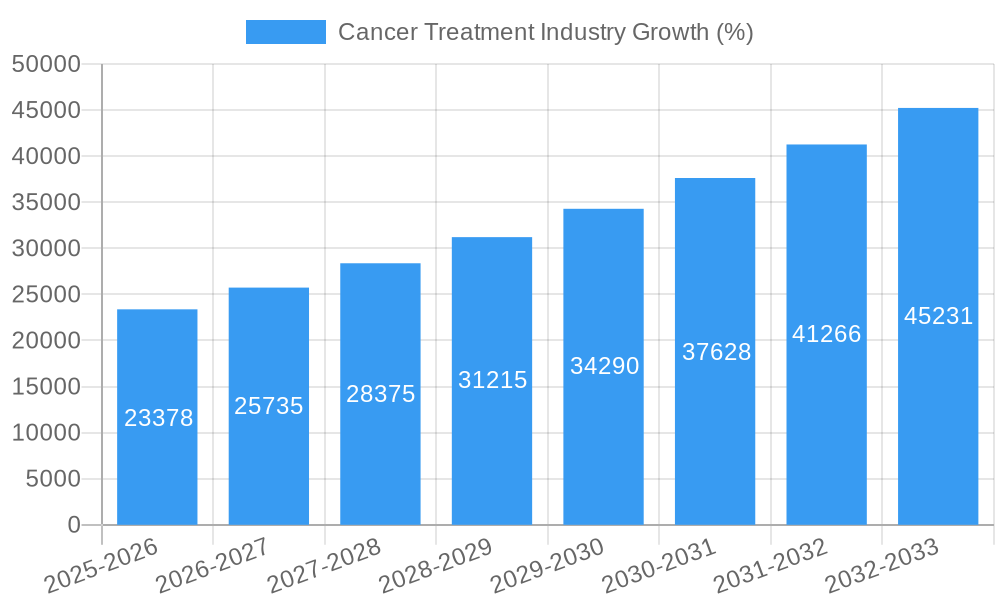
The global cancer treatment market, valued at $220.24 billion in 2025, is projected to experience robust growth, exhibiting a Compound Annual Growth Rate (CAGR) of 10.64% from 2025 to 2033. This expansion is driven by several key factors. The rising prevalence of various cancer types, particularly blood cancers, breast cancer, and lung cancer, globally fuels the demand for effective treatments. Technological advancements in cancer therapies, such as the development of more targeted and personalized treatments like immunotherapy and targeted therapies, contribute significantly to market growth. Furthermore, an aging global population increases susceptibility to cancer, further bolstering market demand. Increased healthcare spending, particularly in developed nations like those in North America and Europe, also supports market expansion. However, the high cost of cancer treatments and the challenges associated with drug resistance pose significant restraints to market growth. The market is segmented by therapy type (chemotherapy, targeted therapy, immunotherapy, hormonal therapy, and others), cancer type (blood cancer, breast cancer, prostate cancer, gastrointestinal cancer, gynecologic cancer, respiratory/lung cancer, and others), and end-user (hospitals, specialty clinics, and cancer and radiation therapy centers). Leading companies such as Roche, Gilead, Novartis, Merck, and others are actively involved in research and development, driving innovation and competition within the market.
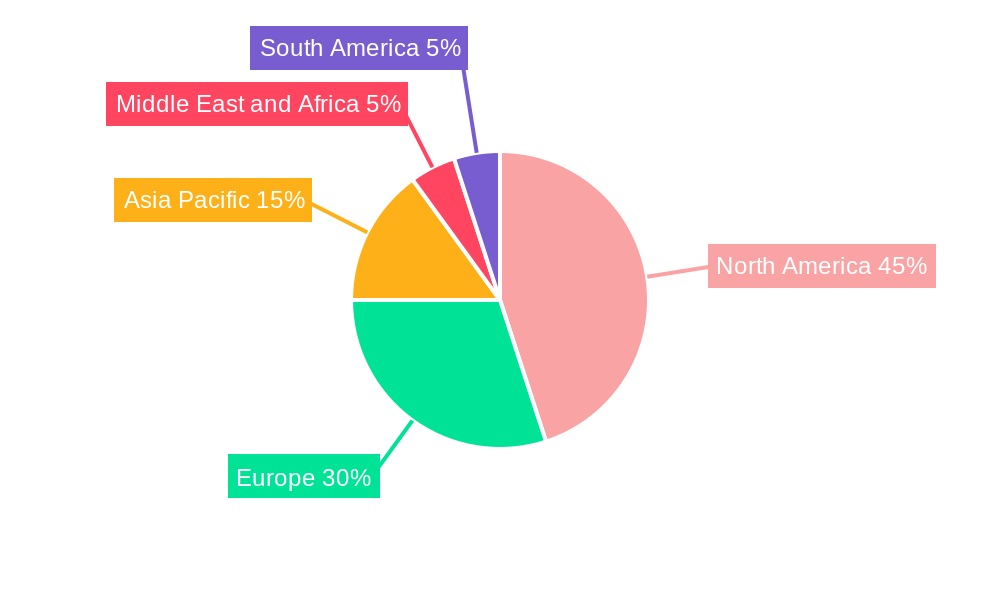
The geographical distribution of the market reveals significant regional variations. North America currently dominates the market, owing to advanced healthcare infrastructure, high disposable income, and a large patient population. However, the Asia-Pacific region is projected to witness the fastest growth during the forecast period driven by increasing cancer incidence rates, rising healthcare expenditure and growing awareness about advanced treatment options. Europe maintains a substantial market share, with Germany, the UK, and France being key contributors. The Middle East and Africa, and South America represent developing markets with significant growth potential as healthcare infrastructure and access to advanced treatments improve. The market's future trajectory hinges on continued research into more effective and less toxic treatments, along with efforts to improve affordability and accessibility for patients globally.
Cancer Treatment Industry Report: 2019-2033
This comprehensive report provides an in-depth analysis of the global cancer treatment industry, offering invaluable insights for industry professionals, investors, and researchers. With a study period spanning 2019-2033, a base year of 2025, and a forecast period of 2025-2033, this report leverages historical data (2019-2024) to project future market trends and growth opportunities. The report is structured to provide actionable intelligence, featuring detailed segmentation analysis across therapy types, cancer types, and end-users. The global market size is estimated at xx Million in 2025.
Cancer Treatment Industry Market Structure & Innovation Trends
This section analyzes the competitive landscape of the cancer treatment industry, encompassing market concentration, innovation drivers, regulatory frameworks, and M&A activities. The industry is characterized by a concentrated market structure with key players like Roche, Novartis, and Merck holding significant market shares. However, smaller biotech companies are also driving innovation through targeted therapies and immunotherapies. The total M&A deal value within the industry between 2019 and 2024 is estimated at xx Million.
- Market Concentration: High, with top 10 players controlling approximately xx% of the market.
- Innovation Drivers: Government funding for R&D, technological advancements in immunotherapy and targeted therapy, unmet clinical needs.
- Regulatory Frameworks: Stringent regulatory approvals impacting timelines and market entry, varying across global regions.
- Product Substitutes: Limited, with high switching costs and patient preference influencing treatment choices.
- End-User Demographics: Aging population, rising cancer incidence driving increased demand.
- M&A Activity: Significant M&A activity observed, driven by the desire to expand product portfolios and gain market share. Key deals in recent years included [Insert example deals with estimated values if available, otherwise state "Several large deals were observed but precise values are not publicly available."].
Cancer Treatment Industry Market Dynamics & Trends
The global cancer treatment market is experiencing robust growth, driven by several factors. Technological advancements, particularly in immunotherapy and targeted therapies, have significantly improved treatment outcomes, increasing market demand. The rising prevalence of cancer, coupled with an aging global population, further fuels market expansion. The market is expected to witness a compound annual growth rate (CAGR) of xx% during the forecast period. Market penetration of novel therapies is gradually increasing, especially in developed nations. Competitive dynamics are intense, with major pharmaceutical companies investing heavily in R&D and strategic collaborations to maintain their market positions. Consumer preferences are increasingly focusing on personalized medicine approaches, driving the demand for targeted and precision therapies.
Dominant Regions & Segments in Cancer Treatment Industry
The North American market currently holds the leading position in the global cancer treatment market, driven by high healthcare expenditure, advanced healthcare infrastructure, and a large patient population. Europe and Asia-Pacific follow as significant markets, although the regional growth rates vary considerably.
Leading Regions:
- North America: High healthcare expenditure, advanced healthcare infrastructure, early adoption of new technologies.
- Europe: Well-established healthcare systems, but growth rate may be moderated by economic factors.
- Asia-Pacific: Rapidly growing market, driven by increasing cancer incidence and rising disposable incomes.
Dominant Segments:
- Therapy Type: Immunotherapy is witnessing the fastest growth due to its high efficacy and improved patient outcomes. Chemotherapy remains a significant segment, especially in developing regions.
- Cancer Type: Lung cancer and breast cancer are currently the largest segments based on treatment value. Blood cancers show high growth potential.
- End User: Hospitals and specialty clinics represent the primary end-users, with cancer centers also witnessing significant growth.
Cancer Treatment Industry Product Innovations
The cancer treatment landscape is constantly evolving, with significant advancements in targeted therapies, immunotherapies, and cell therapies. These innovations offer improved efficacy, reduced side effects, and personalized treatment options. Technological trends such as AI-driven drug discovery and development, and precision medicine approaches are further shaping the market. The market fit for new treatments depends significantly on clinical trial results, regulatory approvals, and pricing strategies.
Report Scope & Segmentation Analysis
This report provides a comprehensive segmentation analysis covering three primary dimensions:
- Therapy Type: Chemotherapy, Targeted Therapy, Immunotherapy, Hormonal Therapy, Other Treatment Types (projected market sizes for each type and growth projections for 2025-2033 are included in the full report).
- Cancer Type: Blood Cancer, Breast Cancer, Prostate Cancer, Gastrointestinal Cancer, Gynaecologic Cancer, Respiratory/Lung Cancer, Other Cancer Types (projected market sizes for each type and growth projections for 2025-2033 are included in the full report).
- End User: Hospitals, Specialty Clinics, Cancer and Radiation Therapy Centers (projected market sizes for each type and growth projections for 2025-2033 are included in the full report).
Key Drivers of Cancer Treatment Industry Growth
Several factors are driving the growth of the cancer treatment industry. Technological advancements in immunotherapy and targeted therapies are leading to improved treatment outcomes. The aging global population is resulting in a higher prevalence of cancer cases. Increased government funding for cancer research and development further contributes to market expansion. Finally, rising healthcare expenditure and improved access to healthcare are supporting the growth trajectory.
Challenges in the Cancer Treatment Industry Sector
The cancer treatment industry faces several challenges, including high research and development costs, stringent regulatory approvals, and intense competition among leading players. Supply chain disruptions can impact the availability of essential drugs and therapies. The high cost of treatment poses a significant barrier for patients, especially in developing countries. The growing prevalence of drug resistance is also a concern.
Emerging Opportunities in Cancer Treatment Industry
Emerging opportunities exist in personalized medicine, where treatments are tailored to individual genetic profiles. Advances in immunotherapy and cell therapy offer promising avenues for improved treatment outcomes. The expansion of telemedicine and remote patient monitoring can improve access to care, particularly in underserved areas. The development of cost-effective and accessible cancer treatment options is crucial, especially in developing countries.
Leading Players in the Cancer Treatment Industry Market
- F Hoffmann-La Roche AG
- Celldex Therapeutics Inc
- Gilead Sciences Inc (Kite Pharma)
- Bayer AG
- Astellas Pharma Inc
- Novartis AG
- Amgen Inc
- Merck & Co Inc
- Takeda Pharmaceutical Company Limited
- AstraZeneca
- Abbvie Inc
- GSK PLC
- Lilly
- Bristol Myers Squibb Company
- Johnson & Johnson Services Inc
- Alaunos Therapeutics Inc
- Pfizer Inc
Key Developments in Cancer Treatment Industry Industry
- May 2023: Genmab A/S received USFDA approval for EPKINLY (epcoritamab-bysp) for R/R diffuse large B-cell lymphoma.
- April 2023: Genentech received USFDA approval for Polivy (polatuzumab vedotin-piiq) in combination with R-CHP for previously untreated diffuse large B-cell lymphoma.
- April 2023: Gamida Cell Ltd received USFDA approval for Omisirge (omidubicel-onlv) for hematologic malignancies in adult and pediatric patients (12+ years).
Future Outlook for Cancer Treatment Industry Market
The cancer treatment industry is poised for continued growth, driven by ongoing innovation in targeted therapies, immunotherapies, and cell therapies. The increasing prevalence of cancer and the aging population will sustain market demand. Continued investment in R&D, coupled with strategic partnerships and M&A activities, will shape the competitive landscape. The development of personalized medicine approaches and improved access to treatment will further drive market expansion.
Cancer Treatment Industry Segmentation
-
1. Therapy Type
- 1.1. Chemotherapy
- 1.2. Targeted Therapy
- 1.3. Immunotherapy
- 1.4. Hormonal Therapy
- 1.5. Other Treatment Types
-
2. Cancer Type
- 2.1. Blood Cancer
- 2.2. Breast Cancer
- 2.3. Prostate Cancer
- 2.4. Gastrointestinal Cancer
- 2.5. Gynaecologic Cancer
- 2.6. Respiratory/Lung Cancer
- 2.7. Other Cancer Types
-
3. End User
- 3.1. Hospitals
- 3.2. Specialty Clinics
- 3.3. Cancer and Radiation Therapy Centers
Cancer Treatment Industry Segmentation By Geography
-
1. North America
- 1.1. United States
- 1.2. Canada
- 1.3. Mexico
-
2. Europe
- 2.1. Germany
- 2.2. United Kingdom
- 2.3. France
- 2.4. Italy
- 2.5. Spain
- 2.6. Rest of Europe
-
3. Asia Pacific
- 3.1. China
- 3.2. Japan
- 3.3. India
- 3.4. Australia
- 3.5. South Korea
- 3.6. Rest of Asia Pacific
-
4. Middle East and Africa
- 4.1. GCC
- 4.2. South Africa
- 4.3. Rest of Middle East and Africa
-
5. South America
- 5.1. Brazil
- 5.2. Argentina
- 5.3. Rest of South America
Cancer Treatment Industry REPORT HIGHLIGHTS
| Aspects | Details |
|---|---|
| Study Period | 2019-2033 |
| Base Year | 2024 |
| Estimated Year | 2025 |
| Forecast Period | 2025-2033 |
| Historical Period | 2019-2024 |
| Growth Rate | CAGR of 10.64% from 2019-2033 |
| Segmentation |
|
Table of Contents
- 1. Introduction
- 1.1. Research Scope
- 1.2. Market Segmentation
- 1.3. Research Methodology
- 1.4. Definitions and Assumptions
- 2. Executive Summary
- 2.1. Introduction
- 3. Market Dynamics
- 3.1. Introduction
- 3.2. Market Drivers
- 3.2.1. Increasing Patient Assistance Programs (PAPs) and Rising Demand for Personalized Medicine; Growing Government Initiatives for Cancer Awareness; Rising Prevalence of Cancer Worldwide; Strong R&D Initiatives from Key Players
- 3.3. Market Restrains
- 3.3.1. Fluctuation in Reimbursement Policies; High Cost of Cancer Therapies
- 3.4. Market Trends
- 3.4.1. The Targeted Therapy Segment is Expected to Witness Significant Growth during the the Forecast Period
- 4. Market Factor Analysis
- 4.1. Porters Five Forces
- 4.2. Supply/Value Chain
- 4.3. PESTEL analysis
- 4.4. Market Entropy
- 4.5. Patent/Trademark Analysis
- 5. Global Cancer Treatment Industry Analysis, Insights and Forecast, 2019-2031
- 5.1. Market Analysis, Insights and Forecast - by Therapy Type
- 5.1.1. Chemotherapy
- 5.1.2. Targeted Therapy
- 5.1.3. Immunotherapy
- 5.1.4. Hormonal Therapy
- 5.1.5. Other Treatment Types
- 5.2. Market Analysis, Insights and Forecast - by Cancer Type
- 5.2.1. Blood Cancer
- 5.2.2. Breast Cancer
- 5.2.3. Prostate Cancer
- 5.2.4. Gastrointestinal Cancer
- 5.2.5. Gynaecologic Cancer
- 5.2.6. Respiratory/Lung Cancer
- 5.2.7. Other Cancer Types
- 5.3. Market Analysis, Insights and Forecast - by End User
- 5.3.1. Hospitals
- 5.3.2. Specialty Clinics
- 5.3.3. Cancer and Radiation Therapy Centers
- 5.4. Market Analysis, Insights and Forecast - by Region
- 5.4.1. North America
- 5.4.2. Europe
- 5.4.3. Asia Pacific
- 5.4.4. Middle East and Africa
- 5.4.5. South America
- 5.1. Market Analysis, Insights and Forecast - by Therapy Type
- 6. North America Cancer Treatment Industry Analysis, Insights and Forecast, 2019-2031
- 6.1. Market Analysis, Insights and Forecast - by Therapy Type
- 6.1.1. Chemotherapy
- 6.1.2. Targeted Therapy
- 6.1.3. Immunotherapy
- 6.1.4. Hormonal Therapy
- 6.1.5. Other Treatment Types
- 6.2. Market Analysis, Insights and Forecast - by Cancer Type
- 6.2.1. Blood Cancer
- 6.2.2. Breast Cancer
- 6.2.3. Prostate Cancer
- 6.2.4. Gastrointestinal Cancer
- 6.2.5. Gynaecologic Cancer
- 6.2.6. Respiratory/Lung Cancer
- 6.2.7. Other Cancer Types
- 6.3. Market Analysis, Insights and Forecast - by End User
- 6.3.1. Hospitals
- 6.3.2. Specialty Clinics
- 6.3.3. Cancer and Radiation Therapy Centers
- 6.1. Market Analysis, Insights and Forecast - by Therapy Type
- 7. Europe Cancer Treatment Industry Analysis, Insights and Forecast, 2019-2031
- 7.1. Market Analysis, Insights and Forecast - by Therapy Type
- 7.1.1. Chemotherapy
- 7.1.2. Targeted Therapy
- 7.1.3. Immunotherapy
- 7.1.4. Hormonal Therapy
- 7.1.5. Other Treatment Types
- 7.2. Market Analysis, Insights and Forecast - by Cancer Type
- 7.2.1. Blood Cancer
- 7.2.2. Breast Cancer
- 7.2.3. Prostate Cancer
- 7.2.4. Gastrointestinal Cancer
- 7.2.5. Gynaecologic Cancer
- 7.2.6. Respiratory/Lung Cancer
- 7.2.7. Other Cancer Types
- 7.3. Market Analysis, Insights and Forecast - by End User
- 7.3.1. Hospitals
- 7.3.2. Specialty Clinics
- 7.3.3. Cancer and Radiation Therapy Centers
- 7.1. Market Analysis, Insights and Forecast - by Therapy Type
- 8. Asia Pacific Cancer Treatment Industry Analysis, Insights and Forecast, 2019-2031
- 8.1. Market Analysis, Insights and Forecast - by Therapy Type
- 8.1.1. Chemotherapy
- 8.1.2. Targeted Therapy
- 8.1.3. Immunotherapy
- 8.1.4. Hormonal Therapy
- 8.1.5. Other Treatment Types
- 8.2. Market Analysis, Insights and Forecast - by Cancer Type
- 8.2.1. Blood Cancer
- 8.2.2. Breast Cancer
- 8.2.3. Prostate Cancer
- 8.2.4. Gastrointestinal Cancer
- 8.2.5. Gynaecologic Cancer
- 8.2.6. Respiratory/Lung Cancer
- 8.2.7. Other Cancer Types
- 8.3. Market Analysis, Insights and Forecast - by End User
- 8.3.1. Hospitals
- 8.3.2. Specialty Clinics
- 8.3.3. Cancer and Radiation Therapy Centers
- 8.1. Market Analysis, Insights and Forecast - by Therapy Type
- 9. Middle East and Africa Cancer Treatment Industry Analysis, Insights and Forecast, 2019-2031
- 9.1. Market Analysis, Insights and Forecast - by Therapy Type
- 9.1.1. Chemotherapy
- 9.1.2. Targeted Therapy
- 9.1.3. Immunotherapy
- 9.1.4. Hormonal Therapy
- 9.1.5. Other Treatment Types
- 9.2. Market Analysis, Insights and Forecast - by Cancer Type
- 9.2.1. Blood Cancer
- 9.2.2. Breast Cancer
- 9.2.3. Prostate Cancer
- 9.2.4. Gastrointestinal Cancer
- 9.2.5. Gynaecologic Cancer
- 9.2.6. Respiratory/Lung Cancer
- 9.2.7. Other Cancer Types
- 9.3. Market Analysis, Insights and Forecast - by End User
- 9.3.1. Hospitals
- 9.3.2. Specialty Clinics
- 9.3.3. Cancer and Radiation Therapy Centers
- 9.1. Market Analysis, Insights and Forecast - by Therapy Type
- 10. South America Cancer Treatment Industry Analysis, Insights and Forecast, 2019-2031
- 10.1. Market Analysis, Insights and Forecast - by Therapy Type
- 10.1.1. Chemotherapy
- 10.1.2. Targeted Therapy
- 10.1.3. Immunotherapy
- 10.1.4. Hormonal Therapy
- 10.1.5. Other Treatment Types
- 10.2. Market Analysis, Insights and Forecast - by Cancer Type
- 10.2.1. Blood Cancer
- 10.2.2. Breast Cancer
- 10.2.3. Prostate Cancer
- 10.2.4. Gastrointestinal Cancer
- 10.2.5. Gynaecologic Cancer
- 10.2.6. Respiratory/Lung Cancer
- 10.2.7. Other Cancer Types
- 10.3. Market Analysis, Insights and Forecast - by End User
- 10.3.1. Hospitals
- 10.3.2. Specialty Clinics
- 10.3.3. Cancer and Radiation Therapy Centers
- 10.1. Market Analysis, Insights and Forecast - by Therapy Type
- 11. North America Cancer Treatment Industry Analysis, Insights and Forecast, 2019-2031
- 11.1. Market Analysis, Insights and Forecast - By Country/Sub-region
- 11.1.1 United States
- 11.1.2 Canada
- 11.1.3 Mexico
- 12. Europe Cancer Treatment Industry Analysis, Insights and Forecast, 2019-2031
- 12.1. Market Analysis, Insights and Forecast - By Country/Sub-region
- 12.1.1 Germany
- 12.1.2 United Kingdom
- 12.1.3 France
- 12.1.4 Italy
- 12.1.5 Spain
- 12.1.6 Rest of Europe
- 13. Asia Pacific Cancer Treatment Industry Analysis, Insights and Forecast, 2019-2031
- 13.1. Market Analysis, Insights and Forecast - By Country/Sub-region
- 13.1.1 China
- 13.1.2 Japan
- 13.1.3 India
- 13.1.4 Australia
- 13.1.5 South Korea
- 13.1.6 Rest of Asia Pacific
- 14. Middle East and Africa Cancer Treatment Industry Analysis, Insights and Forecast, 2019-2031
- 14.1. Market Analysis, Insights and Forecast - By Country/Sub-region
- 14.1.1 GCC
- 14.1.2 South Africa
- 14.1.3 Rest of Middle East and Africa
- 15. South America Cancer Treatment Industry Analysis, Insights and Forecast, 2019-2031
- 15.1. Market Analysis, Insights and Forecast - By Country/Sub-region
- 15.1.1 Brazil
- 15.1.2 Argentina
- 15.1.3 Rest of South America
- 16. Competitive Analysis
- 16.1. Global Market Share Analysis 2024
- 16.2. Company Profiles
- 16.2.1 F Hoffmann-La Roche AG
- 16.2.1.1. Overview
- 16.2.1.2. Products
- 16.2.1.3. SWOT Analysis
- 16.2.1.4. Recent Developments
- 16.2.1.5. Financials (Based on Availability)
- 16.2.2 Celldex Therapeutics Inc
- 16.2.2.1. Overview
- 16.2.2.2. Products
- 16.2.2.3. SWOT Analysis
- 16.2.2.4. Recent Developments
- 16.2.2.5. Financials (Based on Availability)
- 16.2.3 Gilead Sciences Inc (Kite Pharma)
- 16.2.3.1. Overview
- 16.2.3.2. Products
- 16.2.3.3. SWOT Analysis
- 16.2.3.4. Recent Developments
- 16.2.3.5. Financials (Based on Availability)
- 16.2.4 Bayer AG
- 16.2.4.1. Overview
- 16.2.4.2. Products
- 16.2.4.3. SWOT Analysis
- 16.2.4.4. Recent Developments
- 16.2.4.5. Financials (Based on Availability)
- 16.2.5 Astellas Pharma Inc
- 16.2.5.1. Overview
- 16.2.5.2. Products
- 16.2.5.3. SWOT Analysis
- 16.2.5.4. Recent Developments
- 16.2.5.5. Financials (Based on Availability)
- 16.2.6 Novartis AG
- 16.2.6.1. Overview
- 16.2.6.2. Products
- 16.2.6.3. SWOT Analysis
- 16.2.6.4. Recent Developments
- 16.2.6.5. Financials (Based on Availability)
- 16.2.7 Amgen Inc
- 16.2.7.1. Overview
- 16.2.7.2. Products
- 16.2.7.3. SWOT Analysis
- 16.2.7.4. Recent Developments
- 16.2.7.5. Financials (Based on Availability)
- 16.2.8 Merck & Co Inc
- 16.2.8.1. Overview
- 16.2.8.2. Products
- 16.2.8.3. SWOT Analysis
- 16.2.8.4. Recent Developments
- 16.2.8.5. Financials (Based on Availability)
- 16.2.9 Takeda Pharmaceutical Company Limited
- 16.2.9.1. Overview
- 16.2.9.2. Products
- 16.2.9.3. SWOT Analysis
- 16.2.9.4. Recent Developments
- 16.2.9.5. Financials (Based on Availability)
- 16.2.10 AstraZeneca
- 16.2.10.1. Overview
- 16.2.10.2. Products
- 16.2.10.3. SWOT Analysis
- 16.2.10.4. Recent Developments
- 16.2.10.5. Financials (Based on Availability)
- 16.2.11 Abbvie Inc
- 16.2.11.1. Overview
- 16.2.11.2. Products
- 16.2.11.3. SWOT Analysis
- 16.2.11.4. Recent Developments
- 16.2.11.5. Financials (Based on Availability)
- 16.2.12 GSK PLC
- 16.2.12.1. Overview
- 16.2.12.2. Products
- 16.2.12.3. SWOT Analysis
- 16.2.12.4. Recent Developments
- 16.2.12.5. Financials (Based on Availability)
- 16.2.13 Lilly
- 16.2.13.1. Overview
- 16.2.13.2. Products
- 16.2.13.3. SWOT Analysis
- 16.2.13.4. Recent Developments
- 16.2.13.5. Financials (Based on Availability)
- 16.2.14 Bristol Myers Squibb Company
- 16.2.14.1. Overview
- 16.2.14.2. Products
- 16.2.14.3. SWOT Analysis
- 16.2.14.4. Recent Developments
- 16.2.14.5. Financials (Based on Availability)
- 16.2.15 Johnson & Johnson Services Inc
- 16.2.15.1. Overview
- 16.2.15.2. Products
- 16.2.15.3. SWOT Analysis
- 16.2.15.4. Recent Developments
- 16.2.15.5. Financials (Based on Availability)
- 16.2.16 Alaunos Therapeutics Inc
- 16.2.16.1. Overview
- 16.2.16.2. Products
- 16.2.16.3. SWOT Analysis
- 16.2.16.4. Recent Developments
- 16.2.16.5. Financials (Based on Availability)
- 16.2.17 Pfizer Inc
- 16.2.17.1. Overview
- 16.2.17.2. Products
- 16.2.17.3. SWOT Analysis
- 16.2.17.4. Recent Developments
- 16.2.17.5. Financials (Based on Availability)
- 16.2.1 F Hoffmann-La Roche AG
List of Figures
- Figure 1: Global Cancer Treatment Industry Revenue Breakdown (Million, %) by Region 2024 & 2032
- Figure 2: Global Cancer Treatment Industry Volume Breakdown (K Unit, %) by Region 2024 & 2032
- Figure 3: North America Cancer Treatment Industry Revenue (Million), by Country 2024 & 2032
- Figure 4: North America Cancer Treatment Industry Volume (K Unit), by Country 2024 & 2032
- Figure 5: North America Cancer Treatment Industry Revenue Share (%), by Country 2024 & 2032
- Figure 6: North America Cancer Treatment Industry Volume Share (%), by Country 2024 & 2032
- Figure 7: Europe Cancer Treatment Industry Revenue (Million), by Country 2024 & 2032
- Figure 8: Europe Cancer Treatment Industry Volume (K Unit), by Country 2024 & 2032
- Figure 9: Europe Cancer Treatment Industry Revenue Share (%), by Country 2024 & 2032
- Figure 10: Europe Cancer Treatment Industry Volume Share (%), by Country 2024 & 2032
- Figure 11: Asia Pacific Cancer Treatment Industry Revenue (Million), by Country 2024 & 2032
- Figure 12: Asia Pacific Cancer Treatment Industry Volume (K Unit), by Country 2024 & 2032
- Figure 13: Asia Pacific Cancer Treatment Industry Revenue Share (%), by Country 2024 & 2032
- Figure 14: Asia Pacific Cancer Treatment Industry Volume Share (%), by Country 2024 & 2032
- Figure 15: Middle East and Africa Cancer Treatment Industry Revenue (Million), by Country 2024 & 2032
- Figure 16: Middle East and Africa Cancer Treatment Industry Volume (K Unit), by Country 2024 & 2032
- Figure 17: Middle East and Africa Cancer Treatment Industry Revenue Share (%), by Country 2024 & 2032
- Figure 18: Middle East and Africa Cancer Treatment Industry Volume Share (%), by Country 2024 & 2032
- Figure 19: South America Cancer Treatment Industry Revenue (Million), by Country 2024 & 2032
- Figure 20: South America Cancer Treatment Industry Volume (K Unit), by Country 2024 & 2032
- Figure 21: South America Cancer Treatment Industry Revenue Share (%), by Country 2024 & 2032
- Figure 22: South America Cancer Treatment Industry Volume Share (%), by Country 2024 & 2032
- Figure 23: North America Cancer Treatment Industry Revenue (Million), by Therapy Type 2024 & 2032
- Figure 24: North America Cancer Treatment Industry Volume (K Unit), by Therapy Type 2024 & 2032
- Figure 25: North America Cancer Treatment Industry Revenue Share (%), by Therapy Type 2024 & 2032
- Figure 26: North America Cancer Treatment Industry Volume Share (%), by Therapy Type 2024 & 2032
- Figure 27: North America Cancer Treatment Industry Revenue (Million), by Cancer Type 2024 & 2032
- Figure 28: North America Cancer Treatment Industry Volume (K Unit), by Cancer Type 2024 & 2032
- Figure 29: North America Cancer Treatment Industry Revenue Share (%), by Cancer Type 2024 & 2032
- Figure 30: North America Cancer Treatment Industry Volume Share (%), by Cancer Type 2024 & 2032
- Figure 31: North America Cancer Treatment Industry Revenue (Million), by End User 2024 & 2032
- Figure 32: North America Cancer Treatment Industry Volume (K Unit), by End User 2024 & 2032
- Figure 33: North America Cancer Treatment Industry Revenue Share (%), by End User 2024 & 2032
- Figure 34: North America Cancer Treatment Industry Volume Share (%), by End User 2024 & 2032
- Figure 35: North America Cancer Treatment Industry Revenue (Million), by Country 2024 & 2032
- Figure 36: North America Cancer Treatment Industry Volume (K Unit), by Country 2024 & 2032
- Figure 37: North America Cancer Treatment Industry Revenue Share (%), by Country 2024 & 2032
- Figure 38: North America Cancer Treatment Industry Volume Share (%), by Country 2024 & 2032
- Figure 39: Europe Cancer Treatment Industry Revenue (Million), by Therapy Type 2024 & 2032
- Figure 40: Europe Cancer Treatment Industry Volume (K Unit), by Therapy Type 2024 & 2032
- Figure 41: Europe Cancer Treatment Industry Revenue Share (%), by Therapy Type 2024 & 2032
- Figure 42: Europe Cancer Treatment Industry Volume Share (%), by Therapy Type 2024 & 2032
- Figure 43: Europe Cancer Treatment Industry Revenue (Million), by Cancer Type 2024 & 2032
- Figure 44: Europe Cancer Treatment Industry Volume (K Unit), by Cancer Type 2024 & 2032
- Figure 45: Europe Cancer Treatment Industry Revenue Share (%), by Cancer Type 2024 & 2032
- Figure 46: Europe Cancer Treatment Industry Volume Share (%), by Cancer Type 2024 & 2032
- Figure 47: Europe Cancer Treatment Industry Revenue (Million), by End User 2024 & 2032
- Figure 48: Europe Cancer Treatment Industry Volume (K Unit), by End User 2024 & 2032
- Figure 49: Europe Cancer Treatment Industry Revenue Share (%), by End User 2024 & 2032
- Figure 50: Europe Cancer Treatment Industry Volume Share (%), by End User 2024 & 2032
- Figure 51: Europe Cancer Treatment Industry Revenue (Million), by Country 2024 & 2032
- Figure 52: Europe Cancer Treatment Industry Volume (K Unit), by Country 2024 & 2032
- Figure 53: Europe Cancer Treatment Industry Revenue Share (%), by Country 2024 & 2032
- Figure 54: Europe Cancer Treatment Industry Volume Share (%), by Country 2024 & 2032
- Figure 55: Asia Pacific Cancer Treatment Industry Revenue (Million), by Therapy Type 2024 & 2032
- Figure 56: Asia Pacific Cancer Treatment Industry Volume (K Unit), by Therapy Type 2024 & 2032
- Figure 57: Asia Pacific Cancer Treatment Industry Revenue Share (%), by Therapy Type 2024 & 2032
- Figure 58: Asia Pacific Cancer Treatment Industry Volume Share (%), by Therapy Type 2024 & 2032
- Figure 59: Asia Pacific Cancer Treatment Industry Revenue (Million), by Cancer Type 2024 & 2032
- Figure 60: Asia Pacific Cancer Treatment Industry Volume (K Unit), by Cancer Type 2024 & 2032
- Figure 61: Asia Pacific Cancer Treatment Industry Revenue Share (%), by Cancer Type 2024 & 2032
- Figure 62: Asia Pacific Cancer Treatment Industry Volume Share (%), by Cancer Type 2024 & 2032
- Figure 63: Asia Pacific Cancer Treatment Industry Revenue (Million), by End User 2024 & 2032
- Figure 64: Asia Pacific Cancer Treatment Industry Volume (K Unit), by End User 2024 & 2032
- Figure 65: Asia Pacific Cancer Treatment Industry Revenue Share (%), by End User 2024 & 2032
- Figure 66: Asia Pacific Cancer Treatment Industry Volume Share (%), by End User 2024 & 2032
- Figure 67: Asia Pacific Cancer Treatment Industry Revenue (Million), by Country 2024 & 2032
- Figure 68: Asia Pacific Cancer Treatment Industry Volume (K Unit), by Country 2024 & 2032
- Figure 69: Asia Pacific Cancer Treatment Industry Revenue Share (%), by Country 2024 & 2032
- Figure 70: Asia Pacific Cancer Treatment Industry Volume Share (%), by Country 2024 & 2032
- Figure 71: Middle East and Africa Cancer Treatment Industry Revenue (Million), by Therapy Type 2024 & 2032
- Figure 72: Middle East and Africa Cancer Treatment Industry Volume (K Unit), by Therapy Type 2024 & 2032
- Figure 73: Middle East and Africa Cancer Treatment Industry Revenue Share (%), by Therapy Type 2024 & 2032
- Figure 74: Middle East and Africa Cancer Treatment Industry Volume Share (%), by Therapy Type 2024 & 2032
- Figure 75: Middle East and Africa Cancer Treatment Industry Revenue (Million), by Cancer Type 2024 & 2032
- Figure 76: Middle East and Africa Cancer Treatment Industry Volume (K Unit), by Cancer Type 2024 & 2032
- Figure 77: Middle East and Africa Cancer Treatment Industry Revenue Share (%), by Cancer Type 2024 & 2032
- Figure 78: Middle East and Africa Cancer Treatment Industry Volume Share (%), by Cancer Type 2024 & 2032
- Figure 79: Middle East and Africa Cancer Treatment Industry Revenue (Million), by End User 2024 & 2032
- Figure 80: Middle East and Africa Cancer Treatment Industry Volume (K Unit), by End User 2024 & 2032
- Figure 81: Middle East and Africa Cancer Treatment Industry Revenue Share (%), by End User 2024 & 2032
- Figure 82: Middle East and Africa Cancer Treatment Industry Volume Share (%), by End User 2024 & 2032
- Figure 83: Middle East and Africa Cancer Treatment Industry Revenue (Million), by Country 2024 & 2032
- Figure 84: Middle East and Africa Cancer Treatment Industry Volume (K Unit), by Country 2024 & 2032
- Figure 85: Middle East and Africa Cancer Treatment Industry Revenue Share (%), by Country 2024 & 2032
- Figure 86: Middle East and Africa Cancer Treatment Industry Volume Share (%), by Country 2024 & 2032
- Figure 87: South America Cancer Treatment Industry Revenue (Million), by Therapy Type 2024 & 2032
- Figure 88: South America Cancer Treatment Industry Volume (K Unit), by Therapy Type 2024 & 2032
- Figure 89: South America Cancer Treatment Industry Revenue Share (%), by Therapy Type 2024 & 2032
- Figure 90: South America Cancer Treatment Industry Volume Share (%), by Therapy Type 2024 & 2032
- Figure 91: South America Cancer Treatment Industry Revenue (Million), by Cancer Type 2024 & 2032
- Figure 92: South America Cancer Treatment Industry Volume (K Unit), by Cancer Type 2024 & 2032
- Figure 93: South America Cancer Treatment Industry Revenue Share (%), by Cancer Type 2024 & 2032
- Figure 94: South America Cancer Treatment Industry Volume Share (%), by Cancer Type 2024 & 2032
- Figure 95: South America Cancer Treatment Industry Revenue (Million), by End User 2024 & 2032
- Figure 96: South America Cancer Treatment Industry Volume (K Unit), by End User 2024 & 2032
- Figure 97: South America Cancer Treatment Industry Revenue Share (%), by End User 2024 & 2032
- Figure 98: South America Cancer Treatment Industry Volume Share (%), by End User 2024 & 2032
- Figure 99: South America Cancer Treatment Industry Revenue (Million), by Country 2024 & 2032
- Figure 100: South America Cancer Treatment Industry Volume (K Unit), by Country 2024 & 2032
- Figure 101: South America Cancer Treatment Industry Revenue Share (%), by Country 2024 & 2032
- Figure 102: South America Cancer Treatment Industry Volume Share (%), by Country 2024 & 2032
List of Tables
- Table 1: Global Cancer Treatment Industry Revenue Million Forecast, by Region 2019 & 2032
- Table 2: Global Cancer Treatment Industry Volume K Unit Forecast, by Region 2019 & 2032
- Table 3: Global Cancer Treatment Industry Revenue Million Forecast, by Therapy Type 2019 & 2032
- Table 4: Global Cancer Treatment Industry Volume K Unit Forecast, by Therapy Type 2019 & 2032
- Table 5: Global Cancer Treatment Industry Revenue Million Forecast, by Cancer Type 2019 & 2032
- Table 6: Global Cancer Treatment Industry Volume K Unit Forecast, by Cancer Type 2019 & 2032
- Table 7: Global Cancer Treatment Industry Revenue Million Forecast, by End User 2019 & 2032
- Table 8: Global Cancer Treatment Industry Volume K Unit Forecast, by End User 2019 & 2032
- Table 9: Global Cancer Treatment Industry Revenue Million Forecast, by Region 2019 & 2032
- Table 10: Global Cancer Treatment Industry Volume K Unit Forecast, by Region 2019 & 2032
- Table 11: Global Cancer Treatment Industry Revenue Million Forecast, by Country 2019 & 2032
- Table 12: Global Cancer Treatment Industry Volume K Unit Forecast, by Country 2019 & 2032
- Table 13: United States Cancer Treatment Industry Revenue (Million) Forecast, by Application 2019 & 2032
- Table 14: United States Cancer Treatment Industry Volume (K Unit) Forecast, by Application 2019 & 2032
- Table 15: Canada Cancer Treatment Industry Revenue (Million) Forecast, by Application 2019 & 2032
- Table 16: Canada Cancer Treatment Industry Volume (K Unit) Forecast, by Application 2019 & 2032
- Table 17: Mexico Cancer Treatment Industry Revenue (Million) Forecast, by Application 2019 & 2032
- Table 18: Mexico Cancer Treatment Industry Volume (K Unit) Forecast, by Application 2019 & 2032
- Table 19: Global Cancer Treatment Industry Revenue Million Forecast, by Country 2019 & 2032
- Table 20: Global Cancer Treatment Industry Volume K Unit Forecast, by Country 2019 & 2032
- Table 21: Germany Cancer Treatment Industry Revenue (Million) Forecast, by Application 2019 & 2032
- Table 22: Germany Cancer Treatment Industry Volume (K Unit) Forecast, by Application 2019 & 2032
- Table 23: United Kingdom Cancer Treatment Industry Revenue (Million) Forecast, by Application 2019 & 2032
- Table 24: United Kingdom Cancer Treatment Industry Volume (K Unit) Forecast, by Application 2019 & 2032
- Table 25: France Cancer Treatment Industry Revenue (Million) Forecast, by Application 2019 & 2032
- Table 26: France Cancer Treatment Industry Volume (K Unit) Forecast, by Application 2019 & 2032
- Table 27: Italy Cancer Treatment Industry Revenue (Million) Forecast, by Application 2019 & 2032
- Table 28: Italy Cancer Treatment Industry Volume (K Unit) Forecast, by Application 2019 & 2032
- Table 29: Spain Cancer Treatment Industry Revenue (Million) Forecast, by Application 2019 & 2032
- Table 30: Spain Cancer Treatment Industry Volume (K Unit) Forecast, by Application 2019 & 2032
- Table 31: Rest of Europe Cancer Treatment Industry Revenue (Million) Forecast, by Application 2019 & 2032
- Table 32: Rest of Europe Cancer Treatment Industry Volume (K Unit) Forecast, by Application 2019 & 2032
- Table 33: Global Cancer Treatment Industry Revenue Million Forecast, by Country 2019 & 2032
- Table 34: Global Cancer Treatment Industry Volume K Unit Forecast, by Country 2019 & 2032
- Table 35: China Cancer Treatment Industry Revenue (Million) Forecast, by Application 2019 & 2032
- Table 36: China Cancer Treatment Industry Volume (K Unit) Forecast, by Application 2019 & 2032
- Table 37: Japan Cancer Treatment Industry Revenue (Million) Forecast, by Application 2019 & 2032
- Table 38: Japan Cancer Treatment Industry Volume (K Unit) Forecast, by Application 2019 & 2032
- Table 39: India Cancer Treatment Industry Revenue (Million) Forecast, by Application 2019 & 2032
- Table 40: India Cancer Treatment Industry Volume (K Unit) Forecast, by Application 2019 & 2032
- Table 41: Australia Cancer Treatment Industry Revenue (Million) Forecast, by Application 2019 & 2032
- Table 42: Australia Cancer Treatment Industry Volume (K Unit) Forecast, by Application 2019 & 2032
- Table 43: South Korea Cancer Treatment Industry Revenue (Million) Forecast, by Application 2019 & 2032
- Table 44: South Korea Cancer Treatment Industry Volume (K Unit) Forecast, by Application 2019 & 2032
- Table 45: Rest of Asia Pacific Cancer Treatment Industry Revenue (Million) Forecast, by Application 2019 & 2032
- Table 46: Rest of Asia Pacific Cancer Treatment Industry Volume (K Unit) Forecast, by Application 2019 & 2032
- Table 47: Global Cancer Treatment Industry Revenue Million Forecast, by Country 2019 & 2032
- Table 48: Global Cancer Treatment Industry Volume K Unit Forecast, by Country 2019 & 2032
- Table 49: GCC Cancer Treatment Industry Revenue (Million) Forecast, by Application 2019 & 2032
- Table 50: GCC Cancer Treatment Industry Volume (K Unit) Forecast, by Application 2019 & 2032
- Table 51: South Africa Cancer Treatment Industry Revenue (Million) Forecast, by Application 2019 & 2032
- Table 52: South Africa Cancer Treatment Industry Volume (K Unit) Forecast, by Application 2019 & 2032
- Table 53: Rest of Middle East and Africa Cancer Treatment Industry Revenue (Million) Forecast, by Application 2019 & 2032
- Table 54: Rest of Middle East and Africa Cancer Treatment Industry Volume (K Unit) Forecast, by Application 2019 & 2032
- Table 55: Global Cancer Treatment Industry Revenue Million Forecast, by Country 2019 & 2032
- Table 56: Global Cancer Treatment Industry Volume K Unit Forecast, by Country 2019 & 2032
- Table 57: Brazil Cancer Treatment Industry Revenue (Million) Forecast, by Application 2019 & 2032
- Table 58: Brazil Cancer Treatment Industry Volume (K Unit) Forecast, by Application 2019 & 2032
- Table 59: Argentina Cancer Treatment Industry Revenue (Million) Forecast, by Application 2019 & 2032
- Table 60: Argentina Cancer Treatment Industry Volume (K Unit) Forecast, by Application 2019 & 2032
- Table 61: Rest of South America Cancer Treatment Industry Revenue (Million) Forecast, by Application 2019 & 2032
- Table 62: Rest of South America Cancer Treatment Industry Volume (K Unit) Forecast, by Application 2019 & 2032
- Table 63: Global Cancer Treatment Industry Revenue Million Forecast, by Therapy Type 2019 & 2032
- Table 64: Global Cancer Treatment Industry Volume K Unit Forecast, by Therapy Type 2019 & 2032
- Table 65: Global Cancer Treatment Industry Revenue Million Forecast, by Cancer Type 2019 & 2032
- Table 66: Global Cancer Treatment Industry Volume K Unit Forecast, by Cancer Type 2019 & 2032
- Table 67: Global Cancer Treatment Industry Revenue Million Forecast, by End User 2019 & 2032
- Table 68: Global Cancer Treatment Industry Volume K Unit Forecast, by End User 2019 & 2032
- Table 69: Global Cancer Treatment Industry Revenue Million Forecast, by Country 2019 & 2032
- Table 70: Global Cancer Treatment Industry Volume K Unit Forecast, by Country 2019 & 2032
- Table 71: United States Cancer Treatment Industry Revenue (Million) Forecast, by Application 2019 & 2032
- Table 72: United States Cancer Treatment Industry Volume (K Unit) Forecast, by Application 2019 & 2032
- Table 73: Canada Cancer Treatment Industry Revenue (Million) Forecast, by Application 2019 & 2032
- Table 74: Canada Cancer Treatment Industry Volume (K Unit) Forecast, by Application 2019 & 2032
- Table 75: Mexico Cancer Treatment Industry Revenue (Million) Forecast, by Application 2019 & 2032
- Table 76: Mexico Cancer Treatment Industry Volume (K Unit) Forecast, by Application 2019 & 2032
- Table 77: Global Cancer Treatment Industry Revenue Million Forecast, by Therapy Type 2019 & 2032
- Table 78: Global Cancer Treatment Industry Volume K Unit Forecast, by Therapy Type 2019 & 2032
- Table 79: Global Cancer Treatment Industry Revenue Million Forecast, by Cancer Type 2019 & 2032
- Table 80: Global Cancer Treatment Industry Volume K Unit Forecast, by Cancer Type 2019 & 2032
- Table 81: Global Cancer Treatment Industry Revenue Million Forecast, by End User 2019 & 2032
- Table 82: Global Cancer Treatment Industry Volume K Unit Forecast, by End User 2019 & 2032
- Table 83: Global Cancer Treatment Industry Revenue Million Forecast, by Country 2019 & 2032
- Table 84: Global Cancer Treatment Industry Volume K Unit Forecast, by Country 2019 & 2032
- Table 85: Germany Cancer Treatment Industry Revenue (Million) Forecast, by Application 2019 & 2032
- Table 86: Germany Cancer Treatment Industry Volume (K Unit) Forecast, by Application 2019 & 2032
- Table 87: United Kingdom Cancer Treatment Industry Revenue (Million) Forecast, by Application 2019 & 2032
- Table 88: United Kingdom Cancer Treatment Industry Volume (K Unit) Forecast, by Application 2019 & 2032
- Table 89: France Cancer Treatment Industry Revenue (Million) Forecast, by Application 2019 & 2032
- Table 90: France Cancer Treatment Industry Volume (K Unit) Forecast, by Application 2019 & 2032
- Table 91: Italy Cancer Treatment Industry Revenue (Million) Forecast, by Application 2019 & 2032
- Table 92: Italy Cancer Treatment Industry Volume (K Unit) Forecast, by Application 2019 & 2032
- Table 93: Spain Cancer Treatment Industry Revenue (Million) Forecast, by Application 2019 & 2032
- Table 94: Spain Cancer Treatment Industry Volume (K Unit) Forecast, by Application 2019 & 2032
- Table 95: Rest of Europe Cancer Treatment Industry Revenue (Million) Forecast, by Application 2019 & 2032
- Table 96: Rest of Europe Cancer Treatment Industry Volume (K Unit) Forecast, by Application 2019 & 2032
- Table 97: Global Cancer Treatment Industry Revenue Million Forecast, by Therapy Type 2019 & 2032
- Table 98: Global Cancer Treatment Industry Volume K Unit Forecast, by Therapy Type 2019 & 2032
- Table 99: Global Cancer Treatment Industry Revenue Million Forecast, by Cancer Type 2019 & 2032
- Table 100: Global Cancer Treatment Industry Volume K Unit Forecast, by Cancer Type 2019 & 2032
- Table 101: Global Cancer Treatment Industry Revenue Million Forecast, by End User 2019 & 2032
- Table 102: Global Cancer Treatment Industry Volume K Unit Forecast, by End User 2019 & 2032
- Table 103: Global Cancer Treatment Industry Revenue Million Forecast, by Country 2019 & 2032
- Table 104: Global Cancer Treatment Industry Volume K Unit Forecast, by Country 2019 & 2032
- Table 105: China Cancer Treatment Industry Revenue (Million) Forecast, by Application 2019 & 2032
- Table 106: China Cancer Treatment Industry Volume (K Unit) Forecast, by Application 2019 & 2032
- Table 107: Japan Cancer Treatment Industry Revenue (Million) Forecast, by Application 2019 & 2032
- Table 108: Japan Cancer Treatment Industry Volume (K Unit) Forecast, by Application 2019 & 2032
- Table 109: India Cancer Treatment Industry Revenue (Million) Forecast, by Application 2019 & 2032
- Table 110: India Cancer Treatment Industry Volume (K Unit) Forecast, by Application 2019 & 2032
- Table 111: Australia Cancer Treatment Industry Revenue (Million) Forecast, by Application 2019 & 2032
- Table 112: Australia Cancer Treatment Industry Volume (K Unit) Forecast, by Application 2019 & 2032
- Table 113: South Korea Cancer Treatment Industry Revenue (Million) Forecast, by Application 2019 & 2032
- Table 114: South Korea Cancer Treatment Industry Volume (K Unit) Forecast, by Application 2019 & 2032
- Table 115: Rest of Asia Pacific Cancer Treatment Industry Revenue (Million) Forecast, by Application 2019 & 2032
- Table 116: Rest of Asia Pacific Cancer Treatment Industry Volume (K Unit) Forecast, by Application 2019 & 2032
- Table 117: Global Cancer Treatment Industry Revenue Million Forecast, by Therapy Type 2019 & 2032
- Table 118: Global Cancer Treatment Industry Volume K Unit Forecast, by Therapy Type 2019 & 2032
- Table 119: Global Cancer Treatment Industry Revenue Million Forecast, by Cancer Type 2019 & 2032
- Table 120: Global Cancer Treatment Industry Volume K Unit Forecast, by Cancer Type 2019 & 2032
- Table 121: Global Cancer Treatment Industry Revenue Million Forecast, by End User 2019 & 2032
- Table 122: Global Cancer Treatment Industry Volume K Unit Forecast, by End User 2019 & 2032
- Table 123: Global Cancer Treatment Industry Revenue Million Forecast, by Country 2019 & 2032
- Table 124: Global Cancer Treatment Industry Volume K Unit Forecast, by Country 2019 & 2032
- Table 125: GCC Cancer Treatment Industry Revenue (Million) Forecast, by Application 2019 & 2032
- Table 126: GCC Cancer Treatment Industry Volume (K Unit) Forecast, by Application 2019 & 2032
- Table 127: South Africa Cancer Treatment Industry Revenue (Million) Forecast, by Application 2019 & 2032
- Table 128: South Africa Cancer Treatment Industry Volume (K Unit) Forecast, by Application 2019 & 2032
- Table 129: Rest of Middle East and Africa Cancer Treatment Industry Revenue (Million) Forecast, by Application 2019 & 2032
- Table 130: Rest of Middle East and Africa Cancer Treatment Industry Volume (K Unit) Forecast, by Application 2019 & 2032
- Table 131: Global Cancer Treatment Industry Revenue Million Forecast, by Therapy Type 2019 & 2032
- Table 132: Global Cancer Treatment Industry Volume K Unit Forecast, by Therapy Type 2019 & 2032
- Table 133: Global Cancer Treatment Industry Revenue Million Forecast, by Cancer Type 2019 & 2032
- Table 134: Global Cancer Treatment Industry Volume K Unit Forecast, by Cancer Type 2019 & 2032
- Table 135: Global Cancer Treatment Industry Revenue Million Forecast, by End User 2019 & 2032
- Table 136: Global Cancer Treatment Industry Volume K Unit Forecast, by End User 2019 & 2032
- Table 137: Global Cancer Treatment Industry Revenue Million Forecast, by Country 2019 & 2032
- Table 138: Global Cancer Treatment Industry Volume K Unit Forecast, by Country 2019 & 2032
- Table 139: Brazil Cancer Treatment Industry Revenue (Million) Forecast, by Application 2019 & 2032
- Table 140: Brazil Cancer Treatment Industry Volume (K Unit) Forecast, by Application 2019 & 2032
- Table 141: Argentina Cancer Treatment Industry Revenue (Million) Forecast, by Application 2019 & 2032
- Table 142: Argentina Cancer Treatment Industry Volume (K Unit) Forecast, by Application 2019 & 2032
- Table 143: Rest of South America Cancer Treatment Industry Revenue (Million) Forecast, by Application 2019 & 2032
- Table 144: Rest of South America Cancer Treatment Industry Volume (K Unit) Forecast, by Application 2019 & 2032
Frequently Asked Questions
1. What is the projected Compound Annual Growth Rate (CAGR) of the Cancer Treatment Industry?
The projected CAGR is approximately 10.64%.
2. Which companies are prominent players in the Cancer Treatment Industry?
Key companies in the market include F Hoffmann-La Roche AG, Celldex Therapeutics Inc , Gilead Sciences Inc (Kite Pharma), Bayer AG, Astellas Pharma Inc, Novartis AG, Amgen Inc, Merck & Co Inc, Takeda Pharmaceutical Company Limited, AstraZeneca, Abbvie Inc, GSK PLC, Lilly, Bristol Myers Squibb Company, Johnson & Johnson Services Inc, Alaunos Therapeutics Inc, Pfizer Inc.
3. What are the main segments of the Cancer Treatment Industry?
The market segments include Therapy Type, Cancer Type, End User.
4. Can you provide details about the market size?
The market size is estimated to be USD 220.24 Million as of 2022.
5. What are some drivers contributing to market growth?
Increasing Patient Assistance Programs (PAPs) and Rising Demand for Personalized Medicine; Growing Government Initiatives for Cancer Awareness; Rising Prevalence of Cancer Worldwide; Strong R&D Initiatives from Key Players.
6. What are the notable trends driving market growth?
The Targeted Therapy Segment is Expected to Witness Significant Growth during the the Forecast Period.
7. Are there any restraints impacting market growth?
Fluctuation in Reimbursement Policies; High Cost of Cancer Therapies.
8. Can you provide examples of recent developments in the market?
In May 2023, Genmab A/S received USFDA approval for its T-cell engaging bispecific antibody, EPKINLY (epcoritamab-bysp), which was intended for the treatment of relapsed or refractory (R/R) diffuse large B-cell lymphoma (DLBCL) in adult patients.
9. What pricing options are available for accessing the report?
Pricing options include single-user, multi-user, and enterprise licenses priced at USD 4750, USD 5250, and USD 8750 respectively.
10. Is the market size provided in terms of value or volume?
The market size is provided in terms of value, measured in Million and volume, measured in K Unit.
11. Are there any specific market keywords associated with the report?
Yes, the market keyword associated with the report is "Cancer Treatment Industry," which aids in identifying and referencing the specific market segment covered.
12. How do I determine which pricing option suits my needs best?
The pricing options vary based on user requirements and access needs. Individual users may opt for single-user licenses, while businesses requiring broader access may choose multi-user or enterprise licenses for cost-effective access to the report.
13. Are there any additional resources or data provided in the Cancer Treatment Industry report?
While the report offers comprehensive insights, it's advisable to review the specific contents or supplementary materials provided to ascertain if additional resources or data are available.
14. How can I stay updated on further developments or reports in the Cancer Treatment Industry?
To stay informed about further developments, trends, and reports in the Cancer Treatment Industry, consider subscribing to industry newsletters, following relevant companies and organizations, or regularly checking reputable industry news sources and publications.
Methodology
Step 1 - Identification of Relevant Samples Size from Population Database


Step 2 - Approaches for Defining Global Market Size (Value, Volume* & Price*)

Note*: In applicable scenarios
Step 3 - Data Sources
Primary Research
- Web Analytics
- Survey Reports
- Research Institute
- Latest Research Reports
- Opinion Leaders
Secondary Research
- Annual Reports
- White Paper
- Latest Press Release
- Industry Association
- Paid Database
- Investor Presentations

Step 4 - Data Triangulation
Involves using different sources of information in order to increase the validity of a study
These sources are likely to be stakeholders in a program - participants, other researchers, program staff, other community members, and so on.
Then we put all data in single framework & apply various statistical tools to find out the dynamic on the market.
During the analysis stage, feedback from the stakeholder groups would be compared to determine areas of agreement as well as areas of divergence


