

Key Insights
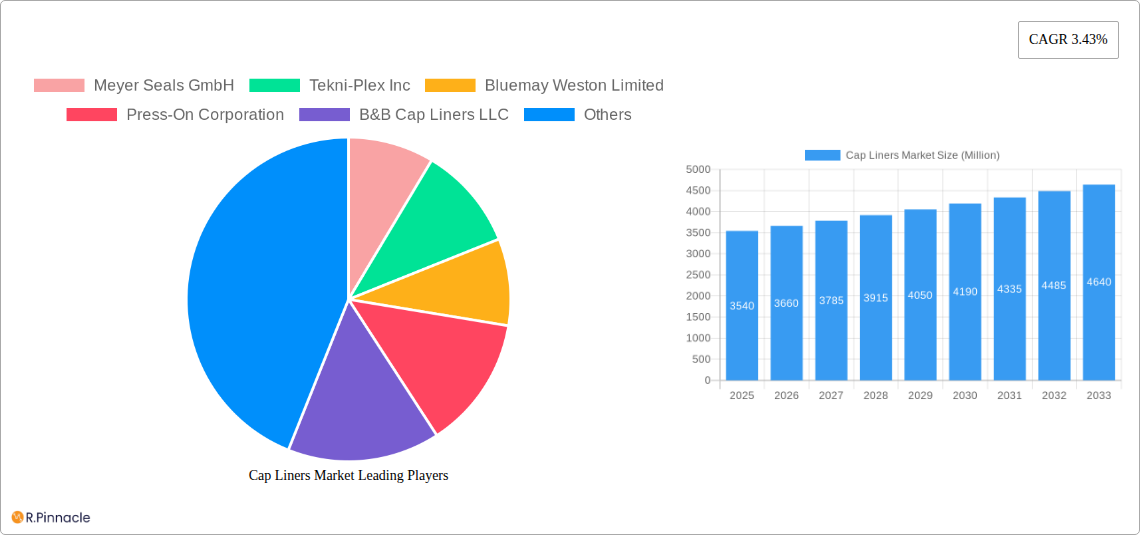
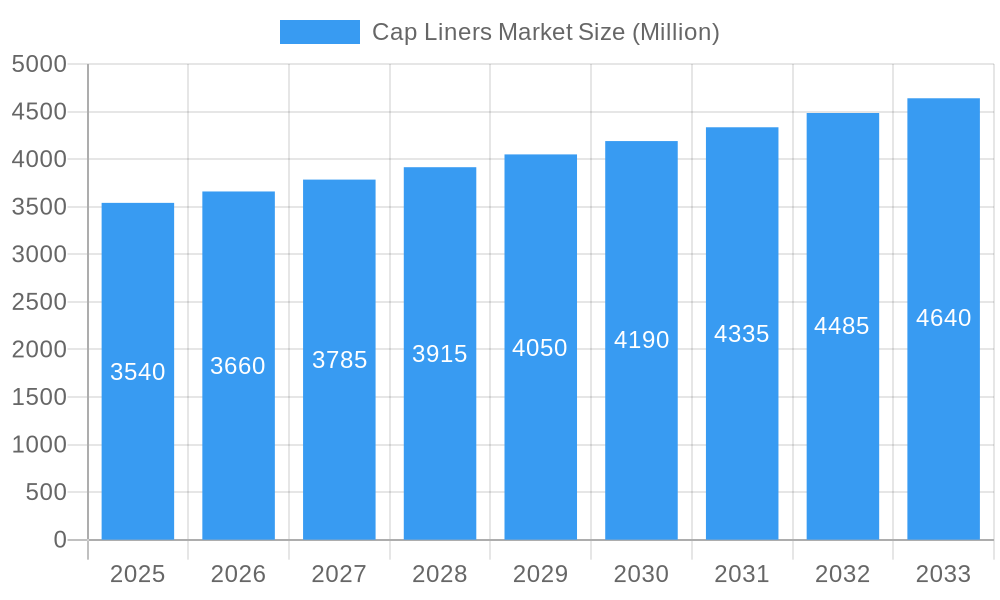
The global cap liners market, valued at approximately $3.54 billion in 2025, is projected to experience steady growth, driven by the expanding packaging industry and increasing demand for tamper-evident and hygienic closures across diverse sectors, including food and beverages, pharmaceuticals, and cosmetics. A compound annual growth rate (CAGR) of 3.43% from 2025 to 2033 indicates a consistent market expansion. Key drivers include the growing preference for convenient and safe packaging solutions, the increasing adoption of sustainable and eco-friendly materials in cap liners, and advancements in liner technology offering improved sealing performance and barrier properties. The market is segmented by material type (e.g., foam, paper, plastic), application (e.g., bottles, jars, containers), and geography. Competition is relatively fragmented, with various regional and international players, including Meyer Seals GmbH, Tekni-Plex Inc., and others. Growth will likely be influenced by fluctuations in raw material prices and evolving consumer preferences towards specific packaging attributes.
Cap Liners Market Market Size (In Billion)
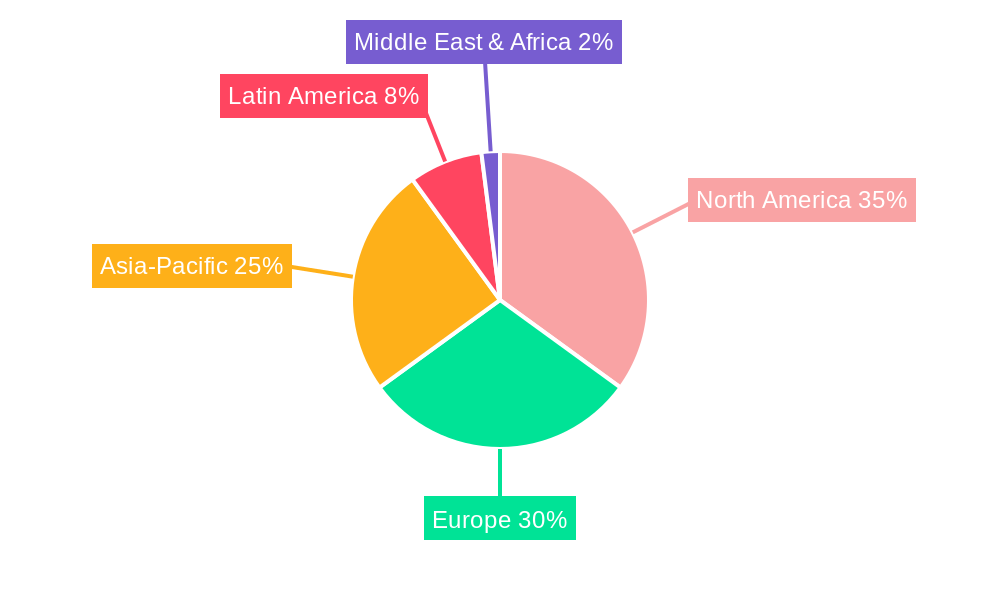
The forecast period (2025-2033) suggests continued expansion, fueled by factors such as rising disposable incomes in developing economies, leading to increased consumption of packaged goods. However, potential restraints include stringent regulatory standards regarding material safety and environmental concerns related to the use of certain liner materials. Companies are investing in research and development to address these challenges, developing innovative and sustainable liner solutions. Geographic market share distribution will vary, with North America and Europe potentially holding significant portions, while emerging economies in Asia and Latin America are expected to witness faster growth rates due to their expanding manufacturing and consumer goods sectors. The market’s future trajectory is dependent upon adapting to consumer demand for eco-friendly materials, technological advancements within the packaging industry, and navigating evolving regulatory landscapes.
Cap Liners Market Company Market Share
Cap Liners Market: A Comprehensive Report (2019-2033)
This comprehensive report provides an in-depth analysis of the global Cap Liners Market, offering invaluable insights for industry professionals, investors, and strategic decision-makers. With a study period spanning 2019-2033, a base year of 2025, and a forecast period of 2025-2033, this report leverages extensive market research to deliver actionable intelligence on market size (projected at $XX Million by 2033), growth drivers, challenges, and emerging opportunities.
Cap Liners Market Structure & Innovation Trends
The Cap Liners Market exhibits a moderately fragmented structure, with several key players competing for market share. While precise market share figures for each company are unavailable at this time, leading players such as Meyer Seals GmbH, Tekni-Plex Inc, and Bluemay Weston Limited hold significant positions. The market is characterized by continuous innovation, driven by the increasing demand for sustainable and high-performance cap liners across diverse end-use industries. Regulatory frameworks, particularly those concerning food safety and environmental regulations, significantly influence product development and market dynamics. The presence of substitute materials, such as alternative sealing technologies, presents ongoing competitive pressure. Mergers and acquisitions (M&A) activity within the sector has been relatively low in recent years, with total M&A deal values estimated at $XX Million in the historical period (2019-2024). End-user demographics are broad, spanning food and beverage, pharmaceuticals, cosmetics, and chemicals.
- Market Concentration: Moderately fragmented
- Innovation Drivers: Sustainability, performance enhancement, regulatory compliance
- M&A Activity (2019-2024): $XX Million (estimated)
Cap Liners Market Dynamics & Trends
The global Cap Liners Market is experiencing robust growth, driven by several key factors. The rising demand for packaged goods across various sectors fuels market expansion. Technological advancements, including the development of sustainable and recyclable materials like those introduced by TekniPlex in January 2024, are significantly impacting market dynamics. Consumer preferences are shifting towards eco-friendly and convenient packaging solutions. The competitive landscape is highly dynamic, with companies constantly striving for innovation and differentiation. The market is projected to witness a Compound Annual Growth Rate (CAGR) of XX% during the forecast period (2025-2033), with market penetration increasing across various regions.
Dominant Regions & Segments in Cap Liners Market
While precise regional dominance data is not readily available, the North American and European markets are expected to be leading regions in the Cap Liners Market due to robust consumer spending, developed infrastructure, and the presence of several major market players. The Asia-Pacific region is expected to experience significant growth driven by rising disposable income and rapid industrialization.
- Key Drivers (North America): Established infrastructure, high consumer spending, strong regulatory frameworks.
- Key Drivers (Europe): Stringent environmental regulations driving demand for sustainable solutions, established supply chains.
- Key Drivers (Asia-Pacific): Rapid industrialization, rising disposable incomes, growing packaged goods consumption.
Cap Liners Market Product Innovations
Recent product innovations include the introduction of recyclable paper-based induction heat seal liners by TekniPlex and new full-face foam liners from W. L. Gore & Associates designed for aggressive chemicals. These innovations focus on sustainability, enhanced performance, and improved chemical resistance, reflecting the market's ongoing trend toward environmentally friendly and highly effective solutions. This directly addresses increasing consumer and regulatory demands for sustainable and high-performing packaging.
Report Scope & Segmentation Analysis
The Cap Liners Market is segmented by material type (e.g., foam, paper, plastic), application (e.g., food & beverage, pharmaceuticals, personal care), and region. Each segment presents unique growth opportunities and challenges. For example, the foam liner segment is expected to maintain a sizable share owing to its versatility, while the paper-based segment is rapidly growing due to increasing environmental concerns. Growth projections vary considerably across segments, reflecting diverse market dynamics.
Key Drivers of Cap Liners Market Growth
Several key factors fuel the Cap Liners Market’s growth. The rising demand for packaged goods across multiple sectors is a primary driver. Technological advancements in materials science, leading to more sustainable and efficient cap liners, also contribute to market expansion. Furthermore, stringent regulatory compliance related to food safety and environmental protection necessitate high-quality, compliant cap liners.
Challenges in the Cap Liners Market Sector
The Cap Liners Market faces challenges including fluctuations in raw material prices, stringent regulatory compliance requirements, and intense competition. Supply chain disruptions can also impact production and delivery. These factors may impose constraints on market growth if not appropriately managed. Estimated economic impact of these factors is $XX million annually (estimated).
Emerging Opportunities in Cap Liners Market
Emerging opportunities include the growing demand for sustainable and eco-friendly cap liners made from recycled materials. The increasing adoption of innovative technologies, such as smart packaging solutions integrated with cap liners, offers significant potential for growth. Expansion into new markets such as emerging economies with rapidly increasing consumer demand also presents significant opportunities.
Leading Players in the Cap Liners Market Market
- Meyer Seals GmbH
- Tekni-Plex Inc
- Bluemay Weston Limited
- Press-On Corporation
- B&B Cap Liners LLC
- Low's Cap Seal Sdn Bhd
- Tien Lik Cap Seal Sdn Bhd
- Captel International Pvt Ltd
- The Cary Company
- Selig UK Limited
- M F I Capliners
- *List Not Exhaustive
Key Developments in Cap Liners Market Industry
- January 2024: TekniPlex launched its ProTecSeals Recyclable IHS Liners, marking a significant step towards sustainable packaging solutions.
- August 2024: W. L. Gore & Associates introduced two new 3FL cap liners (3FL-363 and 3FL-373), enhancing chemical resistance for agricultural and household applications.
Future Outlook for Cap Liners Market Market
The Cap Liners Market is poised for continued growth, fueled by increasing consumer demand, technological innovation, and a growing focus on sustainability. Strategic partnerships, product diversification, and expansion into new markets will be crucial for success in this dynamic sector. The market is expected to witness substantial growth in the coming years, driven by the factors outlined throughout this report.
Cap Liners Market Segmentation
-
1. Material Type
- 1.1. Rubber
- 1.2. Metal
- 1.3. Plastic
- 1.4. Paper
-
2. Application
- 2.1. Bottles
- 2.2. Jars & Containers
-
3. Product Type
-
3.1. Heat-induction Cap Liners
- 3.1.1. One-piece
- 3.1.2. Two-piece
- 3.1.3. Halfmoon Liner
- 3.1.4. Other Heat-induction Cap Liners
- 3.2. Pressure Sensitive Liners
- 3.3. Other Product Types
-
3.1. Heat-induction Cap Liners
-
4. End-user Industry
- 4.1. Food
- 4.2. Beverage
- 4.3. Personal Care & Cosmetics
- 4.4. Chemicals & Fertilizers
- 4.5. Oil, Lubricants, and Grease
- 4.6. Home Care
- 4.7. Other End-user Industries
Cap Liners Market Segmentation By Geography
-
1. North America
- 1.1. United States
- 1.2. Canada
-
2. Europe
- 2.1. France
- 2.2. Germany
- 2.3. Spain
- 2.4. United Kingdom
- 2.5. Turkey
-
3. Asia Pacific
- 3.1. China
- 3.2. India
- 3.3. Japan
- 3.4. Thailand
- 3.5. Australia and New Zealand
-
4. Latin America
- 4.1. Brazil
- 4.2. Mexico
-
5. Middle East and Africa
- 5.1. United Arab Emirates
- 5.2. Saudi Arabia
- 5.3. Egypt
- 5.4. South Africa
Cap Liners Market Regional Market Share
Geographic Coverage of Cap Liners Market
Cap Liners Market REPORT HIGHLIGHTS
| Aspects | Details |
|---|---|
| Study Period | 2020-2034 |
| Base Year | 2025 |
| Estimated Year | 2026 |
| Forecast Period | 2026-2034 |
| Historical Period | 2020-2025 |
| Growth Rate | CAGR of 3.43% from 2020-2034 |
| Segmentation |
|
Table of Contents
- 1. Introduction
- 1.1. Research Scope
- 1.2. Market Segmentation
- 1.3. Research Objective
- 1.4. Definitions and Assumptions
- 2. Executive Summary
- 2.1. Market Snapshot
- 3. Market Dynamics
- 3.1. Market Drivers
- 3.2. Market Restrains
- 3.3. Market Trends
- 3.4. Market Opportunities
- 4. Market Factor Analysis
- 4.1. Porters Five Forces
- 4.1.1. Bargaining Power of Suppliers
- 4.1.2. Bargaining Power of Buyers
- 4.1.3. Threat of New Entrants
- 4.1.4. Threat of Substitutes
- 4.1.5. Competitive Rivalry
- 4.2. PESTEL analysis
- 4.3. BCG Analysis
- 4.3.1. Stars (High Growth, High Market Share)
- 4.3.2. Cash Cows (Low Growth, High Market Share)
- 4.3.3. Question Mark (High Growth, Low Market Share)
- 4.3.4. Dogs (Low Growth, Low Market Share)
- 4.4. Ansoff Matrix Analysis
- 4.5. Supply Chain Analysis
- 4.6. Regulatory Landscape
- 4.7. Current Market Potential and Opportunity Assessment (TAM–SAM–SOM Framework)
- 4.8. PRI Analyst Note
- 4.1. Porters Five Forces
- 5. Market Analysis, Insights and Forecast 2021-2033
- 5.1. Market Analysis, Insights and Forecast - by Material Type
- 5.1.1. Rubber
- 5.1.2. Metal
- 5.1.3. Plastic
- 5.1.4. Paper
- 5.2. Market Analysis, Insights and Forecast - by Application
- 5.2.1. Bottles
- 5.2.2. Jars & Containers
- 5.3. Market Analysis, Insights and Forecast - by Product Type
- 5.3.1. Heat-induction Cap Liners
- 5.3.1.1. One-piece
- 5.3.1.2. Two-piece
- 5.3.1.3. Halfmoon Liner
- 5.3.1.4. Other Heat-induction Cap Liners
- 5.3.2. Pressure Sensitive Liners
- 5.3.3. Other Product Types
- 5.3.1. Heat-induction Cap Liners
- 5.4. Market Analysis, Insights and Forecast - by End-user Industry
- 5.4.1. Food
- 5.4.2. Beverage
- 5.4.3. Personal Care & Cosmetics
- 5.4.4. Chemicals & Fertilizers
- 5.4.5. Oil, Lubricants, and Grease
- 5.4.6. Home Care
- 5.4.7. Other End-user Industries
- 5.5. Market Analysis, Insights and Forecast - by Region
- 5.5.1. North America
- 5.5.2. Europe
- 5.5.3. Asia Pacific
- 5.5.4. Latin America
- 5.5.5. Middle East and Africa
- 5.1. Market Analysis, Insights and Forecast - by Material Type
- 6. Global Cap Liners Market Analysis, Insights and Forecast, 2021-2033
- 6.1. Market Analysis, Insights and Forecast - by Material Type
- 6.1.1. Rubber
- 6.1.2. Metal
- 6.1.3. Plastic
- 6.1.4. Paper
- 6.2. Market Analysis, Insights and Forecast - by Application
- 6.2.1. Bottles
- 6.2.2. Jars & Containers
- 6.3. Market Analysis, Insights and Forecast - by Product Type
- 6.3.1. Heat-induction Cap Liners
- 6.3.1.1. One-piece
- 6.3.1.2. Two-piece
- 6.3.1.3. Halfmoon Liner
- 6.3.1.4. Other Heat-induction Cap Liners
- 6.3.2. Pressure Sensitive Liners
- 6.3.3. Other Product Types
- 6.3.1. Heat-induction Cap Liners
- 6.4. Market Analysis, Insights and Forecast - by End-user Industry
- 6.4.1. Food
- 6.4.2. Beverage
- 6.4.3. Personal Care & Cosmetics
- 6.4.4. Chemicals & Fertilizers
- 6.4.5. Oil, Lubricants, and Grease
- 6.4.6. Home Care
- 6.4.7. Other End-user Industries
- 6.1. Market Analysis, Insights and Forecast - by Material Type
- 7. North America Cap Liners Market Analysis, Insights and Forecast, 2020-2032
- 7.1. Market Analysis, Insights and Forecast - by Material Type
- 7.1.1. Rubber
- 7.1.2. Metal
- 7.1.3. Plastic
- 7.1.4. Paper
- 7.2. Market Analysis, Insights and Forecast - by Application
- 7.2.1. Bottles
- 7.2.2. Jars & Containers
- 7.3. Market Analysis, Insights and Forecast - by Product Type
- 7.3.1. Heat-induction Cap Liners
- 7.3.1.1. One-piece
- 7.3.1.2. Two-piece
- 7.3.1.3. Halfmoon Liner
- 7.3.1.4. Other Heat-induction Cap Liners
- 7.3.2. Pressure Sensitive Liners
- 7.3.3. Other Product Types
- 7.3.1. Heat-induction Cap Liners
- 7.4. Market Analysis, Insights and Forecast - by End-user Industry
- 7.4.1. Food
- 7.4.2. Beverage
- 7.4.3. Personal Care & Cosmetics
- 7.4.4. Chemicals & Fertilizers
- 7.4.5. Oil, Lubricants, and Grease
- 7.4.6. Home Care
- 7.4.7. Other End-user Industries
- 7.1. Market Analysis, Insights and Forecast - by Material Type
- 8. Europe Cap Liners Market Analysis, Insights and Forecast, 2020-2032
- 8.1. Market Analysis, Insights and Forecast - by Material Type
- 8.1.1. Rubber
- 8.1.2. Metal
- 8.1.3. Plastic
- 8.1.4. Paper
- 8.2. Market Analysis, Insights and Forecast - by Application
- 8.2.1. Bottles
- 8.2.2. Jars & Containers
- 8.3. Market Analysis, Insights and Forecast - by Product Type
- 8.3.1. Heat-induction Cap Liners
- 8.3.1.1. One-piece
- 8.3.1.2. Two-piece
- 8.3.1.3. Halfmoon Liner
- 8.3.1.4. Other Heat-induction Cap Liners
- 8.3.2. Pressure Sensitive Liners
- 8.3.3. Other Product Types
- 8.3.1. Heat-induction Cap Liners
- 8.4. Market Analysis, Insights and Forecast - by End-user Industry
- 8.4.1. Food
- 8.4.2. Beverage
- 8.4.3. Personal Care & Cosmetics
- 8.4.4. Chemicals & Fertilizers
- 8.4.5. Oil, Lubricants, and Grease
- 8.4.6. Home Care
- 8.4.7. Other End-user Industries
- 8.1. Market Analysis, Insights and Forecast - by Material Type
- 9. Asia Pacific Cap Liners Market Analysis, Insights and Forecast, 2020-2032
- 9.1. Market Analysis, Insights and Forecast - by Material Type
- 9.1.1. Rubber
- 9.1.2. Metal
- 9.1.3. Plastic
- 9.1.4. Paper
- 9.2. Market Analysis, Insights and Forecast - by Application
- 9.2.1. Bottles
- 9.2.2. Jars & Containers
- 9.3. Market Analysis, Insights and Forecast - by Product Type
- 9.3.1. Heat-induction Cap Liners
- 9.3.1.1. One-piece
- 9.3.1.2. Two-piece
- 9.3.1.3. Halfmoon Liner
- 9.3.1.4. Other Heat-induction Cap Liners
- 9.3.2. Pressure Sensitive Liners
- 9.3.3. Other Product Types
- 9.3.1. Heat-induction Cap Liners
- 9.4. Market Analysis, Insights and Forecast - by End-user Industry
- 9.4.1. Food
- 9.4.2. Beverage
- 9.4.3. Personal Care & Cosmetics
- 9.4.4. Chemicals & Fertilizers
- 9.4.5. Oil, Lubricants, and Grease
- 9.4.6. Home Care
- 9.4.7. Other End-user Industries
- 9.1. Market Analysis, Insights and Forecast - by Material Type
- 10. Latin America Cap Liners Market Analysis, Insights and Forecast, 2020-2032
- 10.1. Market Analysis, Insights and Forecast - by Material Type
- 10.1.1. Rubber
- 10.1.2. Metal
- 10.1.3. Plastic
- 10.1.4. Paper
- 10.2. Market Analysis, Insights and Forecast - by Application
- 10.2.1. Bottles
- 10.2.2. Jars & Containers
- 10.3. Market Analysis, Insights and Forecast - by Product Type
- 10.3.1. Heat-induction Cap Liners
- 10.3.1.1. One-piece
- 10.3.1.2. Two-piece
- 10.3.1.3. Halfmoon Liner
- 10.3.1.4. Other Heat-induction Cap Liners
- 10.3.2. Pressure Sensitive Liners
- 10.3.3. Other Product Types
- 10.3.1. Heat-induction Cap Liners
- 10.4. Market Analysis, Insights and Forecast - by End-user Industry
- 10.4.1. Food
- 10.4.2. Beverage
- 10.4.3. Personal Care & Cosmetics
- 10.4.4. Chemicals & Fertilizers
- 10.4.5. Oil, Lubricants, and Grease
- 10.4.6. Home Care
- 10.4.7. Other End-user Industries
- 10.1. Market Analysis, Insights and Forecast - by Material Type
- 11. Middle East and Africa Cap Liners Market Analysis, Insights and Forecast, 2020-2032
- 11.1. Market Analysis, Insights and Forecast - by Material Type
- 11.1.1. Rubber
- 11.1.2. Metal
- 11.1.3. Plastic
- 11.1.4. Paper
- 11.2. Market Analysis, Insights and Forecast - by Application
- 11.2.1. Bottles
- 11.2.2. Jars & Containers
- 11.3. Market Analysis, Insights and Forecast - by Product Type
- 11.3.1. Heat-induction Cap Liners
- 11.3.1.1. One-piece
- 11.3.1.2. Two-piece
- 11.3.1.3. Halfmoon Liner
- 11.3.1.4. Other Heat-induction Cap Liners
- 11.3.2. Pressure Sensitive Liners
- 11.3.3. Other Product Types
- 11.3.1. Heat-induction Cap Liners
- 11.4. Market Analysis, Insights and Forecast - by End-user Industry
- 11.4.1. Food
- 11.4.2. Beverage
- 11.4.3. Personal Care & Cosmetics
- 11.4.4. Chemicals & Fertilizers
- 11.4.5. Oil, Lubricants, and Grease
- 11.4.6. Home Care
- 11.4.7. Other End-user Industries
- 11.1. Market Analysis, Insights and Forecast - by Material Type
- 12. Competitive Analysis
- 12.1. Company Profiles
- 12.1.1 Meyer Seals GmbH
- 12.1.1.1. Company Overview
- 12.1.1.2. Products
- 12.1.1.3. Company Financials
- 12.1.1.4. SWOT Analysis
- 12.1.2 Tekni-Plex Inc
- 12.1.2.1. Company Overview
- 12.1.2.2. Products
- 12.1.2.3. Company Financials
- 12.1.2.4. SWOT Analysis
- 12.1.3 Bluemay Weston Limited
- 12.1.3.1. Company Overview
- 12.1.3.2. Products
- 12.1.3.3. Company Financials
- 12.1.3.4. SWOT Analysis
- 12.1.4 Press-On Corporation
- 12.1.4.1. Company Overview
- 12.1.4.2. Products
- 12.1.4.3. Company Financials
- 12.1.4.4. SWOT Analysis
- 12.1.5 B&B Cap Liners LLC
- 12.1.5.1. Company Overview
- 12.1.5.2. Products
- 12.1.5.3. Company Financials
- 12.1.5.4. SWOT Analysis
- 12.1.6 Low's Cap Seal Sdn Bhd
- 12.1.6.1. Company Overview
- 12.1.6.2. Products
- 12.1.6.3. Company Financials
- 12.1.6.4. SWOT Analysis
- 12.1.7 Tien Lik Cap Seal Sdn Bhd
- 12.1.7.1. Company Overview
- 12.1.7.2. Products
- 12.1.7.3. Company Financials
- 12.1.7.4. SWOT Analysis
- 12.1.8 Captel International Pvt Ltd
- 12.1.8.1. Company Overview
- 12.1.8.2. Products
- 12.1.8.3. Company Financials
- 12.1.8.4. SWOT Analysis
- 12.1.9 The Cary Company
- 12.1.9.1. Company Overview
- 12.1.9.2. Products
- 12.1.9.3. Company Financials
- 12.1.9.4. SWOT Analysis
- 12.1.10 Selig UK Limited
- 12.1.10.1. Company Overview
- 12.1.10.2. Products
- 12.1.10.3. Company Financials
- 12.1.10.4. SWOT Analysis
- 12.1.11 M F I Capliners*List Not Exhaustive
- 12.1.11.1. Company Overview
- 12.1.11.2. Products
- 12.1.11.3. Company Financials
- 12.1.11.4. SWOT Analysis
- 12.1.1 Meyer Seals GmbH
- 12.2. Market Entropy
- 12.2.1 Company's Key Areas Served
- 12.2.2 Recent Developments
- 12.3. Company Market Share Analysis 2025
- 12.3.1 Top 5 Companies Market Share Analysis
- 12.3.2 Top 3 Companies Market Share Analysis
- 12.4. List of Potential Customers
- 13. Research Methodology
List of Figures
- Figure 1: Global Cap Liners Market Revenue Breakdown (Million, %) by Region 2025 & 2033
- Figure 2: Global Cap Liners Market Volume Breakdown (Billion, %) by Region 2025 & 2033
- Figure 3: North America Cap Liners Market Revenue (Million), by Material Type 2025 & 2033
- Figure 4: North America Cap Liners Market Volume (Billion), by Material Type 2025 & 2033
- Figure 5: North America Cap Liners Market Revenue Share (%), by Material Type 2025 & 2033
- Figure 6: North America Cap Liners Market Volume Share (%), by Material Type 2025 & 2033
- Figure 7: North America Cap Liners Market Revenue (Million), by Application 2025 & 2033
- Figure 8: North America Cap Liners Market Volume (Billion), by Application 2025 & 2033
- Figure 9: North America Cap Liners Market Revenue Share (%), by Application 2025 & 2033
- Figure 10: North America Cap Liners Market Volume Share (%), by Application 2025 & 2033
- Figure 11: North America Cap Liners Market Revenue (Million), by Product Type 2025 & 2033
- Figure 12: North America Cap Liners Market Volume (Billion), by Product Type 2025 & 2033
- Figure 13: North America Cap Liners Market Revenue Share (%), by Product Type 2025 & 2033
- Figure 14: North America Cap Liners Market Volume Share (%), by Product Type 2025 & 2033
- Figure 15: North America Cap Liners Market Revenue (Million), by End-user Industry 2025 & 2033
- Figure 16: North America Cap Liners Market Volume (Billion), by End-user Industry 2025 & 2033
- Figure 17: North America Cap Liners Market Revenue Share (%), by End-user Industry 2025 & 2033
- Figure 18: North America Cap Liners Market Volume Share (%), by End-user Industry 2025 & 2033
- Figure 19: North America Cap Liners Market Revenue (Million), by Country 2025 & 2033
- Figure 20: North America Cap Liners Market Volume (Billion), by Country 2025 & 2033
- Figure 21: North America Cap Liners Market Revenue Share (%), by Country 2025 & 2033
- Figure 22: North America Cap Liners Market Volume Share (%), by Country 2025 & 2033
- Figure 23: Europe Cap Liners Market Revenue (Million), by Material Type 2025 & 2033
- Figure 24: Europe Cap Liners Market Volume (Billion), by Material Type 2025 & 2033
- Figure 25: Europe Cap Liners Market Revenue Share (%), by Material Type 2025 & 2033
- Figure 26: Europe Cap Liners Market Volume Share (%), by Material Type 2025 & 2033
- Figure 27: Europe Cap Liners Market Revenue (Million), by Application 2025 & 2033
- Figure 28: Europe Cap Liners Market Volume (Billion), by Application 2025 & 2033
- Figure 29: Europe Cap Liners Market Revenue Share (%), by Application 2025 & 2033
- Figure 30: Europe Cap Liners Market Volume Share (%), by Application 2025 & 2033
- Figure 31: Europe Cap Liners Market Revenue (Million), by Product Type 2025 & 2033
- Figure 32: Europe Cap Liners Market Volume (Billion), by Product Type 2025 & 2033
- Figure 33: Europe Cap Liners Market Revenue Share (%), by Product Type 2025 & 2033
- Figure 34: Europe Cap Liners Market Volume Share (%), by Product Type 2025 & 2033
- Figure 35: Europe Cap Liners Market Revenue (Million), by End-user Industry 2025 & 2033
- Figure 36: Europe Cap Liners Market Volume (Billion), by End-user Industry 2025 & 2033
- Figure 37: Europe Cap Liners Market Revenue Share (%), by End-user Industry 2025 & 2033
- Figure 38: Europe Cap Liners Market Volume Share (%), by End-user Industry 2025 & 2033
- Figure 39: Europe Cap Liners Market Revenue (Million), by Country 2025 & 2033
- Figure 40: Europe Cap Liners Market Volume (Billion), by Country 2025 & 2033
- Figure 41: Europe Cap Liners Market Revenue Share (%), by Country 2025 & 2033
- Figure 42: Europe Cap Liners Market Volume Share (%), by Country 2025 & 2033
- Figure 43: Asia Pacific Cap Liners Market Revenue (Million), by Material Type 2025 & 2033
- Figure 44: Asia Pacific Cap Liners Market Volume (Billion), by Material Type 2025 & 2033
- Figure 45: Asia Pacific Cap Liners Market Revenue Share (%), by Material Type 2025 & 2033
- Figure 46: Asia Pacific Cap Liners Market Volume Share (%), by Material Type 2025 & 2033
- Figure 47: Asia Pacific Cap Liners Market Revenue (Million), by Application 2025 & 2033
- Figure 48: Asia Pacific Cap Liners Market Volume (Billion), by Application 2025 & 2033
- Figure 49: Asia Pacific Cap Liners Market Revenue Share (%), by Application 2025 & 2033
- Figure 50: Asia Pacific Cap Liners Market Volume Share (%), by Application 2025 & 2033
- Figure 51: Asia Pacific Cap Liners Market Revenue (Million), by Product Type 2025 & 2033
- Figure 52: Asia Pacific Cap Liners Market Volume (Billion), by Product Type 2025 & 2033
- Figure 53: Asia Pacific Cap Liners Market Revenue Share (%), by Product Type 2025 & 2033
- Figure 54: Asia Pacific Cap Liners Market Volume Share (%), by Product Type 2025 & 2033
- Figure 55: Asia Pacific Cap Liners Market Revenue (Million), by End-user Industry 2025 & 2033
- Figure 56: Asia Pacific Cap Liners Market Volume (Billion), by End-user Industry 2025 & 2033
- Figure 57: Asia Pacific Cap Liners Market Revenue Share (%), by End-user Industry 2025 & 2033
- Figure 58: Asia Pacific Cap Liners Market Volume Share (%), by End-user Industry 2025 & 2033
- Figure 59: Asia Pacific Cap Liners Market Revenue (Million), by Country 2025 & 2033
- Figure 60: Asia Pacific Cap Liners Market Volume (Billion), by Country 2025 & 2033
- Figure 61: Asia Pacific Cap Liners Market Revenue Share (%), by Country 2025 & 2033
- Figure 62: Asia Pacific Cap Liners Market Volume Share (%), by Country 2025 & 2033
- Figure 63: Latin America Cap Liners Market Revenue (Million), by Material Type 2025 & 2033
- Figure 64: Latin America Cap Liners Market Volume (Billion), by Material Type 2025 & 2033
- Figure 65: Latin America Cap Liners Market Revenue Share (%), by Material Type 2025 & 2033
- Figure 66: Latin America Cap Liners Market Volume Share (%), by Material Type 2025 & 2033
- Figure 67: Latin America Cap Liners Market Revenue (Million), by Application 2025 & 2033
- Figure 68: Latin America Cap Liners Market Volume (Billion), by Application 2025 & 2033
- Figure 69: Latin America Cap Liners Market Revenue Share (%), by Application 2025 & 2033
- Figure 70: Latin America Cap Liners Market Volume Share (%), by Application 2025 & 2033
- Figure 71: Latin America Cap Liners Market Revenue (Million), by Product Type 2025 & 2033
- Figure 72: Latin America Cap Liners Market Volume (Billion), by Product Type 2025 & 2033
- Figure 73: Latin America Cap Liners Market Revenue Share (%), by Product Type 2025 & 2033
- Figure 74: Latin America Cap Liners Market Volume Share (%), by Product Type 2025 & 2033
- Figure 75: Latin America Cap Liners Market Revenue (Million), by End-user Industry 2025 & 2033
- Figure 76: Latin America Cap Liners Market Volume (Billion), by End-user Industry 2025 & 2033
- Figure 77: Latin America Cap Liners Market Revenue Share (%), by End-user Industry 2025 & 2033
- Figure 78: Latin America Cap Liners Market Volume Share (%), by End-user Industry 2025 & 2033
- Figure 79: Latin America Cap Liners Market Revenue (Million), by Country 2025 & 2033
- Figure 80: Latin America Cap Liners Market Volume (Billion), by Country 2025 & 2033
- Figure 81: Latin America Cap Liners Market Revenue Share (%), by Country 2025 & 2033
- Figure 82: Latin America Cap Liners Market Volume Share (%), by Country 2025 & 2033
- Figure 83: Middle East and Africa Cap Liners Market Revenue (Million), by Material Type 2025 & 2033
- Figure 84: Middle East and Africa Cap Liners Market Volume (Billion), by Material Type 2025 & 2033
- Figure 85: Middle East and Africa Cap Liners Market Revenue Share (%), by Material Type 2025 & 2033
- Figure 86: Middle East and Africa Cap Liners Market Volume Share (%), by Material Type 2025 & 2033
- Figure 87: Middle East and Africa Cap Liners Market Revenue (Million), by Application 2025 & 2033
- Figure 88: Middle East and Africa Cap Liners Market Volume (Billion), by Application 2025 & 2033
- Figure 89: Middle East and Africa Cap Liners Market Revenue Share (%), by Application 2025 & 2033
- Figure 90: Middle East and Africa Cap Liners Market Volume Share (%), by Application 2025 & 2033
- Figure 91: Middle East and Africa Cap Liners Market Revenue (Million), by Product Type 2025 & 2033
- Figure 92: Middle East and Africa Cap Liners Market Volume (Billion), by Product Type 2025 & 2033
- Figure 93: Middle East and Africa Cap Liners Market Revenue Share (%), by Product Type 2025 & 2033
- Figure 94: Middle East and Africa Cap Liners Market Volume Share (%), by Product Type 2025 & 2033
- Figure 95: Middle East and Africa Cap Liners Market Revenue (Million), by End-user Industry 2025 & 2033
- Figure 96: Middle East and Africa Cap Liners Market Volume (Billion), by End-user Industry 2025 & 2033
- Figure 97: Middle East and Africa Cap Liners Market Revenue Share (%), by End-user Industry 2025 & 2033
- Figure 98: Middle East and Africa Cap Liners Market Volume Share (%), by End-user Industry 2025 & 2033
- Figure 99: Middle East and Africa Cap Liners Market Revenue (Million), by Country 2025 & 2033
- Figure 100: Middle East and Africa Cap Liners Market Volume (Billion), by Country 2025 & 2033
- Figure 101: Middle East and Africa Cap Liners Market Revenue Share (%), by Country 2025 & 2033
- Figure 102: Middle East and Africa Cap Liners Market Volume Share (%), by Country 2025 & 2033
List of Tables
- Table 1: Global Cap Liners Market Revenue Million Forecast, by Material Type 2020 & 2033
- Table 2: Global Cap Liners Market Volume Billion Forecast, by Material Type 2020 & 2033
- Table 3: Global Cap Liners Market Revenue Million Forecast, by Application 2020 & 2033
- Table 4: Global Cap Liners Market Volume Billion Forecast, by Application 2020 & 2033
- Table 5: Global Cap Liners Market Revenue Million Forecast, by Product Type 2020 & 2033
- Table 6: Global Cap Liners Market Volume Billion Forecast, by Product Type 2020 & 2033
- Table 7: Global Cap Liners Market Revenue Million Forecast, by End-user Industry 2020 & 2033
- Table 8: Global Cap Liners Market Volume Billion Forecast, by End-user Industry 2020 & 2033
- Table 9: Global Cap Liners Market Revenue Million Forecast, by Region 2020 & 2033
- Table 10: Global Cap Liners Market Volume Billion Forecast, by Region 2020 & 2033
- Table 11: Global Cap Liners Market Revenue Million Forecast, by Material Type 2020 & 2033
- Table 12: Global Cap Liners Market Volume Billion Forecast, by Material Type 2020 & 2033
- Table 13: Global Cap Liners Market Revenue Million Forecast, by Application 2020 & 2033
- Table 14: Global Cap Liners Market Volume Billion Forecast, by Application 2020 & 2033
- Table 15: Global Cap Liners Market Revenue Million Forecast, by Product Type 2020 & 2033
- Table 16: Global Cap Liners Market Volume Billion Forecast, by Product Type 2020 & 2033
- Table 17: Global Cap Liners Market Revenue Million Forecast, by End-user Industry 2020 & 2033
- Table 18: Global Cap Liners Market Volume Billion Forecast, by End-user Industry 2020 & 2033
- Table 19: Global Cap Liners Market Revenue Million Forecast, by Country 2020 & 2033
- Table 20: Global Cap Liners Market Volume Billion Forecast, by Country 2020 & 2033
- Table 21: United States Cap Liners Market Revenue (Million) Forecast, by Application 2020 & 2033
- Table 22: United States Cap Liners Market Volume (Billion) Forecast, by Application 2020 & 2033
- Table 23: Canada Cap Liners Market Revenue (Million) Forecast, by Application 2020 & 2033
- Table 24: Canada Cap Liners Market Volume (Billion) Forecast, by Application 2020 & 2033
- Table 25: Global Cap Liners Market Revenue Million Forecast, by Material Type 2020 & 2033
- Table 26: Global Cap Liners Market Volume Billion Forecast, by Material Type 2020 & 2033
- Table 27: Global Cap Liners Market Revenue Million Forecast, by Application 2020 & 2033
- Table 28: Global Cap Liners Market Volume Billion Forecast, by Application 2020 & 2033
- Table 29: Global Cap Liners Market Revenue Million Forecast, by Product Type 2020 & 2033
- Table 30: Global Cap Liners Market Volume Billion Forecast, by Product Type 2020 & 2033
- Table 31: Global Cap Liners Market Revenue Million Forecast, by End-user Industry 2020 & 2033
- Table 32: Global Cap Liners Market Volume Billion Forecast, by End-user Industry 2020 & 2033
- Table 33: Global Cap Liners Market Revenue Million Forecast, by Country 2020 & 2033
- Table 34: Global Cap Liners Market Volume Billion Forecast, by Country 2020 & 2033
- Table 35: France Cap Liners Market Revenue (Million) Forecast, by Application 2020 & 2033
- Table 36: France Cap Liners Market Volume (Billion) Forecast, by Application 2020 & 2033
- Table 37: Germany Cap Liners Market Revenue (Million) Forecast, by Application 2020 & 2033
- Table 38: Germany Cap Liners Market Volume (Billion) Forecast, by Application 2020 & 2033
- Table 39: Spain Cap Liners Market Revenue (Million) Forecast, by Application 2020 & 2033
- Table 40: Spain Cap Liners Market Volume (Billion) Forecast, by Application 2020 & 2033
- Table 41: United Kingdom Cap Liners Market Revenue (Million) Forecast, by Application 2020 & 2033
- Table 42: United Kingdom Cap Liners Market Volume (Billion) Forecast, by Application 2020 & 2033
- Table 43: Turkey Cap Liners Market Revenue (Million) Forecast, by Application 2020 & 2033
- Table 44: Turkey Cap Liners Market Volume (Billion) Forecast, by Application 2020 & 2033
- Table 45: Global Cap Liners Market Revenue Million Forecast, by Material Type 2020 & 2033
- Table 46: Global Cap Liners Market Volume Billion Forecast, by Material Type 2020 & 2033
- Table 47: Global Cap Liners Market Revenue Million Forecast, by Application 2020 & 2033
- Table 48: Global Cap Liners Market Volume Billion Forecast, by Application 2020 & 2033
- Table 49: Global Cap Liners Market Revenue Million Forecast, by Product Type 2020 & 2033
- Table 50: Global Cap Liners Market Volume Billion Forecast, by Product Type 2020 & 2033
- Table 51: Global Cap Liners Market Revenue Million Forecast, by End-user Industry 2020 & 2033
- Table 52: Global Cap Liners Market Volume Billion Forecast, by End-user Industry 2020 & 2033
- Table 53: Global Cap Liners Market Revenue Million Forecast, by Country 2020 & 2033
- Table 54: Global Cap Liners Market Volume Billion Forecast, by Country 2020 & 2033
- Table 55: China Cap Liners Market Revenue (Million) Forecast, by Application 2020 & 2033
- Table 56: China Cap Liners Market Volume (Billion) Forecast, by Application 2020 & 2033
- Table 57: India Cap Liners Market Revenue (Million) Forecast, by Application 2020 & 2033
- Table 58: India Cap Liners Market Volume (Billion) Forecast, by Application 2020 & 2033
- Table 59: Japan Cap Liners Market Revenue (Million) Forecast, by Application 2020 & 2033
- Table 60: Japan Cap Liners Market Volume (Billion) Forecast, by Application 2020 & 2033
- Table 61: Thailand Cap Liners Market Revenue (Million) Forecast, by Application 2020 & 2033
- Table 62: Thailand Cap Liners Market Volume (Billion) Forecast, by Application 2020 & 2033
- Table 63: Australia and New Zealand Cap Liners Market Revenue (Million) Forecast, by Application 2020 & 2033
- Table 64: Australia and New Zealand Cap Liners Market Volume (Billion) Forecast, by Application 2020 & 2033
- Table 65: Global Cap Liners Market Revenue Million Forecast, by Material Type 2020 & 2033
- Table 66: Global Cap Liners Market Volume Billion Forecast, by Material Type 2020 & 2033
- Table 67: Global Cap Liners Market Revenue Million Forecast, by Application 2020 & 2033
- Table 68: Global Cap Liners Market Volume Billion Forecast, by Application 2020 & 2033
- Table 69: Global Cap Liners Market Revenue Million Forecast, by Product Type 2020 & 2033
- Table 70: Global Cap Liners Market Volume Billion Forecast, by Product Type 2020 & 2033
- Table 71: Global Cap Liners Market Revenue Million Forecast, by End-user Industry 2020 & 2033
- Table 72: Global Cap Liners Market Volume Billion Forecast, by End-user Industry 2020 & 2033
- Table 73: Global Cap Liners Market Revenue Million Forecast, by Country 2020 & 2033
- Table 74: Global Cap Liners Market Volume Billion Forecast, by Country 2020 & 2033
- Table 75: Brazil Cap Liners Market Revenue (Million) Forecast, by Application 2020 & 2033
- Table 76: Brazil Cap Liners Market Volume (Billion) Forecast, by Application 2020 & 2033
- Table 77: Mexico Cap Liners Market Revenue (Million) Forecast, by Application 2020 & 2033
- Table 78: Mexico Cap Liners Market Volume (Billion) Forecast, by Application 2020 & 2033
- Table 79: Global Cap Liners Market Revenue Million Forecast, by Material Type 2020 & 2033
- Table 80: Global Cap Liners Market Volume Billion Forecast, by Material Type 2020 & 2033
- Table 81: Global Cap Liners Market Revenue Million Forecast, by Application 2020 & 2033
- Table 82: Global Cap Liners Market Volume Billion Forecast, by Application 2020 & 2033
- Table 83: Global Cap Liners Market Revenue Million Forecast, by Product Type 2020 & 2033
- Table 84: Global Cap Liners Market Volume Billion Forecast, by Product Type 2020 & 2033
- Table 85: Global Cap Liners Market Revenue Million Forecast, by End-user Industry 2020 & 2033
- Table 86: Global Cap Liners Market Volume Billion Forecast, by End-user Industry 2020 & 2033
- Table 87: Global Cap Liners Market Revenue Million Forecast, by Country 2020 & 2033
- Table 88: Global Cap Liners Market Volume Billion Forecast, by Country 2020 & 2033
- Table 89: United Arab Emirates Cap Liners Market Revenue (Million) Forecast, by Application 2020 & 2033
- Table 90: United Arab Emirates Cap Liners Market Volume (Billion) Forecast, by Application 2020 & 2033
- Table 91: Saudi Arabia Cap Liners Market Revenue (Million) Forecast, by Application 2020 & 2033
- Table 92: Saudi Arabia Cap Liners Market Volume (Billion) Forecast, by Application 2020 & 2033
- Table 93: Egypt Cap Liners Market Revenue (Million) Forecast, by Application 2020 & 2033
- Table 94: Egypt Cap Liners Market Volume (Billion) Forecast, by Application 2020 & 2033
- Table 95: South Africa Cap Liners Market Revenue (Million) Forecast, by Application 2020 & 2033
- Table 96: South Africa Cap Liners Market Volume (Billion) Forecast, by Application 2020 & 2033
Frequently Asked Questions
1. What is the projected Compound Annual Growth Rate (CAGR) of the Cap Liners Market?
The projected CAGR is approximately 3.43%.
2. Which companies are prominent players in the Cap Liners Market?
Key companies in the market include Meyer Seals GmbH, Tekni-Plex Inc, Bluemay Weston Limited, Press-On Corporation, B&B Cap Liners LLC, Low's Cap Seal Sdn Bhd, Tien Lik Cap Seal Sdn Bhd, Captel International Pvt Ltd, The Cary Company, Selig UK Limited, M F I Capliners*List Not Exhaustive.
3. What are the main segments of the Cap Liners Market?
The market segments include Material Type, Application, Product Type, End-user Industry.
4. Can you provide details about the market size?
The market size is estimated to be USD 3.54 Million as of 2022.
5. What are some drivers contributing to market growth?
Safe and Secure Handling. Storage. and Transport of Products; Increased Demand from the Pharmaceutical Industry.
6. What are the notable trends driving market growth?
Increased Use of Cap Liners in the Pharmaceutical Industry.
7. Are there any restraints impacting market growth?
Safe and Secure Handling. Storage. and Transport of Products; Increased Demand from the Pharmaceutical Industry.
8. Can you provide examples of recent developments in the market?
August 2024: Two new 3FL (Full Face Foam Liner) cap liners from W. L. Gore & Associates are engineered to maintain the structural integrity of containers of chemicals for agricultural and household uses. The 3FL-363 and 3FL-373 cap liners, the latest addition to Gore’s extensive portfolio, provide excellent breathability and are resistant to many of today’s most aggressive chemicals—toilet cleaners, stain lifters, pipe clog removers, and organic fertilizers—without necessitating any changes in formulation. This enables OEMs to get their products to market faster and possibly develop even more effective formulations.January 2024: TekniPlex launched a new series of recyclable, paper-based induction heat seal liners designed to seal dry pharma, nutrition, and food products in bottles and jars with protective properties identical to conventional solutions. The ProTecSeals Recyclable IHS Liners are made of recyclable paper from tree pulp. They offer moisture and oxygen barrier properties, resist leaks, prevent contamination, and prolong shelf life to the same standard as traditional IHS liners.
9. What pricing options are available for accessing the report?
Pricing options include single-user, multi-user, and enterprise licenses priced at USD 4750, USD 5250, and USD 8750 respectively.
10. Is the market size provided in terms of value or volume?
The market size is provided in terms of value, measured in Million and volume, measured in Billion.
11. Are there any specific market keywords associated with the report?
Yes, the market keyword associated with the report is "Cap Liners Market," which aids in identifying and referencing the specific market segment covered.
12. How do I determine which pricing option suits my needs best?
The pricing options vary based on user requirements and access needs. Individual users may opt for single-user licenses, while businesses requiring broader access may choose multi-user or enterprise licenses for cost-effective access to the report.
13. Are there any additional resources or data provided in the Cap Liners Market report?
While the report offers comprehensive insights, it's advisable to review the specific contents or supplementary materials provided to ascertain if additional resources or data are available.
14. How can I stay updated on further developments or reports in the Cap Liners Market?
To stay informed about further developments, trends, and reports in the Cap Liners Market, consider subscribing to industry newsletters, following relevant companies and organizations, or regularly checking reputable industry news sources and publications.
Methodology
Step 1 - Identification of Relevant Samples Size from Population Database


Step 2 - Approaches for Defining Global Market Size (Value, Volume* & Price*)

Note*: In applicable scenarios
Step 3 - Data Sources
Primary Research
- Web Analytics
- Survey Reports
- Research Institute
- Latest Research Reports
- Opinion Leaders
Secondary Research
- Annual Reports
- White Paper
- Latest Press Release
- Industry Association
- Paid Database
- Investor Presentations

Step 4 - Data Triangulation
Involves using different sources of information in order to increase the validity of a study
These sources are likely to be stakeholders in a program - participants, other researchers, program staff, other community members, and so on.
Then we put all data in single framework & apply various statistical tools to find out the dynamic on the market.
During the analysis stage, feedback from the stakeholder groups would be compared to determine areas of agreement as well as areas of divergence