
Key Insights
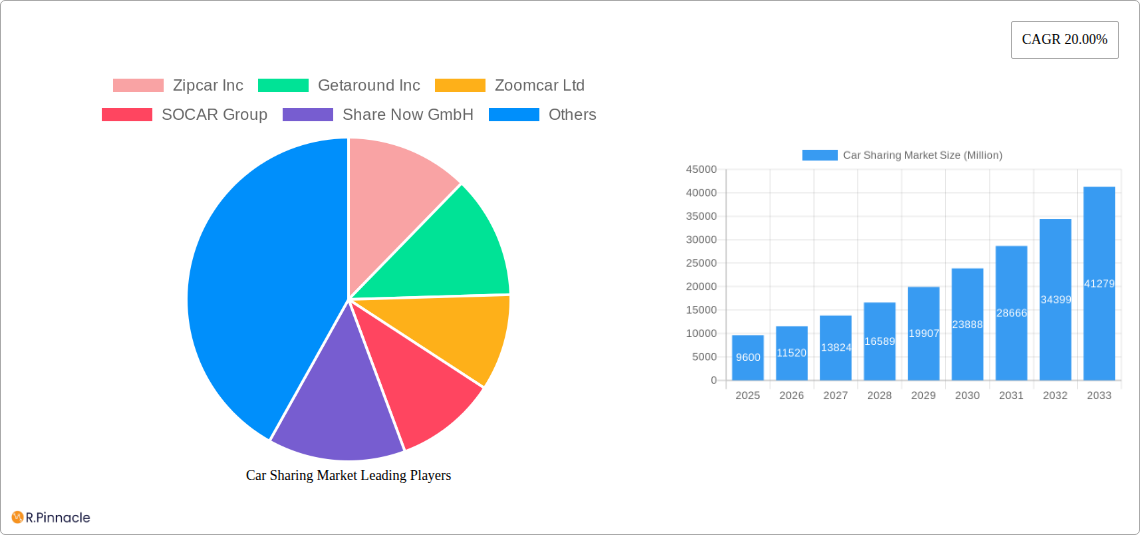
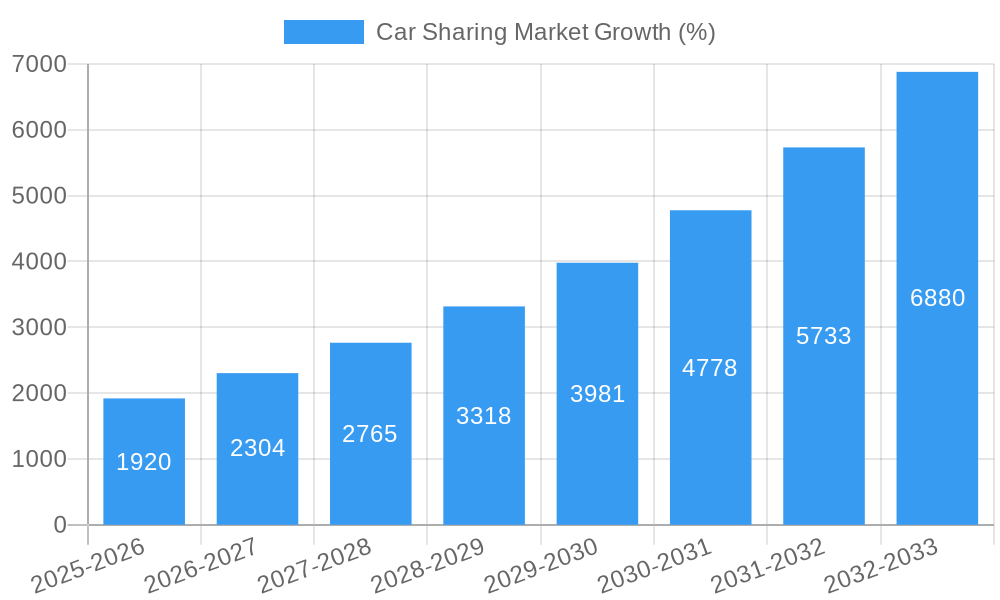
The car-sharing market, valued at $9.6 billion in 2025, is experiencing robust growth, projected to expand at a compound annual growth rate (CAGR) of 20% from 2025 to 2033. This surge is driven by several key factors. Increasing urbanization and traffic congestion in major cities are prompting consumers to seek alternative transportation solutions, making car-sharing a convenient and cost-effective option. Furthermore, the rising awareness of environmental sustainability and the desire to reduce carbon footprints are contributing to the market's expansion. Technological advancements, such as improved mobile applications for booking and managing rentals, enhanced vehicle tracking and security features, and the integration of electric vehicles into car-sharing fleets, are further fueling growth. The convenience of on-demand access to vehicles, coupled with flexible rental options and lower overall costs compared to traditional car ownership, is attracting a broader range of users. This includes both individuals seeking occasional transportation and businesses utilizing car-sharing for employee mobility programs.
However, the market faces certain challenges. Regulatory hurdles in different regions, including licensing requirements and parking limitations, can create barriers to entry and expansion. Insurance complexities and liability issues related to shared vehicle usage also require careful consideration. Competition among established players and new entrants is intensifying, leading to price wars and the need for continuous innovation to maintain market share. Fluctuations in fuel prices and the overall economic climate can impact consumer spending on car-sharing services. Nevertheless, the long-term growth trajectory remains positive, underpinned by the enduring appeal of car-sharing as a sustainable and practical transportation alternative. Companies like Zipcar, Getaround, and Turo are strategically positioned to capitalize on this growth, while newcomers continuously innovate and compete for market dominance.
Car Sharing Market Report: 2019-2033 Forecast
This comprehensive report provides an in-depth analysis of the global car sharing market, covering the period 2019-2033. It offers actionable insights for industry professionals, investors, and strategists seeking to understand market dynamics, key players, and future growth opportunities. The report leverages extensive data and analysis to provide a clear picture of the current market landscape and future projections. The total market size is estimated at xx Million in 2025, with a projected CAGR of xx% during the forecast period (2025-2033).
Car Sharing Market Market Structure & Innovation Trends
This section analyzes the competitive landscape, innovation drivers, and regulatory influences shaping the car sharing market. The market is characterized by a mix of established players and emerging disruptors, with varying market share. Key players include Zipcar Inc, Getaround Inc, Zoomcar Ltd, SOCAR Group, Share Now GmbH, Grab Holdings Limited, Turo Inc, Scoop Technologies Inc, BlaBlaCar (Comuto SA), Enterprise Holdings Inc, and Enilive S p A (Enjoy Car Sharing).
Market Concentration: The market exhibits a moderately concentrated structure, with the top 5 players holding an estimated xx% market share in 2025. However, the presence of numerous smaller players indicates significant competition.
Innovation Drivers: Technological advancements, such as the integration of autonomous driving technologies and the development of sophisticated mobile applications, are key innovation drivers. Furthermore, evolving consumer preferences towards shared mobility and sustainability are shaping innovation within the sector.
Regulatory Frameworks: Varying regulatory frameworks across different regions significantly impact market growth and operational models. Differing regulations related to licensing, insurance, and vehicle standards create complexities for operators.
Product Substitutes: Traditional car ownership, ride-hailing services (like Uber and Lyft), and public transportation systems represent key substitutes to car-sharing services.
End-User Demographics: The target demographic for car-sharing services is primarily young, urban professionals and tourists seeking flexible and cost-effective transportation solutions. However, the market is expanding to encompass a wider range of demographics.
M&A Activities: The car-sharing market has witnessed several mergers and acquisitions in recent years. The total value of M&A deals within the sector reached approximately xx Million in 2024, indicating a high level of consolidation and strategic investment. Examples include the Zoomcar and CARS24 alliance.
Car Sharing Market Market Dynamics & Trends
The car sharing market is experiencing rapid growth, driven by several factors. Technological advancements, including the integration of smart technologies, improved user interfaces, and autonomous driving capabilities, are enhancing the user experience and operational efficiency. Changing consumer preferences towards on-demand services and the rising adoption of shared mobility solutions contribute significantly to market expansion. Furthermore, supportive government policies in several regions are creating a favorable environment for growth.
The market is experiencing disruption from companies offering innovative solutions and business models. The entry of new players and strategic partnerships are driving competition, leading to improved service offerings, pricing strategies, and market penetration. The compound annual growth rate (CAGR) for the car sharing market is estimated at xx% during the forecast period (2025-2033), reflecting the dynamic nature of the sector and its ongoing evolution. The market penetration rate is projected to reach xx% by 2033.
Dominant Regions & Segments in Car Sharing Market
North America currently holds the dominant position in the global car sharing market, driven by high levels of technological advancement, robust infrastructure, and high consumer adoption. Several key factors contribute to this dominance:
Economic Policies: Supportive government policies that encourage sustainable transportation options and investment in shared mobility infrastructure.
Technological Infrastructure: Well-developed telecommunications infrastructure supporting the functionality of mobile applications and connected car technologies.
Consumer Preferences: A high preference among consumers for convenient and cost-effective transportation solutions.
High Urban Density: A concentration of population in major cities facilitates the efficient operation of car-sharing services.
While North America holds the lead, Europe and Asia-Pacific are also experiencing strong growth, propelled by increasing urbanization, rising disposable incomes, and growing environmental consciousness.
Car Sharing Market Product Innovations
Recent product innovations focus on enhancing user experience, improving operational efficiency, and expanding service offerings. This includes features like advanced mobile applications with integrated payment systems and real-time vehicle tracking, as well as expansion into new vehicle types (e.g., electric vehicles, vans). The integration of autonomous driving technology promises to revolutionize the car-sharing landscape by enabling driverless operations and improving safety. These innovations are tailored to meet evolving consumer needs and enhance the competitive advantage of service providers.
Report Scope & Segmentation Analysis
This report segments the car sharing market based on vehicle type (e.g., compact cars, SUVs, luxury vehicles), service model (e.g., free-floating, station-based), and geographic region. Growth projections for each segment vary based on the underlying market dynamics. The competitive landscape within each segment differs, with certain players specializing in specific niches or geographic areas. Detailed market size estimates and competitive analyses are provided for each segment in the main report.
Key Drivers of Car Sharing Market Growth
Several key factors are driving the growth of the car sharing market:
Technological advancements: The development of sophisticated mobile apps, integration of IoT (Internet of Things) devices, and potential for autonomous driving technology greatly enhance the user experience and operational efficiency.
Economic factors: Rising urban populations, increasing disposable incomes, and high transportation costs drive demand for affordable transportation alternatives.
Regulatory support: Government initiatives promoting sustainable transportation and shared mobility create a favorable environment for market expansion.
Challenges in the Car Sharing Market Sector
The car sharing market faces several challenges:
Regulatory hurdles: Varying regulations across different regions create complexities for operators and can limit market expansion.
Supply chain issues: Maintaining adequate vehicle fleets and ensuring timely maintenance can be challenging, particularly during periods of high demand.
Competition: Intense competition from established players and new entrants requires continuous innovation and cost optimization to remain competitive.
Emerging Opportunities in Car Sharing Market
Several emerging trends present significant opportunities for growth in the car sharing market:
Expansion into new markets: Untapped potential exists in developing countries and regions with increasing urbanization and growing demand for transportation solutions.
New technologies: The integration of autonomous driving and electrification presents opportunities to enhance operational efficiency and reduce environmental impact.
Subscription models: Innovative subscription-based services could provide consumers with greater flexibility and value.
Leading Players in the Car Sharing Market Market
- Zipcar Inc
- Getaround Inc
- Zoomcar Ltd
- SOCAR Group
- Share Now GmbH
- Grab Holdings Limited
- Turo Inc
- Scoop Technologies Inc
- BlaBlaCar (Comuto SA)
- Enterprise Holdings Inc
- Enilive S p A (Enjoy Car Sharing)
Key Developments in Car Sharing Market Industry
March 2024: Waymo launched its free Waymo One ride-hailing service in Los Angeles, showcasing the potential of autonomous driving in car sharing.
February 2024: Zoomcar partnered with CARS24 to support car-sharing hosts in expanding their fleets and increasing earnings, boosting the overall market capacity.
Future Outlook for Car Sharing Market Market
The future of the car sharing market is bright, with several factors expected to accelerate its growth. Technological innovations, such as autonomous vehicles and electric vehicle integration, will transform the industry. Expansion into new markets and the development of innovative business models will also contribute to market expansion. The increasing focus on sustainability and the growing demand for shared mobility services will further propel market growth in the coming years.
Car Sharing Market Segmentation
-
1. Booking Type
- 1.1. Online Booking
- 1.2. Offline Booking
-
2. Application Type
- 2.1. Business/Corporate
- 2.2. Leisure
-
3. Vehicle Type
- 3.1. Hatchback
- 3.2. Sedan
- 3.3. Sports Utility Vehicles
- 3.4. Multi-Purpose Vehicles
-
4. Type
- 4.1. Peer-To-Peer
- 4.2. Free Floating
-
5. Trip Type
- 5.1. One-Way
- 5.2. Round Trip
Car Sharing Market Segmentation By Geography
-
1. North America
- 1.1. United States
- 1.2. Canada
- 1.3. Rest of North America
-
2. Europe
- 2.1. Germany
- 2.2. United Kingdom
- 2.3. France
- 2.4. Italy
- 2.5. Spain
- 2.6. Rest of Europe
-
3. Asia Pacific
- 3.1. China
- 3.2. India
- 3.3. Japan
- 3.4. South Korea
- 3.5. Rest of Asia Pacific
-
4. Rest of the World
- 4.1. South America
- 4.2. Middle East and Africa

Car Sharing Market REPORT HIGHLIGHTS
| Aspects | Details |
|---|---|
| Study Period | 2019-2033 |
| Base Year | 2024 |
| Estimated Year | 2025 |
| Forecast Period | 2025-2033 |
| Historical Period | 2019-2024 |
| Growth Rate | CAGR of 20.00% from 2019-2033 |
| Segmentation |
|
Table of Contents
- 1. Introduction
- 1.1. Research Scope
- 1.2. Market Segmentation
- 1.3. Research Methodology
- 1.4. Definitions and Assumptions
- 2. Executive Summary
- 2.1. Introduction
- 3. Market Dynamics
- 3.1. Introduction
- 3.2. Market Drivers
- 3.2.1. The Rise in Consumer Trend Toward Shared Mobility
- 3.3. Market Restrains
- 3.3.1. The Rise in Consumer Trend Toward Shared Mobility
- 3.4. Market Trends
- 3.4.1. Online Booking Hold Major Market Share
- 4. Market Factor Analysis
- 4.1. Porters Five Forces
- 4.2. Supply/Value Chain
- 4.3. PESTEL analysis
- 4.4. Market Entropy
- 4.5. Patent/Trademark Analysis
- 5. Global Car Sharing Market Analysis, Insights and Forecast, 2019-2031
- 5.1. Market Analysis, Insights and Forecast - by Booking Type
- 5.1.1. Online Booking
- 5.1.2. Offline Booking
- 5.2. Market Analysis, Insights and Forecast - by Application Type
- 5.2.1. Business/Corporate
- 5.2.2. Leisure
- 5.3. Market Analysis, Insights and Forecast - by Vehicle Type
- 5.3.1. Hatchback
- 5.3.2. Sedan
- 5.3.3. Sports Utility Vehicles
- 5.3.4. Multi-Purpose Vehicles
- 5.4. Market Analysis, Insights and Forecast - by Type
- 5.4.1. Peer-To-Peer
- 5.4.2. Free Floating
- 5.5. Market Analysis, Insights and Forecast - by Trip Type
- 5.5.1. One-Way
- 5.5.2. Round Trip
- 5.6. Market Analysis, Insights and Forecast - by Region
- 5.6.1. North America
- 5.6.2. Europe
- 5.6.3. Asia Pacific
- 5.6.4. Rest of the World
- 5.1. Market Analysis, Insights and Forecast - by Booking Type
- 6. North America Car Sharing Market Analysis, Insights and Forecast, 2019-2031
- 6.1. Market Analysis, Insights and Forecast - by Booking Type
- 6.1.1. Online Booking
- 6.1.2. Offline Booking
- 6.2. Market Analysis, Insights and Forecast - by Application Type
- 6.2.1. Business/Corporate
- 6.2.2. Leisure
- 6.3. Market Analysis, Insights and Forecast - by Vehicle Type
- 6.3.1. Hatchback
- 6.3.2. Sedan
- 6.3.3. Sports Utility Vehicles
- 6.3.4. Multi-Purpose Vehicles
- 6.4. Market Analysis, Insights and Forecast - by Type
- 6.4.1. Peer-To-Peer
- 6.4.2. Free Floating
- 6.5. Market Analysis, Insights and Forecast - by Trip Type
- 6.5.1. One-Way
- 6.5.2. Round Trip
- 6.1. Market Analysis, Insights and Forecast - by Booking Type
- 7. Europe Car Sharing Market Analysis, Insights and Forecast, 2019-2031
- 7.1. Market Analysis, Insights and Forecast - by Booking Type
- 7.1.1. Online Booking
- 7.1.2. Offline Booking
- 7.2. Market Analysis, Insights and Forecast - by Application Type
- 7.2.1. Business/Corporate
- 7.2.2. Leisure
- 7.3. Market Analysis, Insights and Forecast - by Vehicle Type
- 7.3.1. Hatchback
- 7.3.2. Sedan
- 7.3.3. Sports Utility Vehicles
- 7.3.4. Multi-Purpose Vehicles
- 7.4. Market Analysis, Insights and Forecast - by Type
- 7.4.1. Peer-To-Peer
- 7.4.2. Free Floating
- 7.5. Market Analysis, Insights and Forecast - by Trip Type
- 7.5.1. One-Way
- 7.5.2. Round Trip
- 7.1. Market Analysis, Insights and Forecast - by Booking Type
- 8. Asia Pacific Car Sharing Market Analysis, Insights and Forecast, 2019-2031
- 8.1. Market Analysis, Insights and Forecast - by Booking Type
- 8.1.1. Online Booking
- 8.1.2. Offline Booking
- 8.2. Market Analysis, Insights and Forecast - by Application Type
- 8.2.1. Business/Corporate
- 8.2.2. Leisure
- 8.3. Market Analysis, Insights and Forecast - by Vehicle Type
- 8.3.1. Hatchback
- 8.3.2. Sedan
- 8.3.3. Sports Utility Vehicles
- 8.3.4. Multi-Purpose Vehicles
- 8.4. Market Analysis, Insights and Forecast - by Type
- 8.4.1. Peer-To-Peer
- 8.4.2. Free Floating
- 8.5. Market Analysis, Insights and Forecast - by Trip Type
- 8.5.1. One-Way
- 8.5.2. Round Trip
- 8.1. Market Analysis, Insights and Forecast - by Booking Type
- 9. Rest of the World Car Sharing Market Analysis, Insights and Forecast, 2019-2031
- 9.1. Market Analysis, Insights and Forecast - by Booking Type
- 9.1.1. Online Booking
- 9.1.2. Offline Booking
- 9.2. Market Analysis, Insights and Forecast - by Application Type
- 9.2.1. Business/Corporate
- 9.2.2. Leisure
- 9.3. Market Analysis, Insights and Forecast - by Vehicle Type
- 9.3.1. Hatchback
- 9.3.2. Sedan
- 9.3.3. Sports Utility Vehicles
- 9.3.4. Multi-Purpose Vehicles
- 9.4. Market Analysis, Insights and Forecast - by Type
- 9.4.1. Peer-To-Peer
- 9.4.2. Free Floating
- 9.5. Market Analysis, Insights and Forecast - by Trip Type
- 9.5.1. One-Way
- 9.5.2. Round Trip
- 9.1. Market Analysis, Insights and Forecast - by Booking Type
- 10. Competitive Analysis
- 10.1. Global Market Share Analysis 2024
- 10.2. Company Profiles
- 10.2.1 Zipcar Inc
- 10.2.1.1. Overview
- 10.2.1.2. Products
- 10.2.1.3. SWOT Analysis
- 10.2.1.4. Recent Developments
- 10.2.1.5. Financials (Based on Availability)
- 10.2.2 Getaround Inc
- 10.2.2.1. Overview
- 10.2.2.2. Products
- 10.2.2.3. SWOT Analysis
- 10.2.2.4. Recent Developments
- 10.2.2.5. Financials (Based on Availability)
- 10.2.3 Zoomcar Ltd
- 10.2.3.1. Overview
- 10.2.3.2. Products
- 10.2.3.3. SWOT Analysis
- 10.2.3.4. Recent Developments
- 10.2.3.5. Financials (Based on Availability)
- 10.2.4 SOCAR Group
- 10.2.4.1. Overview
- 10.2.4.2. Products
- 10.2.4.3. SWOT Analysis
- 10.2.4.4. Recent Developments
- 10.2.4.5. Financials (Based on Availability)
- 10.2.5 Share Now GmbH
- 10.2.5.1. Overview
- 10.2.5.2. Products
- 10.2.5.3. SWOT Analysis
- 10.2.5.4. Recent Developments
- 10.2.5.5. Financials (Based on Availability)
- 10.2.6 Grab Holdings Limited
- 10.2.6.1. Overview
- 10.2.6.2. Products
- 10.2.6.3. SWOT Analysis
- 10.2.6.4. Recent Developments
- 10.2.6.5. Financials (Based on Availability)
- 10.2.7 Turo Inc
- 10.2.7.1. Overview
- 10.2.7.2. Products
- 10.2.7.3. SWOT Analysis
- 10.2.7.4. Recent Developments
- 10.2.7.5. Financials (Based on Availability)
- 10.2.8 Scoop Technologies Inc
- 10.2.8.1. Overview
- 10.2.8.2. Products
- 10.2.8.3. SWOT Analysis
- 10.2.8.4. Recent Developments
- 10.2.8.5. Financials (Based on Availability)
- 10.2.9 BlaBlaCar (Comuto SA)
- 10.2.9.1. Overview
- 10.2.9.2. Products
- 10.2.9.3. SWOT Analysis
- 10.2.9.4. Recent Developments
- 10.2.9.5. Financials (Based on Availability)
- 10.2.10 Enterprise Holdings Inc
- 10.2.10.1. Overview
- 10.2.10.2. Products
- 10.2.10.3. SWOT Analysis
- 10.2.10.4. Recent Developments
- 10.2.10.5. Financials (Based on Availability)
- 10.2.11 Enilive S p A (Enjoy Car Sharing
- 10.2.11.1. Overview
- 10.2.11.2. Products
- 10.2.11.3. SWOT Analysis
- 10.2.11.4. Recent Developments
- 10.2.11.5. Financials (Based on Availability)
- 10.2.1 Zipcar Inc
List of Figures
- Figure 1: Global Car Sharing Market Revenue Breakdown (Million, %) by Region 2024 & 2032
- Figure 2: Global Car Sharing Market Volume Breakdown (Billion, %) by Region 2024 & 2032
- Figure 3: North America Car Sharing Market Revenue (Million), by Booking Type 2024 & 2032
- Figure 4: North America Car Sharing Market Volume (Billion), by Booking Type 2024 & 2032
- Figure 5: North America Car Sharing Market Revenue Share (%), by Booking Type 2024 & 2032
- Figure 6: North America Car Sharing Market Volume Share (%), by Booking Type 2024 & 2032
- Figure 7: North America Car Sharing Market Revenue (Million), by Application Type 2024 & 2032
- Figure 8: North America Car Sharing Market Volume (Billion), by Application Type 2024 & 2032
- Figure 9: North America Car Sharing Market Revenue Share (%), by Application Type 2024 & 2032
- Figure 10: North America Car Sharing Market Volume Share (%), by Application Type 2024 & 2032
- Figure 11: North America Car Sharing Market Revenue (Million), by Vehicle Type 2024 & 2032
- Figure 12: North America Car Sharing Market Volume (Billion), by Vehicle Type 2024 & 2032
- Figure 13: North America Car Sharing Market Revenue Share (%), by Vehicle Type 2024 & 2032
- Figure 14: North America Car Sharing Market Volume Share (%), by Vehicle Type 2024 & 2032
- Figure 15: North America Car Sharing Market Revenue (Million), by Type 2024 & 2032
- Figure 16: North America Car Sharing Market Volume (Billion), by Type 2024 & 2032
- Figure 17: North America Car Sharing Market Revenue Share (%), by Type 2024 & 2032
- Figure 18: North America Car Sharing Market Volume Share (%), by Type 2024 & 2032
- Figure 19: North America Car Sharing Market Revenue (Million), by Trip Type 2024 & 2032
- Figure 20: North America Car Sharing Market Volume (Billion), by Trip Type 2024 & 2032
- Figure 21: North America Car Sharing Market Revenue Share (%), by Trip Type 2024 & 2032
- Figure 22: North America Car Sharing Market Volume Share (%), by Trip Type 2024 & 2032
- Figure 23: North America Car Sharing Market Revenue (Million), by Country 2024 & 2032
- Figure 24: North America Car Sharing Market Volume (Billion), by Country 2024 & 2032
- Figure 25: North America Car Sharing Market Revenue Share (%), by Country 2024 & 2032
- Figure 26: North America Car Sharing Market Volume Share (%), by Country 2024 & 2032
- Figure 27: Europe Car Sharing Market Revenue (Million), by Booking Type 2024 & 2032
- Figure 28: Europe Car Sharing Market Volume (Billion), by Booking Type 2024 & 2032
- Figure 29: Europe Car Sharing Market Revenue Share (%), by Booking Type 2024 & 2032
- Figure 30: Europe Car Sharing Market Volume Share (%), by Booking Type 2024 & 2032
- Figure 31: Europe Car Sharing Market Revenue (Million), by Application Type 2024 & 2032
- Figure 32: Europe Car Sharing Market Volume (Billion), by Application Type 2024 & 2032
- Figure 33: Europe Car Sharing Market Revenue Share (%), by Application Type 2024 & 2032
- Figure 34: Europe Car Sharing Market Volume Share (%), by Application Type 2024 & 2032
- Figure 35: Europe Car Sharing Market Revenue (Million), by Vehicle Type 2024 & 2032
- Figure 36: Europe Car Sharing Market Volume (Billion), by Vehicle Type 2024 & 2032
- Figure 37: Europe Car Sharing Market Revenue Share (%), by Vehicle Type 2024 & 2032
- Figure 38: Europe Car Sharing Market Volume Share (%), by Vehicle Type 2024 & 2032
- Figure 39: Europe Car Sharing Market Revenue (Million), by Type 2024 & 2032
- Figure 40: Europe Car Sharing Market Volume (Billion), by Type 2024 & 2032
- Figure 41: Europe Car Sharing Market Revenue Share (%), by Type 2024 & 2032
- Figure 42: Europe Car Sharing Market Volume Share (%), by Type 2024 & 2032
- Figure 43: Europe Car Sharing Market Revenue (Million), by Trip Type 2024 & 2032
- Figure 44: Europe Car Sharing Market Volume (Billion), by Trip Type 2024 & 2032
- Figure 45: Europe Car Sharing Market Revenue Share (%), by Trip Type 2024 & 2032
- Figure 46: Europe Car Sharing Market Volume Share (%), by Trip Type 2024 & 2032
- Figure 47: Europe Car Sharing Market Revenue (Million), by Country 2024 & 2032
- Figure 48: Europe Car Sharing Market Volume (Billion), by Country 2024 & 2032
- Figure 49: Europe Car Sharing Market Revenue Share (%), by Country 2024 & 2032
- Figure 50: Europe Car Sharing Market Volume Share (%), by Country 2024 & 2032
- Figure 51: Asia Pacific Car Sharing Market Revenue (Million), by Booking Type 2024 & 2032
- Figure 52: Asia Pacific Car Sharing Market Volume (Billion), by Booking Type 2024 & 2032
- Figure 53: Asia Pacific Car Sharing Market Revenue Share (%), by Booking Type 2024 & 2032
- Figure 54: Asia Pacific Car Sharing Market Volume Share (%), by Booking Type 2024 & 2032
- Figure 55: Asia Pacific Car Sharing Market Revenue (Million), by Application Type 2024 & 2032
- Figure 56: Asia Pacific Car Sharing Market Volume (Billion), by Application Type 2024 & 2032
- Figure 57: Asia Pacific Car Sharing Market Revenue Share (%), by Application Type 2024 & 2032
- Figure 58: Asia Pacific Car Sharing Market Volume Share (%), by Application Type 2024 & 2032
- Figure 59: Asia Pacific Car Sharing Market Revenue (Million), by Vehicle Type 2024 & 2032
- Figure 60: Asia Pacific Car Sharing Market Volume (Billion), by Vehicle Type 2024 & 2032
- Figure 61: Asia Pacific Car Sharing Market Revenue Share (%), by Vehicle Type 2024 & 2032
- Figure 62: Asia Pacific Car Sharing Market Volume Share (%), by Vehicle Type 2024 & 2032
- Figure 63: Asia Pacific Car Sharing Market Revenue (Million), by Type 2024 & 2032
- Figure 64: Asia Pacific Car Sharing Market Volume (Billion), by Type 2024 & 2032
- Figure 65: Asia Pacific Car Sharing Market Revenue Share (%), by Type 2024 & 2032
- Figure 66: Asia Pacific Car Sharing Market Volume Share (%), by Type 2024 & 2032
- Figure 67: Asia Pacific Car Sharing Market Revenue (Million), by Trip Type 2024 & 2032
- Figure 68: Asia Pacific Car Sharing Market Volume (Billion), by Trip Type 2024 & 2032
- Figure 69: Asia Pacific Car Sharing Market Revenue Share (%), by Trip Type 2024 & 2032
- Figure 70: Asia Pacific Car Sharing Market Volume Share (%), by Trip Type 2024 & 2032
- Figure 71: Asia Pacific Car Sharing Market Revenue (Million), by Country 2024 & 2032
- Figure 72: Asia Pacific Car Sharing Market Volume (Billion), by Country 2024 & 2032
- Figure 73: Asia Pacific Car Sharing Market Revenue Share (%), by Country 2024 & 2032
- Figure 74: Asia Pacific Car Sharing Market Volume Share (%), by Country 2024 & 2032
- Figure 75: Rest of the World Car Sharing Market Revenue (Million), by Booking Type 2024 & 2032
- Figure 76: Rest of the World Car Sharing Market Volume (Billion), by Booking Type 2024 & 2032
- Figure 77: Rest of the World Car Sharing Market Revenue Share (%), by Booking Type 2024 & 2032
- Figure 78: Rest of the World Car Sharing Market Volume Share (%), by Booking Type 2024 & 2032
- Figure 79: Rest of the World Car Sharing Market Revenue (Million), by Application Type 2024 & 2032
- Figure 80: Rest of the World Car Sharing Market Volume (Billion), by Application Type 2024 & 2032
- Figure 81: Rest of the World Car Sharing Market Revenue Share (%), by Application Type 2024 & 2032
- Figure 82: Rest of the World Car Sharing Market Volume Share (%), by Application Type 2024 & 2032
- Figure 83: Rest of the World Car Sharing Market Revenue (Million), by Vehicle Type 2024 & 2032
- Figure 84: Rest of the World Car Sharing Market Volume (Billion), by Vehicle Type 2024 & 2032
- Figure 85: Rest of the World Car Sharing Market Revenue Share (%), by Vehicle Type 2024 & 2032
- Figure 86: Rest of the World Car Sharing Market Volume Share (%), by Vehicle Type 2024 & 2032
- Figure 87: Rest of the World Car Sharing Market Revenue (Million), by Type 2024 & 2032
- Figure 88: Rest of the World Car Sharing Market Volume (Billion), by Type 2024 & 2032
- Figure 89: Rest of the World Car Sharing Market Revenue Share (%), by Type 2024 & 2032
- Figure 90: Rest of the World Car Sharing Market Volume Share (%), by Type 2024 & 2032
- Figure 91: Rest of the World Car Sharing Market Revenue (Million), by Trip Type 2024 & 2032
- Figure 92: Rest of the World Car Sharing Market Volume (Billion), by Trip Type 2024 & 2032
- Figure 93: Rest of the World Car Sharing Market Revenue Share (%), by Trip Type 2024 & 2032
- Figure 94: Rest of the World Car Sharing Market Volume Share (%), by Trip Type 2024 & 2032
- Figure 95: Rest of the World Car Sharing Market Revenue (Million), by Country 2024 & 2032
- Figure 96: Rest of the World Car Sharing Market Volume (Billion), by Country 2024 & 2032
- Figure 97: Rest of the World Car Sharing Market Revenue Share (%), by Country 2024 & 2032
- Figure 98: Rest of the World Car Sharing Market Volume Share (%), by Country 2024 & 2032
List of Tables
- Table 1: Global Car Sharing Market Revenue Million Forecast, by Region 2019 & 2032
- Table 2: Global Car Sharing Market Volume Billion Forecast, by Region 2019 & 2032
- Table 3: Global Car Sharing Market Revenue Million Forecast, by Booking Type 2019 & 2032
- Table 4: Global Car Sharing Market Volume Billion Forecast, by Booking Type 2019 & 2032
- Table 5: Global Car Sharing Market Revenue Million Forecast, by Application Type 2019 & 2032
- Table 6: Global Car Sharing Market Volume Billion Forecast, by Application Type 2019 & 2032
- Table 7: Global Car Sharing Market Revenue Million Forecast, by Vehicle Type 2019 & 2032
- Table 8: Global Car Sharing Market Volume Billion Forecast, by Vehicle Type 2019 & 2032
- Table 9: Global Car Sharing Market Revenue Million Forecast, by Type 2019 & 2032
- Table 10: Global Car Sharing Market Volume Billion Forecast, by Type 2019 & 2032
- Table 11: Global Car Sharing Market Revenue Million Forecast, by Trip Type 2019 & 2032
- Table 12: Global Car Sharing Market Volume Billion Forecast, by Trip Type 2019 & 2032
- Table 13: Global Car Sharing Market Revenue Million Forecast, by Region 2019 & 2032
- Table 14: Global Car Sharing Market Volume Billion Forecast, by Region 2019 & 2032
- Table 15: Global Car Sharing Market Revenue Million Forecast, by Booking Type 2019 & 2032
- Table 16: Global Car Sharing Market Volume Billion Forecast, by Booking Type 2019 & 2032
- Table 17: Global Car Sharing Market Revenue Million Forecast, by Application Type 2019 & 2032
- Table 18: Global Car Sharing Market Volume Billion Forecast, by Application Type 2019 & 2032
- Table 19: Global Car Sharing Market Revenue Million Forecast, by Vehicle Type 2019 & 2032
- Table 20: Global Car Sharing Market Volume Billion Forecast, by Vehicle Type 2019 & 2032
- Table 21: Global Car Sharing Market Revenue Million Forecast, by Type 2019 & 2032
- Table 22: Global Car Sharing Market Volume Billion Forecast, by Type 2019 & 2032
- Table 23: Global Car Sharing Market Revenue Million Forecast, by Trip Type 2019 & 2032
- Table 24: Global Car Sharing Market Volume Billion Forecast, by Trip Type 2019 & 2032
- Table 25: Global Car Sharing Market Revenue Million Forecast, by Country 2019 & 2032
- Table 26: Global Car Sharing Market Volume Billion Forecast, by Country 2019 & 2032
- Table 27: United States Car Sharing Market Revenue (Million) Forecast, by Application 2019 & 2032
- Table 28: United States Car Sharing Market Volume (Billion) Forecast, by Application 2019 & 2032
- Table 29: Canada Car Sharing Market Revenue (Million) Forecast, by Application 2019 & 2032
- Table 30: Canada Car Sharing Market Volume (Billion) Forecast, by Application 2019 & 2032
- Table 31: Rest of North America Car Sharing Market Revenue (Million) Forecast, by Application 2019 & 2032
- Table 32: Rest of North America Car Sharing Market Volume (Billion) Forecast, by Application 2019 & 2032
- Table 33: Global Car Sharing Market Revenue Million Forecast, by Booking Type 2019 & 2032
- Table 34: Global Car Sharing Market Volume Billion Forecast, by Booking Type 2019 & 2032
- Table 35: Global Car Sharing Market Revenue Million Forecast, by Application Type 2019 & 2032
- Table 36: Global Car Sharing Market Volume Billion Forecast, by Application Type 2019 & 2032
- Table 37: Global Car Sharing Market Revenue Million Forecast, by Vehicle Type 2019 & 2032
- Table 38: Global Car Sharing Market Volume Billion Forecast, by Vehicle Type 2019 & 2032
- Table 39: Global Car Sharing Market Revenue Million Forecast, by Type 2019 & 2032
- Table 40: Global Car Sharing Market Volume Billion Forecast, by Type 2019 & 2032
- Table 41: Global Car Sharing Market Revenue Million Forecast, by Trip Type 2019 & 2032
- Table 42: Global Car Sharing Market Volume Billion Forecast, by Trip Type 2019 & 2032
- Table 43: Global Car Sharing Market Revenue Million Forecast, by Country 2019 & 2032
- Table 44: Global Car Sharing Market Volume Billion Forecast, by Country 2019 & 2032
- Table 45: Germany Car Sharing Market Revenue (Million) Forecast, by Application 2019 & 2032
- Table 46: Germany Car Sharing Market Volume (Billion) Forecast, by Application 2019 & 2032
- Table 47: United Kingdom Car Sharing Market Revenue (Million) Forecast, by Application 2019 & 2032
- Table 48: United Kingdom Car Sharing Market Volume (Billion) Forecast, by Application 2019 & 2032
- Table 49: France Car Sharing Market Revenue (Million) Forecast, by Application 2019 & 2032
- Table 50: France Car Sharing Market Volume (Billion) Forecast, by Application 2019 & 2032
- Table 51: Italy Car Sharing Market Revenue (Million) Forecast, by Application 2019 & 2032
- Table 52: Italy Car Sharing Market Volume (Billion) Forecast, by Application 2019 & 2032
- Table 53: Spain Car Sharing Market Revenue (Million) Forecast, by Application 2019 & 2032
- Table 54: Spain Car Sharing Market Volume (Billion) Forecast, by Application 2019 & 2032
- Table 55: Rest of Europe Car Sharing Market Revenue (Million) Forecast, by Application 2019 & 2032
- Table 56: Rest of Europe Car Sharing Market Volume (Billion) Forecast, by Application 2019 & 2032
- Table 57: Global Car Sharing Market Revenue Million Forecast, by Booking Type 2019 & 2032
- Table 58: Global Car Sharing Market Volume Billion Forecast, by Booking Type 2019 & 2032
- Table 59: Global Car Sharing Market Revenue Million Forecast, by Application Type 2019 & 2032
- Table 60: Global Car Sharing Market Volume Billion Forecast, by Application Type 2019 & 2032
- Table 61: Global Car Sharing Market Revenue Million Forecast, by Vehicle Type 2019 & 2032
- Table 62: Global Car Sharing Market Volume Billion Forecast, by Vehicle Type 2019 & 2032
- Table 63: Global Car Sharing Market Revenue Million Forecast, by Type 2019 & 2032
- Table 64: Global Car Sharing Market Volume Billion Forecast, by Type 2019 & 2032
- Table 65: Global Car Sharing Market Revenue Million Forecast, by Trip Type 2019 & 2032
- Table 66: Global Car Sharing Market Volume Billion Forecast, by Trip Type 2019 & 2032
- Table 67: Global Car Sharing Market Revenue Million Forecast, by Country 2019 & 2032
- Table 68: Global Car Sharing Market Volume Billion Forecast, by Country 2019 & 2032
- Table 69: China Car Sharing Market Revenue (Million) Forecast, by Application 2019 & 2032
- Table 70: China Car Sharing Market Volume (Billion) Forecast, by Application 2019 & 2032
- Table 71: India Car Sharing Market Revenue (Million) Forecast, by Application 2019 & 2032
- Table 72: India Car Sharing Market Volume (Billion) Forecast, by Application 2019 & 2032
- Table 73: Japan Car Sharing Market Revenue (Million) Forecast, by Application 2019 & 2032
- Table 74: Japan Car Sharing Market Volume (Billion) Forecast, by Application 2019 & 2032
- Table 75: South Korea Car Sharing Market Revenue (Million) Forecast, by Application 2019 & 2032
- Table 76: South Korea Car Sharing Market Volume (Billion) Forecast, by Application 2019 & 2032
- Table 77: Rest of Asia Pacific Car Sharing Market Revenue (Million) Forecast, by Application 2019 & 2032
- Table 78: Rest of Asia Pacific Car Sharing Market Volume (Billion) Forecast, by Application 2019 & 2032
- Table 79: Global Car Sharing Market Revenue Million Forecast, by Booking Type 2019 & 2032
- Table 80: Global Car Sharing Market Volume Billion Forecast, by Booking Type 2019 & 2032
- Table 81: Global Car Sharing Market Revenue Million Forecast, by Application Type 2019 & 2032
- Table 82: Global Car Sharing Market Volume Billion Forecast, by Application Type 2019 & 2032
- Table 83: Global Car Sharing Market Revenue Million Forecast, by Vehicle Type 2019 & 2032
- Table 84: Global Car Sharing Market Volume Billion Forecast, by Vehicle Type 2019 & 2032
- Table 85: Global Car Sharing Market Revenue Million Forecast, by Type 2019 & 2032
- Table 86: Global Car Sharing Market Volume Billion Forecast, by Type 2019 & 2032
- Table 87: Global Car Sharing Market Revenue Million Forecast, by Trip Type 2019 & 2032
- Table 88: Global Car Sharing Market Volume Billion Forecast, by Trip Type 2019 & 2032
- Table 89: Global Car Sharing Market Revenue Million Forecast, by Country 2019 & 2032
- Table 90: Global Car Sharing Market Volume Billion Forecast, by Country 2019 & 2032
- Table 91: South America Car Sharing Market Revenue (Million) Forecast, by Application 2019 & 2032
- Table 92: South America Car Sharing Market Volume (Billion) Forecast, by Application 2019 & 2032
- Table 93: Middle East and Africa Car Sharing Market Revenue (Million) Forecast, by Application 2019 & 2032
- Table 94: Middle East and Africa Car Sharing Market Volume (Billion) Forecast, by Application 2019 & 2032
Frequently Asked Questions
1. What is the projected Compound Annual Growth Rate (CAGR) of the Car Sharing Market?
The projected CAGR is approximately 20.00%.
2. Which companies are prominent players in the Car Sharing Market?
Key companies in the market include Zipcar Inc, Getaround Inc, Zoomcar Ltd, SOCAR Group, Share Now GmbH, Grab Holdings Limited, Turo Inc, Scoop Technologies Inc, BlaBlaCar (Comuto SA), Enterprise Holdings Inc, Enilive S p A (Enjoy Car Sharing.
3. What are the main segments of the Car Sharing Market?
The market segments include Booking Type, Application Type, Vehicle Type, Type, Trip Type.
4. Can you provide details about the market size?
The market size is estimated to be USD 9.60 Million as of 2022.
5. What are some drivers contributing to market growth?
The Rise in Consumer Trend Toward Shared Mobility.
6. What are the notable trends driving market growth?
Online Booking Hold Major Market Share.
7. Are there any restraints impacting market growth?
The Rise in Consumer Trend Toward Shared Mobility.
8. Can you provide examples of recent developments in the market?
In March 2024, Alphabet's autonomous driving division, Waymo, introduced its ride-hailing service, Waymo One, in Los Angeles, California. The service is being offered to the public for free, and this decision was made after the successful completion of the Waymo One Tour program that the company initiated in the city.
9. What pricing options are available for accessing the report?
Pricing options include single-user, multi-user, and enterprise licenses priced at USD 4750, USD 5250, and USD 8750 respectively.
10. Is the market size provided in terms of value or volume?
The market size is provided in terms of value, measured in Million and volume, measured in Billion.
11. Are there any specific market keywords associated with the report?
Yes, the market keyword associated with the report is "Car Sharing Market," which aids in identifying and referencing the specific market segment covered.
12. How do I determine which pricing option suits my needs best?
The pricing options vary based on user requirements and access needs. Individual users may opt for single-user licenses, while businesses requiring broader access may choose multi-user or enterprise licenses for cost-effective access to the report.
13. Are there any additional resources or data provided in the Car Sharing Market report?
While the report offers comprehensive insights, it's advisable to review the specific contents or supplementary materials provided to ascertain if additional resources or data are available.
14. How can I stay updated on further developments or reports in the Car Sharing Market?
To stay informed about further developments, trends, and reports in the Car Sharing Market, consider subscribing to industry newsletters, following relevant companies and organizations, or regularly checking reputable industry news sources and publications.
Methodology
Step 1 - Identification of Relevant Samples Size from Population Database


Step 2 - Approaches for Defining Global Market Size (Value, Volume* & Price*)

Note*: In applicable scenarios
Step 3 - Data Sources
Primary Research
- Web Analytics
- Survey Reports
- Research Institute
- Latest Research Reports
- Opinion Leaders
Secondary Research
- Annual Reports
- White Paper
- Latest Press Release
- Industry Association
- Paid Database
- Investor Presentations

Step 4 - Data Triangulation
Involves using different sources of information in order to increase the validity of a study
These sources are likely to be stakeholders in a program - participants, other researchers, program staff, other community members, and so on.
Then we put all data in single framework & apply various statistical tools to find out the dynamic on the market.
During the analysis stage, feedback from the stakeholder groups would be compared to determine areas of agreement as well as areas of divergence


