

Key Insights
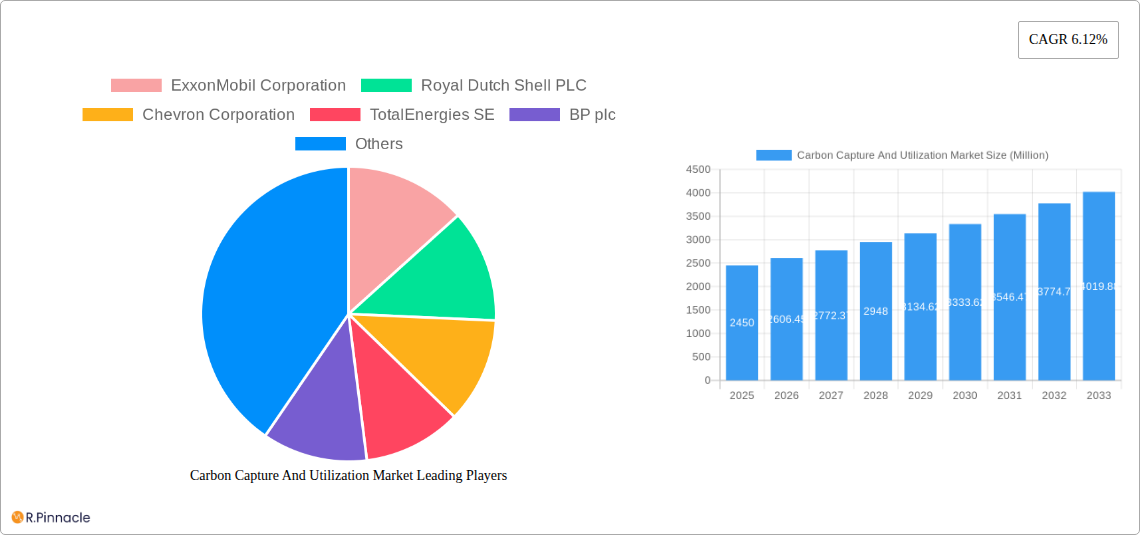
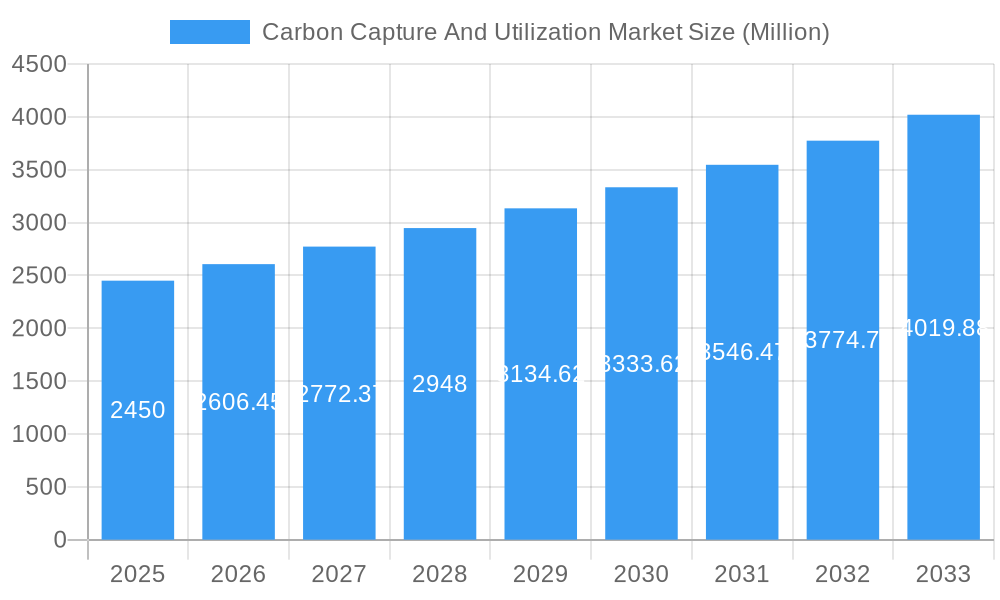
The Carbon Capture and Utilization (CCU) market is experiencing robust growth, projected to reach a market size of $2.45 billion in 2025 and exhibiting a Compound Annual Growth Rate (CAGR) of 6.12% from 2025 to 2033. This expansion is driven by increasing global concerns about climate change and the urgent need to reduce greenhouse gas emissions. Stringent environmental regulations worldwide are compelling industries to adopt CCU technologies, while government incentives and subsidies further stimulate market growth. Technological advancements in capture, transportation, and utilization methods are also contributing to the sector's rise, making CCU solutions more efficient and cost-effective. Key players like ExxonMobil, Shell, Chevron, and TotalEnergies are heavily investing in R&D and deploying CCU projects, fueling market competition and innovation. The market segmentation is largely driven by the types of industries adopting CCU (e.g., power generation, cement, chemicals) and the specific utilization pathways chosen (e.g., enhanced oil recovery, production of valuable chemicals). The development and implementation of carbon pricing mechanisms are creating a favorable environment for CCU adoption, and the increasing availability of funding and partnerships are enabling further market expansion.
Carbon Capture And Utilization Market Market Size (In Billion)
Despite the positive outlook, challenges remain. High initial capital costs associated with implementing CCU infrastructure pose a significant barrier for many companies. The energy intensity of some capture technologies and the need for efficient transportation and storage solutions are ongoing concerns. However, ongoing research and development efforts are continuously addressing these limitations, promising more efficient and sustainable CCU solutions in the coming years. The market's growth trajectory is expected to remain strong, driven by a combination of regulatory pressure, technological advancements, and growing corporate social responsibility initiatives. Continued innovation in capture and utilization technologies will be critical in unlocking the full potential of CCU and achieving significant reductions in global carbon emissions.
Carbon Capture And Utilization Market Company Market Share
Carbon Capture and Utilization (CCU) Market Report: 2019-2033
This comprehensive report provides an in-depth analysis of the Carbon Capture and Utilization (CCU) market, offering valuable insights for industry professionals, investors, and policymakers. Covering the period 2019-2033, with a base year of 2025, this report unveils market dynamics, technological advancements, and key players shaping the future of CCU. Projected market value reaches xx Million by 2033, presenting substantial growth opportunities.
Carbon Capture And Utilization Market Market Structure & Innovation Trends
The Carbon Capture and Utilization (CCU) market is characterized by a moderately concentrated structure, featuring a blend of established energy giants and emerging technology providers. Leading companies such as ExxonMobil Corporation, Royal Dutch Shell PLC, Chevron Corporation, TotalEnergies SE, BP plc, and Equinor ASA are significant stakeholders, collectively anticipated to hold a substantial market share in 2025. Innovation is a critical catalyst for market expansion, with ongoing advancements in diverse capture technologies, including sophisticated membrane separation techniques, highly efficient chemical absorption processes, and novel adsorbent materials. Concurrently, utilization pathways are evolving rapidly, encompassing enhanced oil recovery (EOR), the production of valuable chemicals and synthetic fuels, and the development of building materials. The global regulatory landscape plays a pivotal role, with varying degrees of government support and mandates across different regions, directly influencing investment decisions and the pace of adoption. Competitive pressures arise from established product substitutes, such as intensified energy efficiency measures and the growing deployment of renewable energy sources. The market has also experienced a moderate level of merger and acquisition (M&A) activity in recent years, with annual deal values in the range of approximately $XX to $YY Million, primarily driven by the strategic acquisition of cutting-edge technologies and the expansion into new geographical markets.
- Market Concentration: Moderately concentrated, with the top players projected to command approximately xx% of the market share in 2025.
- Key Innovation Drivers: Continuous technological breakthroughs in capture efficiency and cost reduction, development of diverse and high-value utilization pathways, and robust governmental policies and incentives.
- Regulatory Framework: A dynamic and regionally varied regulatory environment, which presents both opportunities and challenges for investment and market penetration.
- Competitive Landscape: Faces competition from established energy efficiency solutions and the expanding renewable energy sector.
- Primary End-User Segments: Predominantly industrial sectors, including power generation, cement manufacturing, steel production, and chemical processing.
- Merger & Acquisition (M&A) Trends: A consistent moderate level of M&A activity, with average annual deal values estimated between $XX and $YY Million, focusing on technology acquisition and market expansion.
Carbon Capture And Utilization Market Market Dynamics & Trends
The CCU market is experiencing robust growth, driven by increasing concerns about climate change and stringent emission reduction targets. Technological disruptions, such as the development of more efficient and cost-effective capture technologies, are accelerating market penetration. Consumer preferences for sustainable products are indirectly driving demand for CCU-derived materials. The competitive landscape is dynamic, with existing energy companies and emerging technology firms vying for market share. The market is expected to exhibit a CAGR of xx% from 2025 to 2033, reaching a projected market value of xx Million by 2033. Market penetration for CCU technologies is still relatively low (xx% in 2025), but expected to increase significantly driven by large-scale project deployments.
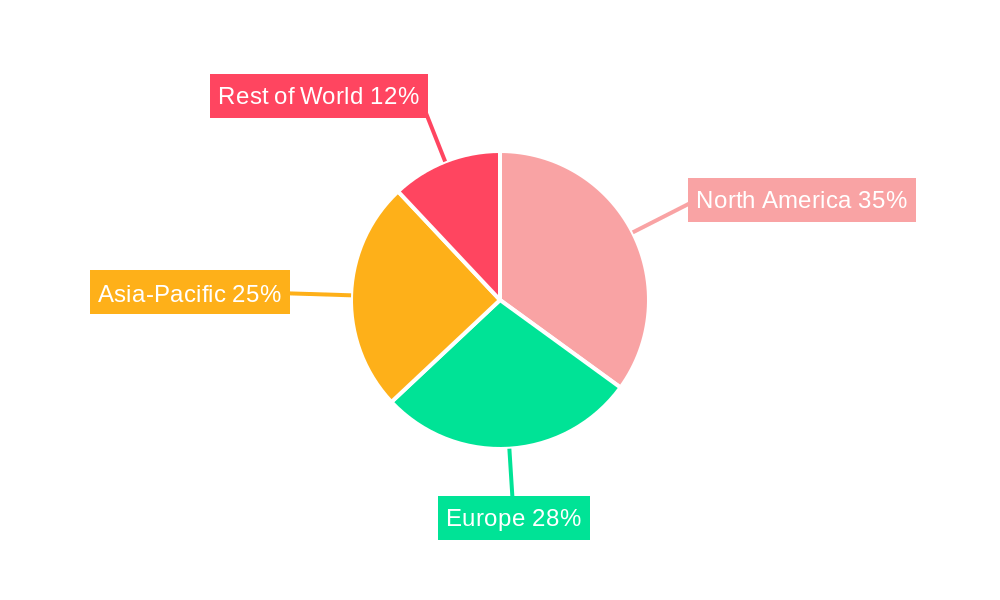
Dominant Regions & Segments in Carbon Capture And Utilization Market
The North American and European markets currently dominate the CCU landscape, driven by supportive government policies, robust industrial infrastructure, and significant investments in research and development. Asia-Pacific is also emerging as a key region due to increasing industrial activity and growing awareness of climate change. The power generation segment holds the largest market share, followed by the industrial sector.
- North America: Strong government support, advanced infrastructure, significant R&D investments.
- Europe: Stringent environmental regulations, substantial funding for CCU projects.
- Asia-Pacific: Rapid industrialization, increasing awareness of climate change.
- Power Generation Segment: Largest market share due to high emission levels.
- Industrial Segment: Significant potential for CCU application across various industries.
Carbon Capture And Utilization Market Product Innovations
Recent innovations focus on improving the efficiency and reducing the cost of carbon capture technologies. New applications are emerging in diverse sectors, including the production of chemicals, fuels, and building materials. These innovations offer significant competitive advantages, including reduced operational costs, improved capture rates, and the creation of high-value products.
Report Scope & Segmentation Analysis
This comprehensive report provides an in-depth analysis of the CCU market, meticulously segmenting it by key technological approaches, diverse application areas, and major geographical regions. Each segment is scrutinized to reveal distinct growth trajectories, current market valuations, and nuanced competitive dynamics. The post-combustion capture segment currently holds a dominant position within the market, while the enhanced oil recovery (EOR) application is anticipated to exhibit the most significant growth rate in the coming years due to its established infrastructure and economic viability.
Key Drivers of Carbon Capture And Utilization Market Growth
Several factors are driving CCU market growth:
- Stringent Environmental Regulations: Governments worldwide are implementing stricter emission reduction targets, creating a strong demand for CCU technologies.
- Technological Advancements: Continuous innovation is leading to more efficient and cost-effective CCU technologies.
- Economic Incentives: Governments are providing financial incentives (e.g., tax credits, subsidies) to encourage the adoption of CCU.
- Growing Awareness of Climate Change: Increased public and corporate awareness is driving demand for sustainable solutions.
Challenges in the Carbon Capture And Utilization Market Sector
Despite its significant growth potential and the increasing urgency for decarbonization, the CCU market navigates several substantial challenges:
- High Initial Capital Expenditure: The substantial upfront investment required for developing and deploying CCU facilities poses a significant barrier to widespread adoption, particularly for smaller enterprises.
- Energy Intensity of Processes: Many CCU technologies are inherently energy-intensive, which can impact their overall lifecycle carbon footprint and economic feasibility, necessitating further optimization.
- Complex Supply Chain Management: Ensuring the consistent availability of specialized materials, components, and a skilled workforce for the design, construction, and operation of CCU projects can present logistical hurdles.
- Evolving Regulatory and Policy Uncertainty: The dynamic nature of government policies, incentives, and carbon pricing mechanisms can create an unpredictable environment for long-term investment and project planning.
Emerging Opportunities in Carbon Capture And Utilization Market
Several promising opportunities are emerging:
- New Markets: Expanding into emerging economies with rapidly growing industrial sectors.
- Technology Integration: Integrating CCU technologies with other renewable energy sources and energy storage systems.
- Product Diversification: Developing new applications for captured carbon, creating high-value products.
- Carbon Pricing Mechanisms: Expanding carbon pricing schemes globally creates market value for CCU.
Leading Players in the Carbon Capture And Utilization Market Market
Key Developments in Carbon Capture And Utilization Market Industry
- April 2024: TotalEnergies and Vanguard Renewables have established a strategic joint venture aimed at developing Farm Powered Renewable Natural Gas (RNG) initiatives across the United States, underscoring a growing focus on circular economy solutions.
- February 2023: Aker Solutions secured a significant contract for the Draugen project, a pioneering initiative expected to contribute to an annual reduction of up to 200,000 tons of CO2 emissions, showcasing tangible progress in large-scale CCU deployment.
Future Outlook for Carbon Capture And Utilization Market Market
The Carbon Capture and Utilization market is projected for substantial and accelerated growth in the foreseeable future. This expansion will be fueled by an escalating global demand for sustainable decarbonization solutions, coupled with continuous advancements in CCU technologies that are driving down costs and improving efficiency. Strategic collaborations between industry players, increased investments in cutting-edge research and development, and the implementation of supportive government policies and financial incentives will act as key accelerators for market expansion. Furthermore, a growing emphasis on transforming captured carbon into high-value products, such as sustainable fuels, chemicals, and construction materials, will be instrumental in enhancing the economic viability and market success of CCU initiatives.
Carbon Capture And Utilization Market Segmentation
-
1. Service
- 1.1. Capture
- 1.2. Transportation
- 1.3. Utilization
- 1.4. Storage
-
2. Technology
- 2.1. Pre-combustion Capture
- 2.2. Oxy-fuel Combustion Capture
- 2.3. Post-combustion Capture
-
3. End User
- 3.1. Oil and Gas
- 3.2. Power Generation
- 3.3. Iron and Steel
- 3.4. Chemical and Petrochemical
- 3.5. Cement
- 3.6. Other End Users
Carbon Capture And Utilization Market Segmentation By Geography
-
1. Asia Pacific
- 1.1. India
- 1.2. China
- 1.3. Japan
- 1.4. Australia
- 1.5. Rest of Asia Pacific
-
2. North America
- 2.1. United States
- 2.2. Canada
- 2.3. Rest of North America
-
3. Europe
- 3.1. Germany
- 3.2. United Kingdom
- 3.3. France
- 3.4. Russia
- 3.5. Rest of Europe
-
4. South America
- 4.1. Brazil
- 4.2. Argentina
- 4.3. Rest of South America
-
5. Middle East and Africa
- 5.1. United Arab Emirates
- 5.2. South Africa
- 5.3. Rest of Middle East and Africa
Carbon Capture And Utilization Market Regional Market Share
Geographic Coverage of Carbon Capture And Utilization Market
Carbon Capture And Utilization Market REPORT HIGHLIGHTS
| Aspects | Details |
|---|---|
| Study Period | 2020-2034 |
| Base Year | 2025 |
| Estimated Year | 2026 |
| Forecast Period | 2026-2034 |
| Historical Period | 2020-2025 |
| Growth Rate | CAGR of 6.12% from 2020-2034 |
| Segmentation |
|
Table of Contents
- 1. Introduction
- 1.1. Research Scope
- 1.2. Market Segmentation
- 1.3. Research Objective
- 1.4. Definitions and Assumptions
- 2. Executive Summary
- 2.1. Market Snapshot
- 3. Market Dynamics
- 3.1. Market Drivers
- 3.2. Market Restrains
- 3.3. Market Trends
- 3.4. Market Opportunities
- 4. Market Factor Analysis
- 4.1. Porters Five Forces
- 4.1.1. Bargaining Power of Suppliers
- 4.1.2. Bargaining Power of Buyers
- 4.1.3. Threat of New Entrants
- 4.1.4. Threat of Substitutes
- 4.1.5. Competitive Rivalry
- 4.2. PESTEL analysis
- 4.3. BCG Analysis
- 4.3.1. Stars (High Growth, High Market Share)
- 4.3.2. Cash Cows (Low Growth, High Market Share)
- 4.3.3. Question Mark (High Growth, Low Market Share)
- 4.3.4. Dogs (Low Growth, Low Market Share)
- 4.4. Ansoff Matrix Analysis
- 4.5. Supply Chain Analysis
- 4.6. Regulatory Landscape
- 4.7. Current Market Potential and Opportunity Assessment (TAM–SAM–SOM Framework)
- 4.8. PRI Analyst Note
- 4.1. Porters Five Forces
- 5. Market Analysis, Insights and Forecast 2021-2033
- 5.1. Market Analysis, Insights and Forecast - by Service
- 5.1.1. Capture
- 5.1.2. Transportation
- 5.1.3. Utilization
- 5.1.4. Storage
- 5.2. Market Analysis, Insights and Forecast - by Technology
- 5.2.1. Pre-combustion Capture
- 5.2.2. Oxy-fuel Combustion Capture
- 5.2.3. Post-combustion Capture
- 5.3. Market Analysis, Insights and Forecast - by End User
- 5.3.1. Oil and Gas
- 5.3.2. Power Generation
- 5.3.3. Iron and Steel
- 5.3.4. Chemical and Petrochemical
- 5.3.5. Cement
- 5.3.6. Other End Users
- 5.4. Market Analysis, Insights and Forecast - by Region
- 5.4.1. Asia Pacific
- 5.4.2. North America
- 5.4.3. Europe
- 5.4.4. South America
- 5.4.5. Middle East and Africa
- 5.1. Market Analysis, Insights and Forecast - by Service
- 6. Global Carbon Capture And Utilization Market Analysis, Insights and Forecast, 2021-2033
- 6.1. Market Analysis, Insights and Forecast - by Service
- 6.1.1. Capture
- 6.1.2. Transportation
- 6.1.3. Utilization
- 6.1.4. Storage
- 6.2. Market Analysis, Insights and Forecast - by Technology
- 6.2.1. Pre-combustion Capture
- 6.2.2. Oxy-fuel Combustion Capture
- 6.2.3. Post-combustion Capture
- 6.3. Market Analysis, Insights and Forecast - by End User
- 6.3.1. Oil and Gas
- 6.3.2. Power Generation
- 6.3.3. Iron and Steel
- 6.3.4. Chemical and Petrochemical
- 6.3.5. Cement
- 6.3.6. Other End Users
- 6.1. Market Analysis, Insights and Forecast - by Service
- 7. Asia Pacific Carbon Capture And Utilization Market Analysis, Insights and Forecast, 2020-2032
- 7.1. Market Analysis, Insights and Forecast - by Service
- 7.1.1. Capture
- 7.1.2. Transportation
- 7.1.3. Utilization
- 7.1.4. Storage
- 7.2. Market Analysis, Insights and Forecast - by Technology
- 7.2.1. Pre-combustion Capture
- 7.2.2. Oxy-fuel Combustion Capture
- 7.2.3. Post-combustion Capture
- 7.3. Market Analysis, Insights and Forecast - by End User
- 7.3.1. Oil and Gas
- 7.3.2. Power Generation
- 7.3.3. Iron and Steel
- 7.3.4. Chemical and Petrochemical
- 7.3.5. Cement
- 7.3.6. Other End Users
- 7.1. Market Analysis, Insights and Forecast - by Service
- 8. North America Carbon Capture And Utilization Market Analysis, Insights and Forecast, 2020-2032
- 8.1. Market Analysis, Insights and Forecast - by Service
- 8.1.1. Capture
- 8.1.2. Transportation
- 8.1.3. Utilization
- 8.1.4. Storage
- 8.2. Market Analysis, Insights and Forecast - by Technology
- 8.2.1. Pre-combustion Capture
- 8.2.2. Oxy-fuel Combustion Capture
- 8.2.3. Post-combustion Capture
- 8.3. Market Analysis, Insights and Forecast - by End User
- 8.3.1. Oil and Gas
- 8.3.2. Power Generation
- 8.3.3. Iron and Steel
- 8.3.4. Chemical and Petrochemical
- 8.3.5. Cement
- 8.3.6. Other End Users
- 8.1. Market Analysis, Insights and Forecast - by Service
- 9. Europe Carbon Capture And Utilization Market Analysis, Insights and Forecast, 2020-2032
- 9.1. Market Analysis, Insights and Forecast - by Service
- 9.1.1. Capture
- 9.1.2. Transportation
- 9.1.3. Utilization
- 9.1.4. Storage
- 9.2. Market Analysis, Insights and Forecast - by Technology
- 9.2.1. Pre-combustion Capture
- 9.2.2. Oxy-fuel Combustion Capture
- 9.2.3. Post-combustion Capture
- 9.3. Market Analysis, Insights and Forecast - by End User
- 9.3.1. Oil and Gas
- 9.3.2. Power Generation
- 9.3.3. Iron and Steel
- 9.3.4. Chemical and Petrochemical
- 9.3.5. Cement
- 9.3.6. Other End Users
- 9.1. Market Analysis, Insights and Forecast - by Service
- 10. South America Carbon Capture And Utilization Market Analysis, Insights and Forecast, 2020-2032
- 10.1. Market Analysis, Insights and Forecast - by Service
- 10.1.1. Capture
- 10.1.2. Transportation
- 10.1.3. Utilization
- 10.1.4. Storage
- 10.2. Market Analysis, Insights and Forecast - by Technology
- 10.2.1. Pre-combustion Capture
- 10.2.2. Oxy-fuel Combustion Capture
- 10.2.3. Post-combustion Capture
- 10.3. Market Analysis, Insights and Forecast - by End User
- 10.3.1. Oil and Gas
- 10.3.2. Power Generation
- 10.3.3. Iron and Steel
- 10.3.4. Chemical and Petrochemical
- 10.3.5. Cement
- 10.3.6. Other End Users
- 10.1. Market Analysis, Insights and Forecast - by Service
- 11. Middle East and Africa Carbon Capture And Utilization Market Analysis, Insights and Forecast, 2020-2032
- 11.1. Market Analysis, Insights and Forecast - by Service
- 11.1.1. Capture
- 11.1.2. Transportation
- 11.1.3. Utilization
- 11.1.4. Storage
- 11.2. Market Analysis, Insights and Forecast - by Technology
- 11.2.1. Pre-combustion Capture
- 11.2.2. Oxy-fuel Combustion Capture
- 11.2.3. Post-combustion Capture
- 11.3. Market Analysis, Insights and Forecast - by End User
- 11.3.1. Oil and Gas
- 11.3.2. Power Generation
- 11.3.3. Iron and Steel
- 11.3.4. Chemical and Petrochemical
- 11.3.5. Cement
- 11.3.6. Other End Users
- 11.1. Market Analysis, Insights and Forecast - by Service
- 12. Competitive Analysis
- 12.1. Company Profiles
- 12.1.1 ExxonMobil Corporation
- 12.1.1.1. Company Overview
- 12.1.1.2. Products
- 12.1.1.3. Company Financials
- 12.1.1.4. SWOT Analysis
- 12.1.2 Royal Dutch Shell PLC
- 12.1.2.1. Company Overview
- 12.1.2.2. Products
- 12.1.2.3. Company Financials
- 12.1.2.4. SWOT Analysis
- 12.1.3 Chevron Corporation
- 12.1.3.1. Company Overview
- 12.1.3.2. Products
- 12.1.3.3. Company Financials
- 12.1.3.4. SWOT Analysis
- 12.1.4 TotalEnergies SE
- 12.1.4.1. Company Overview
- 12.1.4.2. Products
- 12.1.4.3. Company Financials
- 12.1.4.4. SWOT Analysis
- 12.1.5 BP plc
- 12.1.5.1. Company Overview
- 12.1.5.2. Products
- 12.1.5.3. Company Financials
- 12.1.5.4. SWOT Analysis
- 12.1.6 Equinor ASA
- 12.1.6.1. Company Overview
- 12.1.6.2. Products
- 12.1.6.3. Company Financials
- 12.1.6.4. SWOT Analysis
- 12.1.7 Mitsubishi Heavy Industries Ltd
- 12.1.7.1. Company Overview
- 12.1.7.2. Products
- 12.1.7.3. Company Financials
- 12.1.7.4. SWOT Analysis
- 12.1.8 Air Products and Chemicals Inc
- 12.1.8.1. Company Overview
- 12.1.8.2. Products
- 12.1.8.3. Company Financials
- 12.1.8.4. SWOT Analysis
- 12.1.9 Aker Solutions ASA
- 12.1.9.1. Company Overview
- 12.1.9.2. Products
- 12.1.9.3. Company Financials
- 12.1.9.4. SWOT Analysis
- 12.1.10 Schlumberger Limited
- 12.1.10.1. Company Overview
- 12.1.10.2. Products
- 12.1.10.3. Company Financials
- 12.1.10.4. SWOT Analysis
- 12.1.1 ExxonMobil Corporation
- 12.2. Market Entropy
- 12.2.1 Company's Key Areas Served
- 12.2.2 Recent Developments
- 12.3. Company Market Share Analysis 2025
- 12.3.1 Top 5 Companies Market Share Analysis
- 12.3.2 Top 3 Companies Market Share Analysis
- 12.4. List of Potential Customers
- 13. Research Methodology
List of Figures
- Figure 1: Global Carbon Capture And Utilization Market Revenue Breakdown (Million, %) by Region 2025 & 2033
- Figure 2: Global Carbon Capture And Utilization Market Volume Breakdown (Billion, %) by Region 2025 & 2033
- Figure 3: Asia Pacific Carbon Capture And Utilization Market Revenue (Million), by Service 2025 & 2033
- Figure 4: Asia Pacific Carbon Capture And Utilization Market Volume (Billion), by Service 2025 & 2033
- Figure 5: Asia Pacific Carbon Capture And Utilization Market Revenue Share (%), by Service 2025 & 2033
- Figure 6: Asia Pacific Carbon Capture And Utilization Market Volume Share (%), by Service 2025 & 2033
- Figure 7: Asia Pacific Carbon Capture And Utilization Market Revenue (Million), by Technology 2025 & 2033
- Figure 8: Asia Pacific Carbon Capture And Utilization Market Volume (Billion), by Technology 2025 & 2033
- Figure 9: Asia Pacific Carbon Capture And Utilization Market Revenue Share (%), by Technology 2025 & 2033
- Figure 10: Asia Pacific Carbon Capture And Utilization Market Volume Share (%), by Technology 2025 & 2033
- Figure 11: Asia Pacific Carbon Capture And Utilization Market Revenue (Million), by End User 2025 & 2033
- Figure 12: Asia Pacific Carbon Capture And Utilization Market Volume (Billion), by End User 2025 & 2033
- Figure 13: Asia Pacific Carbon Capture And Utilization Market Revenue Share (%), by End User 2025 & 2033
- Figure 14: Asia Pacific Carbon Capture And Utilization Market Volume Share (%), by End User 2025 & 2033
- Figure 15: Asia Pacific Carbon Capture And Utilization Market Revenue (Million), by Country 2025 & 2033
- Figure 16: Asia Pacific Carbon Capture And Utilization Market Volume (Billion), by Country 2025 & 2033
- Figure 17: Asia Pacific Carbon Capture And Utilization Market Revenue Share (%), by Country 2025 & 2033
- Figure 18: Asia Pacific Carbon Capture And Utilization Market Volume Share (%), by Country 2025 & 2033
- Figure 19: North America Carbon Capture And Utilization Market Revenue (Million), by Service 2025 & 2033
- Figure 20: North America Carbon Capture And Utilization Market Volume (Billion), by Service 2025 & 2033
- Figure 21: North America Carbon Capture And Utilization Market Revenue Share (%), by Service 2025 & 2033
- Figure 22: North America Carbon Capture And Utilization Market Volume Share (%), by Service 2025 & 2033
- Figure 23: North America Carbon Capture And Utilization Market Revenue (Million), by Technology 2025 & 2033
- Figure 24: North America Carbon Capture And Utilization Market Volume (Billion), by Technology 2025 & 2033
- Figure 25: North America Carbon Capture And Utilization Market Revenue Share (%), by Technology 2025 & 2033
- Figure 26: North America Carbon Capture And Utilization Market Volume Share (%), by Technology 2025 & 2033
- Figure 27: North America Carbon Capture And Utilization Market Revenue (Million), by End User 2025 & 2033
- Figure 28: North America Carbon Capture And Utilization Market Volume (Billion), by End User 2025 & 2033
- Figure 29: North America Carbon Capture And Utilization Market Revenue Share (%), by End User 2025 & 2033
- Figure 30: North America Carbon Capture And Utilization Market Volume Share (%), by End User 2025 & 2033
- Figure 31: North America Carbon Capture And Utilization Market Revenue (Million), by Country 2025 & 2033
- Figure 32: North America Carbon Capture And Utilization Market Volume (Billion), by Country 2025 & 2033
- Figure 33: North America Carbon Capture And Utilization Market Revenue Share (%), by Country 2025 & 2033
- Figure 34: North America Carbon Capture And Utilization Market Volume Share (%), by Country 2025 & 2033
- Figure 35: Europe Carbon Capture And Utilization Market Revenue (Million), by Service 2025 & 2033
- Figure 36: Europe Carbon Capture And Utilization Market Volume (Billion), by Service 2025 & 2033
- Figure 37: Europe Carbon Capture And Utilization Market Revenue Share (%), by Service 2025 & 2033
- Figure 38: Europe Carbon Capture And Utilization Market Volume Share (%), by Service 2025 & 2033
- Figure 39: Europe Carbon Capture And Utilization Market Revenue (Million), by Technology 2025 & 2033
- Figure 40: Europe Carbon Capture And Utilization Market Volume (Billion), by Technology 2025 & 2033
- Figure 41: Europe Carbon Capture And Utilization Market Revenue Share (%), by Technology 2025 & 2033
- Figure 42: Europe Carbon Capture And Utilization Market Volume Share (%), by Technology 2025 & 2033
- Figure 43: Europe Carbon Capture And Utilization Market Revenue (Million), by End User 2025 & 2033
- Figure 44: Europe Carbon Capture And Utilization Market Volume (Billion), by End User 2025 & 2033
- Figure 45: Europe Carbon Capture And Utilization Market Revenue Share (%), by End User 2025 & 2033
- Figure 46: Europe Carbon Capture And Utilization Market Volume Share (%), by End User 2025 & 2033
- Figure 47: Europe Carbon Capture And Utilization Market Revenue (Million), by Country 2025 & 2033
- Figure 48: Europe Carbon Capture And Utilization Market Volume (Billion), by Country 2025 & 2033
- Figure 49: Europe Carbon Capture And Utilization Market Revenue Share (%), by Country 2025 & 2033
- Figure 50: Europe Carbon Capture And Utilization Market Volume Share (%), by Country 2025 & 2033
- Figure 51: South America Carbon Capture And Utilization Market Revenue (Million), by Service 2025 & 2033
- Figure 52: South America Carbon Capture And Utilization Market Volume (Billion), by Service 2025 & 2033
- Figure 53: South America Carbon Capture And Utilization Market Revenue Share (%), by Service 2025 & 2033
- Figure 54: South America Carbon Capture And Utilization Market Volume Share (%), by Service 2025 & 2033
- Figure 55: South America Carbon Capture And Utilization Market Revenue (Million), by Technology 2025 & 2033
- Figure 56: South America Carbon Capture And Utilization Market Volume (Billion), by Technology 2025 & 2033
- Figure 57: South America Carbon Capture And Utilization Market Revenue Share (%), by Technology 2025 & 2033
- Figure 58: South America Carbon Capture And Utilization Market Volume Share (%), by Technology 2025 & 2033
- Figure 59: South America Carbon Capture And Utilization Market Revenue (Million), by End User 2025 & 2033
- Figure 60: South America Carbon Capture And Utilization Market Volume (Billion), by End User 2025 & 2033
- Figure 61: South America Carbon Capture And Utilization Market Revenue Share (%), by End User 2025 & 2033
- Figure 62: South America Carbon Capture And Utilization Market Volume Share (%), by End User 2025 & 2033
- Figure 63: South America Carbon Capture And Utilization Market Revenue (Million), by Country 2025 & 2033
- Figure 64: South America Carbon Capture And Utilization Market Volume (Billion), by Country 2025 & 2033
- Figure 65: South America Carbon Capture And Utilization Market Revenue Share (%), by Country 2025 & 2033
- Figure 66: South America Carbon Capture And Utilization Market Volume Share (%), by Country 2025 & 2033
- Figure 67: Middle East and Africa Carbon Capture And Utilization Market Revenue (Million), by Service 2025 & 2033
- Figure 68: Middle East and Africa Carbon Capture And Utilization Market Volume (Billion), by Service 2025 & 2033
- Figure 69: Middle East and Africa Carbon Capture And Utilization Market Revenue Share (%), by Service 2025 & 2033
- Figure 70: Middle East and Africa Carbon Capture And Utilization Market Volume Share (%), by Service 2025 & 2033
- Figure 71: Middle East and Africa Carbon Capture And Utilization Market Revenue (Million), by Technology 2025 & 2033
- Figure 72: Middle East and Africa Carbon Capture And Utilization Market Volume (Billion), by Technology 2025 & 2033
- Figure 73: Middle East and Africa Carbon Capture And Utilization Market Revenue Share (%), by Technology 2025 & 2033
- Figure 74: Middle East and Africa Carbon Capture And Utilization Market Volume Share (%), by Technology 2025 & 2033
- Figure 75: Middle East and Africa Carbon Capture And Utilization Market Revenue (Million), by End User 2025 & 2033
- Figure 76: Middle East and Africa Carbon Capture And Utilization Market Volume (Billion), by End User 2025 & 2033
- Figure 77: Middle East and Africa Carbon Capture And Utilization Market Revenue Share (%), by End User 2025 & 2033
- Figure 78: Middle East and Africa Carbon Capture And Utilization Market Volume Share (%), by End User 2025 & 2033
- Figure 79: Middle East and Africa Carbon Capture And Utilization Market Revenue (Million), by Country 2025 & 2033
- Figure 80: Middle East and Africa Carbon Capture And Utilization Market Volume (Billion), by Country 2025 & 2033
- Figure 81: Middle East and Africa Carbon Capture And Utilization Market Revenue Share (%), by Country 2025 & 2033
- Figure 82: Middle East and Africa Carbon Capture And Utilization Market Volume Share (%), by Country 2025 & 2033
List of Tables
- Table 1: Global Carbon Capture And Utilization Market Revenue Million Forecast, by Service 2020 & 2033
- Table 2: Global Carbon Capture And Utilization Market Volume Billion Forecast, by Service 2020 & 2033
- Table 3: Global Carbon Capture And Utilization Market Revenue Million Forecast, by Technology 2020 & 2033
- Table 4: Global Carbon Capture And Utilization Market Volume Billion Forecast, by Technology 2020 & 2033
- Table 5: Global Carbon Capture And Utilization Market Revenue Million Forecast, by End User 2020 & 2033
- Table 6: Global Carbon Capture And Utilization Market Volume Billion Forecast, by End User 2020 & 2033
- Table 7: Global Carbon Capture And Utilization Market Revenue Million Forecast, by Region 2020 & 2033
- Table 8: Global Carbon Capture And Utilization Market Volume Billion Forecast, by Region 2020 & 2033
- Table 9: Global Carbon Capture And Utilization Market Revenue Million Forecast, by Service 2020 & 2033
- Table 10: Global Carbon Capture And Utilization Market Volume Billion Forecast, by Service 2020 & 2033
- Table 11: Global Carbon Capture And Utilization Market Revenue Million Forecast, by Technology 2020 & 2033
- Table 12: Global Carbon Capture And Utilization Market Volume Billion Forecast, by Technology 2020 & 2033
- Table 13: Global Carbon Capture And Utilization Market Revenue Million Forecast, by End User 2020 & 2033
- Table 14: Global Carbon Capture And Utilization Market Volume Billion Forecast, by End User 2020 & 2033
- Table 15: Global Carbon Capture And Utilization Market Revenue Million Forecast, by Country 2020 & 2033
- Table 16: Global Carbon Capture And Utilization Market Volume Billion Forecast, by Country 2020 & 2033
- Table 17: India Carbon Capture And Utilization Market Revenue (Million) Forecast, by Application 2020 & 2033
- Table 18: India Carbon Capture And Utilization Market Volume (Billion) Forecast, by Application 2020 & 2033
- Table 19: China Carbon Capture And Utilization Market Revenue (Million) Forecast, by Application 2020 & 2033
- Table 20: China Carbon Capture And Utilization Market Volume (Billion) Forecast, by Application 2020 & 2033
- Table 21: Japan Carbon Capture And Utilization Market Revenue (Million) Forecast, by Application 2020 & 2033
- Table 22: Japan Carbon Capture And Utilization Market Volume (Billion) Forecast, by Application 2020 & 2033
- Table 23: Australia Carbon Capture And Utilization Market Revenue (Million) Forecast, by Application 2020 & 2033
- Table 24: Australia Carbon Capture And Utilization Market Volume (Billion) Forecast, by Application 2020 & 2033
- Table 25: Rest of Asia Pacific Carbon Capture And Utilization Market Revenue (Million) Forecast, by Application 2020 & 2033
- Table 26: Rest of Asia Pacific Carbon Capture And Utilization Market Volume (Billion) Forecast, by Application 2020 & 2033
- Table 27: Global Carbon Capture And Utilization Market Revenue Million Forecast, by Service 2020 & 2033
- Table 28: Global Carbon Capture And Utilization Market Volume Billion Forecast, by Service 2020 & 2033
- Table 29: Global Carbon Capture And Utilization Market Revenue Million Forecast, by Technology 2020 & 2033
- Table 30: Global Carbon Capture And Utilization Market Volume Billion Forecast, by Technology 2020 & 2033
- Table 31: Global Carbon Capture And Utilization Market Revenue Million Forecast, by End User 2020 & 2033
- Table 32: Global Carbon Capture And Utilization Market Volume Billion Forecast, by End User 2020 & 2033
- Table 33: Global Carbon Capture And Utilization Market Revenue Million Forecast, by Country 2020 & 2033
- Table 34: Global Carbon Capture And Utilization Market Volume Billion Forecast, by Country 2020 & 2033
- Table 35: United States Carbon Capture And Utilization Market Revenue (Million) Forecast, by Application 2020 & 2033
- Table 36: United States Carbon Capture And Utilization Market Volume (Billion) Forecast, by Application 2020 & 2033
- Table 37: Canada Carbon Capture And Utilization Market Revenue (Million) Forecast, by Application 2020 & 2033
- Table 38: Canada Carbon Capture And Utilization Market Volume (Billion) Forecast, by Application 2020 & 2033
- Table 39: Rest of North America Carbon Capture And Utilization Market Revenue (Million) Forecast, by Application 2020 & 2033
- Table 40: Rest of North America Carbon Capture And Utilization Market Volume (Billion) Forecast, by Application 2020 & 2033
- Table 41: Global Carbon Capture And Utilization Market Revenue Million Forecast, by Service 2020 & 2033
- Table 42: Global Carbon Capture And Utilization Market Volume Billion Forecast, by Service 2020 & 2033
- Table 43: Global Carbon Capture And Utilization Market Revenue Million Forecast, by Technology 2020 & 2033
- Table 44: Global Carbon Capture And Utilization Market Volume Billion Forecast, by Technology 2020 & 2033
- Table 45: Global Carbon Capture And Utilization Market Revenue Million Forecast, by End User 2020 & 2033
- Table 46: Global Carbon Capture And Utilization Market Volume Billion Forecast, by End User 2020 & 2033
- Table 47: Global Carbon Capture And Utilization Market Revenue Million Forecast, by Country 2020 & 2033
- Table 48: Global Carbon Capture And Utilization Market Volume Billion Forecast, by Country 2020 & 2033
- Table 49: Germany Carbon Capture And Utilization Market Revenue (Million) Forecast, by Application 2020 & 2033
- Table 50: Germany Carbon Capture And Utilization Market Volume (Billion) Forecast, by Application 2020 & 2033
- Table 51: United Kingdom Carbon Capture And Utilization Market Revenue (Million) Forecast, by Application 2020 & 2033
- Table 52: United Kingdom Carbon Capture And Utilization Market Volume (Billion) Forecast, by Application 2020 & 2033
- Table 53: France Carbon Capture And Utilization Market Revenue (Million) Forecast, by Application 2020 & 2033
- Table 54: France Carbon Capture And Utilization Market Volume (Billion) Forecast, by Application 2020 & 2033
- Table 55: Russia Carbon Capture And Utilization Market Revenue (Million) Forecast, by Application 2020 & 2033
- Table 56: Russia Carbon Capture And Utilization Market Volume (Billion) Forecast, by Application 2020 & 2033
- Table 57: Rest of Europe Carbon Capture And Utilization Market Revenue (Million) Forecast, by Application 2020 & 2033
- Table 58: Rest of Europe Carbon Capture And Utilization Market Volume (Billion) Forecast, by Application 2020 & 2033
- Table 59: Global Carbon Capture And Utilization Market Revenue Million Forecast, by Service 2020 & 2033
- Table 60: Global Carbon Capture And Utilization Market Volume Billion Forecast, by Service 2020 & 2033
- Table 61: Global Carbon Capture And Utilization Market Revenue Million Forecast, by Technology 2020 & 2033
- Table 62: Global Carbon Capture And Utilization Market Volume Billion Forecast, by Technology 2020 & 2033
- Table 63: Global Carbon Capture And Utilization Market Revenue Million Forecast, by End User 2020 & 2033
- Table 64: Global Carbon Capture And Utilization Market Volume Billion Forecast, by End User 2020 & 2033
- Table 65: Global Carbon Capture And Utilization Market Revenue Million Forecast, by Country 2020 & 2033
- Table 66: Global Carbon Capture And Utilization Market Volume Billion Forecast, by Country 2020 & 2033
- Table 67: Brazil Carbon Capture And Utilization Market Revenue (Million) Forecast, by Application 2020 & 2033
- Table 68: Brazil Carbon Capture And Utilization Market Volume (Billion) Forecast, by Application 2020 & 2033
- Table 69: Argentina Carbon Capture And Utilization Market Revenue (Million) Forecast, by Application 2020 & 2033
- Table 70: Argentina Carbon Capture And Utilization Market Volume (Billion) Forecast, by Application 2020 & 2033
- Table 71: Rest of South America Carbon Capture And Utilization Market Revenue (Million) Forecast, by Application 2020 & 2033
- Table 72: Rest of South America Carbon Capture And Utilization Market Volume (Billion) Forecast, by Application 2020 & 2033
- Table 73: Global Carbon Capture And Utilization Market Revenue Million Forecast, by Service 2020 & 2033
- Table 74: Global Carbon Capture And Utilization Market Volume Billion Forecast, by Service 2020 & 2033
- Table 75: Global Carbon Capture And Utilization Market Revenue Million Forecast, by Technology 2020 & 2033
- Table 76: Global Carbon Capture And Utilization Market Volume Billion Forecast, by Technology 2020 & 2033
- Table 77: Global Carbon Capture And Utilization Market Revenue Million Forecast, by End User 2020 & 2033
- Table 78: Global Carbon Capture And Utilization Market Volume Billion Forecast, by End User 2020 & 2033
- Table 79: Global Carbon Capture And Utilization Market Revenue Million Forecast, by Country 2020 & 2033
- Table 80: Global Carbon Capture And Utilization Market Volume Billion Forecast, by Country 2020 & 2033
- Table 81: United Arab Emirates Carbon Capture And Utilization Market Revenue (Million) Forecast, by Application 2020 & 2033
- Table 82: United Arab Emirates Carbon Capture And Utilization Market Volume (Billion) Forecast, by Application 2020 & 2033
- Table 83: South Africa Carbon Capture And Utilization Market Revenue (Million) Forecast, by Application 2020 & 2033
- Table 84: South Africa Carbon Capture And Utilization Market Volume (Billion) Forecast, by Application 2020 & 2033
- Table 85: Rest of Middle East and Africa Carbon Capture And Utilization Market Revenue (Million) Forecast, by Application 2020 & 2033
- Table 86: Rest of Middle East and Africa Carbon Capture And Utilization Market Volume (Billion) Forecast, by Application 2020 & 2033
Frequently Asked Questions
1. What is the projected Compound Annual Growth Rate (CAGR) of the Carbon Capture And Utilization Market?
The projected CAGR is approximately 6.12%.
2. Which companies are prominent players in the Carbon Capture And Utilization Market?
Key companies in the market include ExxonMobil Corporation, Royal Dutch Shell PLC, Chevron Corporation, TotalEnergies SE, BP plc, Equinor ASA, Mitsubishi Heavy Industries Ltd, Air Products and Chemicals Inc, Aker Solutions ASA, Schlumberger Limited.
3. What are the main segments of the Carbon Capture And Utilization Market?
The market segments include Service, Technology, End User.
4. Can you provide details about the market size?
The market size is estimated to be USD 2.45 Million as of 2022.
5. What are some drivers contributing to market growth?
Environmental Regulations and Climate Change Goal; Growing Focuse on Reducing Co2 Emission.
6. What are the notable trends driving market growth?
Oil & Gas Industry was the Major End User in Market.
7. Are there any restraints impacting market growth?
Environmental Regulations and Climate Change Goal; Growing Focuse on Reducing Co2 Emission.
8. Can you provide examples of recent developments in the market?
April 2024: TotalEnergies, a prominent global energy firm, and Vanguard Renewables, a leading US player in converting organic farm waste into renewable natural gas (RNG), inked a deal. The agreement establishes a 50-50 joint venture, intending to develop, construct, and manage Farm Powered RNG initiatives across the United States. Vanguard Renewables, incidentally, is a portfolio company under BlackRock's Diversified Infrastructure business.February 2023: Aker Solutions confirmed signing the contract for the Draugen project with OKEA. The project is expected to reduce emissions by up to 200,000 tons of CO2 per year.
9. What pricing options are available for accessing the report?
Pricing options include single-user, multi-user, and enterprise licenses priced at USD 4750, USD 5250, and USD 8750 respectively.
10. Is the market size provided in terms of value or volume?
The market size is provided in terms of value, measured in Million and volume, measured in Billion.
11. Are there any specific market keywords associated with the report?
Yes, the market keyword associated with the report is "Carbon Capture And Utilization Market," which aids in identifying and referencing the specific market segment covered.
12. How do I determine which pricing option suits my needs best?
The pricing options vary based on user requirements and access needs. Individual users may opt for single-user licenses, while businesses requiring broader access may choose multi-user or enterprise licenses for cost-effective access to the report.
13. Are there any additional resources or data provided in the Carbon Capture And Utilization Market report?
While the report offers comprehensive insights, it's advisable to review the specific contents or supplementary materials provided to ascertain if additional resources or data are available.
14. How can I stay updated on further developments or reports in the Carbon Capture And Utilization Market?
To stay informed about further developments, trends, and reports in the Carbon Capture And Utilization Market, consider subscribing to industry newsletters, following relevant companies and organizations, or regularly checking reputable industry news sources and publications.
Methodology
Step 1 - Identification of Relevant Samples Size from Population Database


Step 2 - Approaches for Defining Global Market Size (Value, Volume* & Price*)

Note*: In applicable scenarios
Step 3 - Data Sources
Primary Research
- Web Analytics
- Survey Reports
- Research Institute
- Latest Research Reports
- Opinion Leaders
Secondary Research
- Annual Reports
- White Paper
- Latest Press Release
- Industry Association
- Paid Database
- Investor Presentations

Step 4 - Data Triangulation
Involves using different sources of information in order to increase the validity of a study
These sources are likely to be stakeholders in a program - participants, other researchers, program staff, other community members, and so on.
Then we put all data in single framework & apply various statistical tools to find out the dynamic on the market.
During the analysis stage, feedback from the stakeholder groups would be compared to determine areas of agreement as well as areas of divergence