

Key Insights
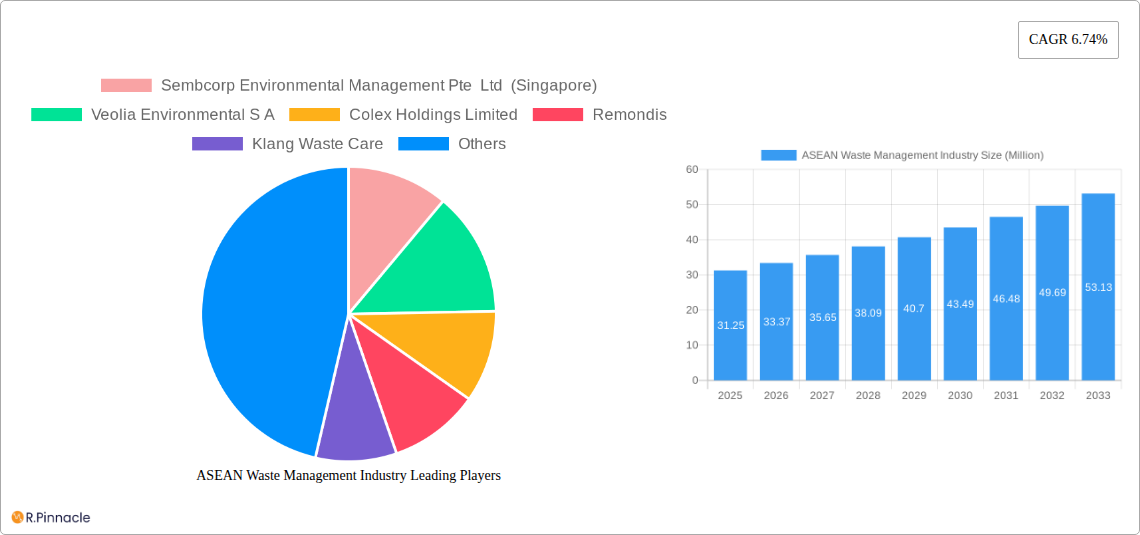
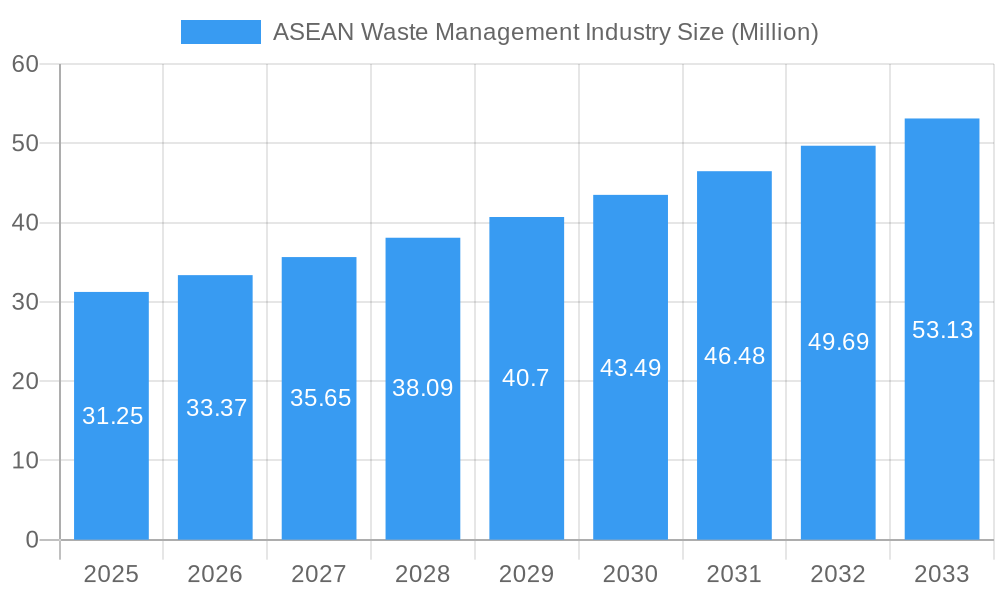
The ASEAN Waste Management Industry is poised for substantial growth, projected to reach an estimated market size of approximately USD 31.25 million by 2025, with a robust Compound Annual Growth Rate (CAGR) of 6.74% expected to persist through the forecast period of 2025-2033. This expansion is primarily fueled by escalating waste generation across diverse sectors, including industrial activities, burgeoning municipal solid waste, and the increasing challenge of electronic waste (e-waste). Growing environmental awareness, stringent government regulations aimed at sustainable waste disposal, and the proactive adoption of advanced waste management technologies are significant drivers propelling this market forward. Emerging trends such as the rise of circular economy principles, increased investment in waste-to-energy solutions, and the development of sophisticated recycling infrastructure are further shaping the industry's trajectory. These advancements are crucial in addressing the environmental impact of rapid urbanization and industrialization within the region.
ASEAN Waste Management Industry Market Size (In Million)
Despite this positive outlook, the industry faces certain restraints, including the high initial capital investment required for advanced waste management facilities, the logistical complexities associated with waste collection and transportation across geographically dispersed areas, and potential challenges in enforcing regulatory compliance uniformly across all member states. Nonetheless, the strategic importance of effective waste management in achieving sustainable development goals and enhancing public health in the ASEAN region underscores the market's resilience and growth potential. Key segments like industrial waste and municipal solid waste are expected to dominate, while innovative disposal methods like advanced recycling and waste-to-energy technologies will gain prominence. Geographically, Indonesia, Thailand, and Malaysia are anticipated to be leading markets, followed closely by Singapore and the rest of the ASEAN countries, reflecting varying levels of economic development and regulatory frameworks.
ASEAN Waste Management Industry Company Market Share
This in-depth report provides a definitive analysis of the ASEAN waste management industry, forecasting market growth and identifying key trends from 2019 to 2033. With a base year of 2025, this study offers actionable insights into the dynamic landscape of waste disposal, recycling, and resource recovery across Southeast Asia. Leveraging high-ranking keywords such as "ASEAN waste management," "industrial waste," "municipal solid waste," "e-waste recycling," and "sustainable waste solutions," this report is designed to equip industry professionals, investors, and policymakers with the critical information needed to navigate this rapidly evolving sector. Discover market segmentation, dominant regions, product innovations, growth drivers, challenges, and emerging opportunities that will shape the future of waste management in the ASEAN region.
ASEAN Waste Management Industry Market Structure & Innovation Trends
The ASEAN waste management industry exhibits a moderately concentrated market structure, driven by significant investments in infrastructure and technology. Key players are increasingly focusing on integrated waste management solutions, encompassing collection, treatment, and resource recovery. Innovation is a critical differentiator, with companies investing heavily in advanced sorting technologies, waste-to-energy (WTE) plants, and digital platforms for operational efficiency. Regulatory frameworks are becoming more stringent, pushing for circular economy principles and extended producer responsibility (EPR) schemes. While product substitutes are limited in core disposal methods, innovative recycling and upcycling initiatives are gaining traction. End-user demographics are shifting, with growing demand for environmentally responsible waste management from both industrial clients and a more environmentally conscious public. Mergers and acquisitions (M&A) activity is on the rise as larger players seek to consolidate market share and expand their service offerings. Estimated M&A deal values in the region are projected to reach several hundred million dollars annually, reflecting strategic consolidation. Market share for leading integrated waste management providers is estimated to range from 5% to 15%, with specialized service providers holding significant shares within niche segments.
ASEAN Waste Management Industry Market Dynamics & Trends
The ASEAN waste management industry is experiencing robust growth, driven by a confluence of factors. Rapid urbanization and industrialization across the region are leading to a significant increase in waste generation, particularly municipal solid waste and industrial waste. This escalating volume necessitates sophisticated and sustainable waste management solutions. Technological advancements are revolutionizing the sector, with the adoption of smart waste bins, automated sorting facilities, and advanced waste-to-energy technologies enhancing efficiency and reducing environmental impact. Increased environmental awareness among consumers and businesses is fostering a greater demand for recycling, composting, and other circular economy initiatives. Governments are actively promoting sustainable waste management practices through supportive policies, incentives, and stricter regulations, further accelerating market penetration. The competitive landscape is intensifying, characterized by both local and international players vying for market share. This dynamic environment encourages innovation and service diversification. The projected Compound Annual Growth Rate (CAGR) for the ASEAN waste management market is approximately 7% to 9% over the forecast period. Market penetration for advanced waste management solutions is steadily increasing, currently estimated at around 40-50% in major urban centers, with significant room for expansion. The growing adoption of digital solutions for waste tracking and management is a prominent trend, optimizing logistics and providing valuable data insights.
Dominant Regions & Segments in ASEAN Waste Management Industry
Indonesia currently leads the ASEAN waste management industry, driven by its large population, expanding industrial base, and increasing focus on environmental sustainability. Government initiatives aimed at improving waste infrastructure and promoting circular economy practices are key economic policies supporting this dominance. The country's vast geographical spread also presents unique logistical challenges and opportunities.
- Key Drivers for Indonesian Dominance:
- Massive population generating significant municipal solid waste.
- Growth of manufacturing and industrial sectors, leading to higher industrial waste volumes.
- Government commitment to waste reduction and recycling targets.
- Increasing investment in modern waste treatment facilities and WTE plants.
Industrial waste is a dominant segment due to the burgeoning manufacturing and processing industries across Southeast Asia. This waste stream often requires specialized handling and treatment due to its hazardous nature, driving demand for advanced disposal methods.
- Key Drivers for Industrial Waste Dominance:
- Robust manufacturing output and export-oriented industries.
- Stringent regulations for hazardous waste management.
- Adoption of cleaner production technologies by industries.
- Growing focus on resource recovery from industrial by-products.
Collection remains the most fundamental and widely adopted disposal method, underpinning the entire waste management value chain. Efficient and widespread collection networks are crucial for managing the sheer volume of waste generated.
- Key Drivers for Collection Dominance:
- Essential first step for all waste management processes.
- Government mandates for regular waste collection services.
- Technological improvements in collection vehicles and route optimization.
- Expansion of collection services to underserved urban and rural areas.
E-waste is an increasingly significant segment, driven by the rapid adoption of electronic devices and shorter product lifecycles. Proper e-waste management is critical due to the presence of hazardous materials and the valuable potential for resource recovery.
- Key Drivers for E-waste Growth:
- High consumer electronics penetration and rapid technological obsolescence.
- Growing awareness of the environmental and health risks associated with improper e-waste disposal.
- Implementation of Extended Producer Responsibility (EPR) schemes for electronics.
- Development of specialized e-waste recycling facilities.
Singapore demonstrates a high level of sophistication in its waste management infrastructure and regulatory framework, making it a benchmark for advanced waste solutions. Its focus on technological innovation and resource recovery sets it apart.
- Key Drivers for Singapore's Advanced Systems:
- Limited land availability necessitating efficient waste treatment and recycling.
- Strong government policies and public engagement in waste reduction.
- High adoption rates of WTE and advanced recycling technologies.
- Robust R&D in waste management innovation.
ASEAN Waste Management Industry Product Innovations
Recent product innovations in the ASEAN waste management industry are focused on enhancing efficiency, sustainability, and resource recovery. Advanced sorting technologies, including AI-powered optical sorters and robotic systems, are revolutionizing the separation of recyclable materials from mixed waste streams. The development of more efficient and cleaner waste-to-energy (WTE) plants, utilizing advanced combustion and emission control technologies, is a significant trend. Innovations in plastic recycling, such as chemical recycling and advanced mechanical recycling, are enabling the recovery of higher-value materials. Furthermore, digital platforms and IoT solutions are being integrated for smart waste collection, route optimization, and real-time monitoring, leading to significant operational cost savings and environmental benefits. These innovations provide competitive advantages by reducing landfill dependence, maximizing resource utilization, and meeting stringent environmental regulations.
Report Scope & Segmentation Analysis
This report meticulously segments the ASEAN waste management industry by Waste Type, encompassing Industrial Waste, Municipal Solid Waste, E-waste, and Other Waste Types (including medical waste and construction debris). For each, we project market sizes and competitive dynamics, with industrial waste expected to hold the largest share due to regional manufacturing growth, while e-waste shows the highest growth potential. The analysis further categorizes the industry by Disposal Methods, including Collection, Landfill, and Others (comprising recycling, incineration, WTE, and composting). Collection is the foundational segment, while 'Others' represents the fastest-growing area driven by sustainability initiatives. Geographically, the report covers Indonesia, Thailand, Malaysia, Singapore, and the Rest of ASEAN, detailing their unique market characteristics and growth projections. Indonesia and the Rest of ASEAN are projected to exhibit the highest growth rates due to developing infrastructure and increasing waste volumes.
Key Drivers of ASEAN Waste Management Industry Growth
The ASEAN waste management industry's growth is propelled by several interconnected factors. Rapid economic development and population expansion are leading to escalating waste generation, creating an urgent need for effective disposal and recycling solutions. Governments across the region are increasingly implementing stringent environmental regulations and promoting circular economy principles, incentivizing investments in sustainable waste management practices. Technological advancements, such as smart waste management systems, advanced sorting technologies, and waste-to-energy solutions, are enhancing operational efficiency and resource recovery, making waste management more economically viable and environmentally friendly. Growing public awareness and demand for sustainable living are also driving consumer and corporate preference for eco-conscious waste management services.
Challenges in the ASEAN Waste Management Industry Sector
Despite robust growth, the ASEAN waste management sector faces significant challenges. Inadequate infrastructure, particularly in less developed regions, hinders efficient waste collection and treatment. Regulatory enforcement can be inconsistent, leading to compliance gaps and the persistence of informal waste disposal practices. The high initial capital investment required for advanced waste management technologies and facilities poses a barrier for many operators. Supply chain complexities in managing the collection and processing of diverse waste streams, especially hazardous materials, require sophisticated logistics. Furthermore, fluctuating commodity prices for recycled materials can impact the economic viability of recycling operations. Competitive pressures from established players and the informal sector can also challenge new entrants.
Emerging Opportunities in ASEAN Waste Management Industry
Emerging opportunities in the ASEAN waste management industry are centered around innovation and sustainability. The burgeoning demand for circular economy solutions, including advanced plastic recycling and upcycling initiatives, presents substantial growth potential. The increasing focus on managing specific waste streams like electronic waste (e-waste) and healthcare waste, due to their hazardous nature and valuable material content, offers specialized market niches. The development and adoption of smart waste management technologies, leveraging IoT and AI for optimized collection and data analytics, are creating opportunities for efficiency gains and new service models. Furthermore, the expansion of waste-to-energy projects, particularly in densely populated urban areas, offers a viable solution for both waste reduction and renewable energy generation. Growing investor interest in sustainable and ESG-compliant businesses is also channeling more capital into innovative waste management ventures.
Leading Players in the ASEAN Waste Management Industry Market
- Sembcorp Environmental Management Pte Ltd
- Veolia Environmental S A
- Colex Holdings Limited
- Remondis
- Klang Waste Care
- Starpal Pte Ltd
- Blue Planet Environmental Solutions
- Greenway Environmental
- PT Prasadha Pamunah Limbah Industri - PPLI
- Boon Poh Refuse Disposal Pte Ltd
- Suez Environment
- Earth Recycling Services Ltd
- ALBA Group Asia
- Se Cure Waste Management
Key Developments in ASEAN Waste Management Industry Industry
- December 2022: A cooperative venture called Rebottle between Singapore Polytechnic (SP) and SembWaste, a fully owned subsidiary of Sembcorp Industries (Sembcorp) intends to increase the amount of PET bottles that are recycled in Singapore, beginning with the Punggol Shore area.
- June 2022: The introduction of a representative office in the Wijayakusuma Industrial Area was conducted on Thursday, June 30, 2022, making it a significant day in the history of PT Prasadha Pamunah Waste Industries (PPLI). The Wijayakusuma Industrial Estate's management, PT KIW, has leased space to the newly established PT PPLI representative office (Persero). Selling land for industrial usage, renting Ready-to-Use Factory Buildings (BPSP), and leasing space for offices are all part of PT KIW's primary business. The PT PPLI-DESI representative office will be opened with the intention of being a dependable partner for businesses, the Indonesian government, and other stakeholders, and contributing to Indonesia's economic and environmental growth.
Future Outlook for ASEAN Waste Management Industry Market
The ASEAN waste management industry is poised for continued strong growth and transformation. The increasing adoption of circular economy principles will drive further innovation in recycling, upcycling, and resource recovery technologies, moving beyond traditional disposal methods. Smart waste management solutions, powered by IoT and AI, will become more prevalent, optimizing operational efficiency and providing valuable data analytics for better decision-making. Governments are expected to implement even more robust environmental policies and enforce stricter regulations, creating a favorable investment climate for sustainable waste management practices. Emerging markets within the ASEAN region will see significant infrastructure development, presenting substantial opportunities for both established and new players. The growing global emphasis on ESG (Environmental, Social, and Governance) investing will also channel more capital into the sector, supporting the development of advanced, environmentally responsible waste management solutions.
ASEAN Waste Management Industry Segmentation
-
1. Waste type
- 1.1. Industrial waste
- 1.2. Municipal solid waste
- 1.3. E-waste
- 1.4. Other Waste types
-
2. Disposal methods
- 2.1. Collection
- 2.2. Landfill
- 2.3. Others
-
3. Geography
- 3.1. Indonesia
- 3.2. Thailand
- 3.3. Malaysia
- 3.4. Singapore
- 3.5. Rest of ASEAN
ASEAN Waste Management Industry Segmentation By Geography
- 1. Indonesia
- 2. Thailand
- 3. Malaysia
- 4. Singapore
- 5. Rest of ASEAN
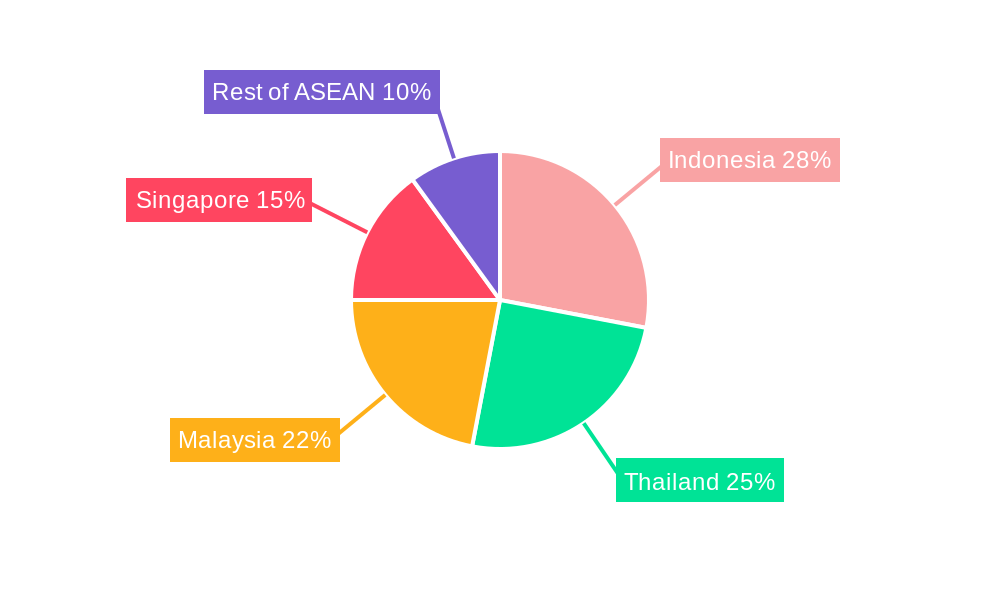
ASEAN Waste Management Industry Regional Market Share
Geographic Coverage of ASEAN Waste Management Industry
ASEAN Waste Management Industry REPORT HIGHLIGHTS
| Aspects | Details |
|---|---|
| Study Period | 2020-2034 |
| Base Year | 2025 |
| Estimated Year | 2026 |
| Forecast Period | 2026-2034 |
| Historical Period | 2020-2025 |
| Growth Rate | CAGR of 6.74% from 2020-2034 |
| Segmentation |
|
Table of Contents
- 1. Introduction
- 1.1. Research Scope
- 1.2. Market Segmentation
- 1.3. Research Objective
- 1.4. Definitions and Assumptions
- 2. Executive Summary
- 2.1. Market Snapshot
- 3. Market Dynamics
- 3.1. Market Drivers
- 3.2. Market Restrains
- 3.3. Market Trends
- 3.4. Market Opportunities
- 4. Market Factor Analysis
- 4.1. Porters Five Forces
- 4.1.1. Bargaining Power of Suppliers
- 4.1.2. Bargaining Power of Buyers
- 4.1.3. Threat of New Entrants
- 4.1.4. Threat of Substitutes
- 4.1.5. Competitive Rivalry
- 4.2. PESTEL analysis
- 4.3. BCG Analysis
- 4.3.1. Stars (High Growth, High Market Share)
- 4.3.2. Cash Cows (Low Growth, High Market Share)
- 4.3.3. Question Mark (High Growth, Low Market Share)
- 4.3.4. Dogs (Low Growth, Low Market Share)
- 4.4. Ansoff Matrix Analysis
- 4.5. Supply Chain Analysis
- 4.6. Regulatory Landscape
- 4.7. Current Market Potential and Opportunity Assessment (TAM–SAM–SOM Framework)
- 4.8. PRI Analyst Note
- 4.1. Porters Five Forces
- 5. Market Analysis, Insights and Forecast 2021-2033
- 5.1. Market Analysis, Insights and Forecast - by Waste type
- 5.1.1. Industrial waste
- 5.1.2. Municipal solid waste
- 5.1.3. E-waste
- 5.1.4. Other Waste types
- 5.2. Market Analysis, Insights and Forecast - by Disposal methods
- 5.2.1. Collection
- 5.2.2. Landfill
- 5.2.3. Others
- 5.3. Market Analysis, Insights and Forecast - by Geography
- 5.3.1. Indonesia
- 5.3.2. Thailand
- 5.3.3. Malaysia
- 5.3.4. Singapore
- 5.3.5. Rest of ASEAN
- 5.4. Market Analysis, Insights and Forecast - by Region
- 5.4.1. Indonesia
- 5.4.2. Thailand
- 5.4.3. Malaysia
- 5.4.4. Singapore
- 5.4.5. Rest of ASEAN
- 5.1. Market Analysis, Insights and Forecast - by Waste type
- 6. Global ASEAN Waste Management Industry Analysis, Insights and Forecast, 2021-2033
- 6.1. Market Analysis, Insights and Forecast - by Waste type
- 6.1.1. Industrial waste
- 6.1.2. Municipal solid waste
- 6.1.3. E-waste
- 6.1.4. Other Waste types
- 6.2. Market Analysis, Insights and Forecast - by Disposal methods
- 6.2.1. Collection
- 6.2.2. Landfill
- 6.2.3. Others
- 6.3. Market Analysis, Insights and Forecast - by Geography
- 6.3.1. Indonesia
- 6.3.2. Thailand
- 6.3.3. Malaysia
- 6.3.4. Singapore
- 6.3.5. Rest of ASEAN
- 6.1. Market Analysis, Insights and Forecast - by Waste type
- 7. Indonesia ASEAN Waste Management Industry Analysis, Insights and Forecast, 2020-2032
- 7.1. Market Analysis, Insights and Forecast - by Waste type
- 7.1.1. Industrial waste
- 7.1.2. Municipal solid waste
- 7.1.3. E-waste
- 7.1.4. Other Waste types
- 7.2. Market Analysis, Insights and Forecast - by Disposal methods
- 7.2.1. Collection
- 7.2.2. Landfill
- 7.2.3. Others
- 7.3. Market Analysis, Insights and Forecast - by Geography
- 7.3.1. Indonesia
- 7.3.2. Thailand
- 7.3.3. Malaysia
- 7.3.4. Singapore
- 7.3.5. Rest of ASEAN
- 7.1. Market Analysis, Insights and Forecast - by Waste type
- 8. Thailand ASEAN Waste Management Industry Analysis, Insights and Forecast, 2020-2032
- 8.1. Market Analysis, Insights and Forecast - by Waste type
- 8.1.1. Industrial waste
- 8.1.2. Municipal solid waste
- 8.1.3. E-waste
- 8.1.4. Other Waste types
- 8.2. Market Analysis, Insights and Forecast - by Disposal methods
- 8.2.1. Collection
- 8.2.2. Landfill
- 8.2.3. Others
- 8.3. Market Analysis, Insights and Forecast - by Geography
- 8.3.1. Indonesia
- 8.3.2. Thailand
- 8.3.3. Malaysia
- 8.3.4. Singapore
- 8.3.5. Rest of ASEAN
- 8.1. Market Analysis, Insights and Forecast - by Waste type
- 9. Malaysia ASEAN Waste Management Industry Analysis, Insights and Forecast, 2020-2032
- 9.1. Market Analysis, Insights and Forecast - by Waste type
- 9.1.1. Industrial waste
- 9.1.2. Municipal solid waste
- 9.1.3. E-waste
- 9.1.4. Other Waste types
- 9.2. Market Analysis, Insights and Forecast - by Disposal methods
- 9.2.1. Collection
- 9.2.2. Landfill
- 9.2.3. Others
- 9.3. Market Analysis, Insights and Forecast - by Geography
- 9.3.1. Indonesia
- 9.3.2. Thailand
- 9.3.3. Malaysia
- 9.3.4. Singapore
- 9.3.5. Rest of ASEAN
- 9.1. Market Analysis, Insights and Forecast - by Waste type
- 10. Singapore ASEAN Waste Management Industry Analysis, Insights and Forecast, 2020-2032
- 10.1. Market Analysis, Insights and Forecast - by Waste type
- 10.1.1. Industrial waste
- 10.1.2. Municipal solid waste
- 10.1.3. E-waste
- 10.1.4. Other Waste types
- 10.2. Market Analysis, Insights and Forecast - by Disposal methods
- 10.2.1. Collection
- 10.2.2. Landfill
- 10.2.3. Others
- 10.3. Market Analysis, Insights and Forecast - by Geography
- 10.3.1. Indonesia
- 10.3.2. Thailand
- 10.3.3. Malaysia
- 10.3.4. Singapore
- 10.3.5. Rest of ASEAN
- 10.1. Market Analysis, Insights and Forecast - by Waste type
- 11. Rest of ASEAN ASEAN Waste Management Industry Analysis, Insights and Forecast, 2020-2032
- 11.1. Market Analysis, Insights and Forecast - by Waste type
- 11.1.1. Industrial waste
- 11.1.2. Municipal solid waste
- 11.1.3. E-waste
- 11.1.4. Other Waste types
- 11.2. Market Analysis, Insights and Forecast - by Disposal methods
- 11.2.1. Collection
- 11.2.2. Landfill
- 11.2.3. Others
- 11.3. Market Analysis, Insights and Forecast - by Geography
- 11.3.1. Indonesia
- 11.3.2. Thailand
- 11.3.3. Malaysia
- 11.3.4. Singapore
- 11.3.5. Rest of ASEAN
- 11.1. Market Analysis, Insights and Forecast - by Waste type
- 12. Competitive Analysis
- 12.1. Company Profiles
- 12.1.1 Sembcorp Environmental Management Pte Ltd (Singapore)
- 12.1.1.1. Company Overview
- 12.1.1.2. Products
- 12.1.1.3. Company Financials
- 12.1.1.4. SWOT Analysis
- 12.1.2 Veolia Environmental S A
- 12.1.2.1. Company Overview
- 12.1.2.2. Products
- 12.1.2.3. Company Financials
- 12.1.2.4. SWOT Analysis
- 12.1.3 Colex Holdings Limited
- 12.1.3.1. Company Overview
- 12.1.3.2. Products
- 12.1.3.3. Company Financials
- 12.1.3.4. SWOT Analysis
- 12.1.4 Remondis
- 12.1.4.1. Company Overview
- 12.1.4.2. Products
- 12.1.4.3. Company Financials
- 12.1.4.4. SWOT Analysis
- 12.1.5 Klang Waste Care
- 12.1.5.1. Company Overview
- 12.1.5.2. Products
- 12.1.5.3. Company Financials
- 12.1.5.4. SWOT Analysis
- 12.1.6 Starpal Pte Ltd
- 12.1.6.1. Company Overview
- 12.1.6.2. Products
- 12.1.6.3. Company Financials
- 12.1.6.4. SWOT Analysis
- 12.1.7 Blue Planet Environmental Solutions
- 12.1.7.1. Company Overview
- 12.1.7.2. Products
- 12.1.7.3. Company Financials
- 12.1.7.4. SWOT Analysis
- 12.1.8 Greenway Environmental
- 12.1.8.1. Company Overview
- 12.1.8.2. Products
- 12.1.8.3. Company Financials
- 12.1.8.4. SWOT Analysis
- 12.1.9 PT Prasadha Pamunah Limbah Industri - PPLI
- 12.1.9.1. Company Overview
- 12.1.9.2. Products
- 12.1.9.3. Company Financials
- 12.1.9.4. SWOT Analysis
- 12.1.10 Boon Poh Refuse Disposal Pte Ltd
- 12.1.10.1. Company Overview
- 12.1.10.2. Products
- 12.1.10.3. Company Financials
- 12.1.10.4. SWOT Analysis
- 12.1.11 Suez Environment
- 12.1.11.1. Company Overview
- 12.1.11.2. Products
- 12.1.11.3. Company Financials
- 12.1.11.4. SWOT Analysis
- 12.1.12 Earth Recycling Services Ltd
- 12.1.12.1. Company Overview
- 12.1.12.2. Products
- 12.1.12.3. Company Financials
- 12.1.12.4. SWOT Analysis
- 12.1.13 ALBA Group Asia
- 12.1.13.1. Company Overview
- 12.1.13.2. Products
- 12.1.13.3. Company Financials
- 12.1.13.4. SWOT Analysis
- 12.1.14 Se Cure Waste Management**List Not Exhaustive
- 12.1.14.1. Company Overview
- 12.1.14.2. Products
- 12.1.14.3. Company Financials
- 12.1.14.4. SWOT Analysis
- 12.1.1 Sembcorp Environmental Management Pte Ltd (Singapore)
- 12.2. Market Entropy
- 12.2.1 Company's Key Areas Served
- 12.2.2 Recent Developments
- 12.3. Company Market Share Analysis 2025
- 12.3.1 Top 5 Companies Market Share Analysis
- 12.3.2 Top 3 Companies Market Share Analysis
- 12.4. List of Potential Customers
- 13. Research Methodology
List of Figures
- Figure 1: Global ASEAN Waste Management Industry Revenue Breakdown (Million, %) by Region 2025 & 2033
- Figure 2: Global ASEAN Waste Management Industry Volume Breakdown (Billion, %) by Region 2025 & 2033
- Figure 3: Indonesia ASEAN Waste Management Industry Revenue (Million), by Waste type 2025 & 2033
- Figure 4: Indonesia ASEAN Waste Management Industry Volume (Billion), by Waste type 2025 & 2033
- Figure 5: Indonesia ASEAN Waste Management Industry Revenue Share (%), by Waste type 2025 & 2033
- Figure 6: Indonesia ASEAN Waste Management Industry Volume Share (%), by Waste type 2025 & 2033
- Figure 7: Indonesia ASEAN Waste Management Industry Revenue (Million), by Disposal methods 2025 & 2033
- Figure 8: Indonesia ASEAN Waste Management Industry Volume (Billion), by Disposal methods 2025 & 2033
- Figure 9: Indonesia ASEAN Waste Management Industry Revenue Share (%), by Disposal methods 2025 & 2033
- Figure 10: Indonesia ASEAN Waste Management Industry Volume Share (%), by Disposal methods 2025 & 2033
- Figure 11: Indonesia ASEAN Waste Management Industry Revenue (Million), by Geography 2025 & 2033
- Figure 12: Indonesia ASEAN Waste Management Industry Volume (Billion), by Geography 2025 & 2033
- Figure 13: Indonesia ASEAN Waste Management Industry Revenue Share (%), by Geography 2025 & 2033
- Figure 14: Indonesia ASEAN Waste Management Industry Volume Share (%), by Geography 2025 & 2033
- Figure 15: Indonesia ASEAN Waste Management Industry Revenue (Million), by Country 2025 & 2033
- Figure 16: Indonesia ASEAN Waste Management Industry Volume (Billion), by Country 2025 & 2033
- Figure 17: Indonesia ASEAN Waste Management Industry Revenue Share (%), by Country 2025 & 2033
- Figure 18: Indonesia ASEAN Waste Management Industry Volume Share (%), by Country 2025 & 2033
- Figure 19: Thailand ASEAN Waste Management Industry Revenue (Million), by Waste type 2025 & 2033
- Figure 20: Thailand ASEAN Waste Management Industry Volume (Billion), by Waste type 2025 & 2033
- Figure 21: Thailand ASEAN Waste Management Industry Revenue Share (%), by Waste type 2025 & 2033
- Figure 22: Thailand ASEAN Waste Management Industry Volume Share (%), by Waste type 2025 & 2033
- Figure 23: Thailand ASEAN Waste Management Industry Revenue (Million), by Disposal methods 2025 & 2033
- Figure 24: Thailand ASEAN Waste Management Industry Volume (Billion), by Disposal methods 2025 & 2033
- Figure 25: Thailand ASEAN Waste Management Industry Revenue Share (%), by Disposal methods 2025 & 2033
- Figure 26: Thailand ASEAN Waste Management Industry Volume Share (%), by Disposal methods 2025 & 2033
- Figure 27: Thailand ASEAN Waste Management Industry Revenue (Million), by Geography 2025 & 2033
- Figure 28: Thailand ASEAN Waste Management Industry Volume (Billion), by Geography 2025 & 2033
- Figure 29: Thailand ASEAN Waste Management Industry Revenue Share (%), by Geography 2025 & 2033
- Figure 30: Thailand ASEAN Waste Management Industry Volume Share (%), by Geography 2025 & 2033
- Figure 31: Thailand ASEAN Waste Management Industry Revenue (Million), by Country 2025 & 2033
- Figure 32: Thailand ASEAN Waste Management Industry Volume (Billion), by Country 2025 & 2033
- Figure 33: Thailand ASEAN Waste Management Industry Revenue Share (%), by Country 2025 & 2033
- Figure 34: Thailand ASEAN Waste Management Industry Volume Share (%), by Country 2025 & 2033
- Figure 35: Malaysia ASEAN Waste Management Industry Revenue (Million), by Waste type 2025 & 2033
- Figure 36: Malaysia ASEAN Waste Management Industry Volume (Billion), by Waste type 2025 & 2033
- Figure 37: Malaysia ASEAN Waste Management Industry Revenue Share (%), by Waste type 2025 & 2033
- Figure 38: Malaysia ASEAN Waste Management Industry Volume Share (%), by Waste type 2025 & 2033
- Figure 39: Malaysia ASEAN Waste Management Industry Revenue (Million), by Disposal methods 2025 & 2033
- Figure 40: Malaysia ASEAN Waste Management Industry Volume (Billion), by Disposal methods 2025 & 2033
- Figure 41: Malaysia ASEAN Waste Management Industry Revenue Share (%), by Disposal methods 2025 & 2033
- Figure 42: Malaysia ASEAN Waste Management Industry Volume Share (%), by Disposal methods 2025 & 2033
- Figure 43: Malaysia ASEAN Waste Management Industry Revenue (Million), by Geography 2025 & 2033
- Figure 44: Malaysia ASEAN Waste Management Industry Volume (Billion), by Geography 2025 & 2033
- Figure 45: Malaysia ASEAN Waste Management Industry Revenue Share (%), by Geography 2025 & 2033
- Figure 46: Malaysia ASEAN Waste Management Industry Volume Share (%), by Geography 2025 & 2033
- Figure 47: Malaysia ASEAN Waste Management Industry Revenue (Million), by Country 2025 & 2033
- Figure 48: Malaysia ASEAN Waste Management Industry Volume (Billion), by Country 2025 & 2033
- Figure 49: Malaysia ASEAN Waste Management Industry Revenue Share (%), by Country 2025 & 2033
- Figure 50: Malaysia ASEAN Waste Management Industry Volume Share (%), by Country 2025 & 2033
- Figure 51: Singapore ASEAN Waste Management Industry Revenue (Million), by Waste type 2025 & 2033
- Figure 52: Singapore ASEAN Waste Management Industry Volume (Billion), by Waste type 2025 & 2033
- Figure 53: Singapore ASEAN Waste Management Industry Revenue Share (%), by Waste type 2025 & 2033
- Figure 54: Singapore ASEAN Waste Management Industry Volume Share (%), by Waste type 2025 & 2033
- Figure 55: Singapore ASEAN Waste Management Industry Revenue (Million), by Disposal methods 2025 & 2033
- Figure 56: Singapore ASEAN Waste Management Industry Volume (Billion), by Disposal methods 2025 & 2033
- Figure 57: Singapore ASEAN Waste Management Industry Revenue Share (%), by Disposal methods 2025 & 2033
- Figure 58: Singapore ASEAN Waste Management Industry Volume Share (%), by Disposal methods 2025 & 2033
- Figure 59: Singapore ASEAN Waste Management Industry Revenue (Million), by Geography 2025 & 2033
- Figure 60: Singapore ASEAN Waste Management Industry Volume (Billion), by Geography 2025 & 2033
- Figure 61: Singapore ASEAN Waste Management Industry Revenue Share (%), by Geography 2025 & 2033
- Figure 62: Singapore ASEAN Waste Management Industry Volume Share (%), by Geography 2025 & 2033
- Figure 63: Singapore ASEAN Waste Management Industry Revenue (Million), by Country 2025 & 2033
- Figure 64: Singapore ASEAN Waste Management Industry Volume (Billion), by Country 2025 & 2033
- Figure 65: Singapore ASEAN Waste Management Industry Revenue Share (%), by Country 2025 & 2033
- Figure 66: Singapore ASEAN Waste Management Industry Volume Share (%), by Country 2025 & 2033
- Figure 67: Rest of ASEAN ASEAN Waste Management Industry Revenue (Million), by Waste type 2025 & 2033
- Figure 68: Rest of ASEAN ASEAN Waste Management Industry Volume (Billion), by Waste type 2025 & 2033
- Figure 69: Rest of ASEAN ASEAN Waste Management Industry Revenue Share (%), by Waste type 2025 & 2033
- Figure 70: Rest of ASEAN ASEAN Waste Management Industry Volume Share (%), by Waste type 2025 & 2033
- Figure 71: Rest of ASEAN ASEAN Waste Management Industry Revenue (Million), by Disposal methods 2025 & 2033
- Figure 72: Rest of ASEAN ASEAN Waste Management Industry Volume (Billion), by Disposal methods 2025 & 2033
- Figure 73: Rest of ASEAN ASEAN Waste Management Industry Revenue Share (%), by Disposal methods 2025 & 2033
- Figure 74: Rest of ASEAN ASEAN Waste Management Industry Volume Share (%), by Disposal methods 2025 & 2033
- Figure 75: Rest of ASEAN ASEAN Waste Management Industry Revenue (Million), by Geography 2025 & 2033
- Figure 76: Rest of ASEAN ASEAN Waste Management Industry Volume (Billion), by Geography 2025 & 2033
- Figure 77: Rest of ASEAN ASEAN Waste Management Industry Revenue Share (%), by Geography 2025 & 2033
- Figure 78: Rest of ASEAN ASEAN Waste Management Industry Volume Share (%), by Geography 2025 & 2033
- Figure 79: Rest of ASEAN ASEAN Waste Management Industry Revenue (Million), by Country 2025 & 2033
- Figure 80: Rest of ASEAN ASEAN Waste Management Industry Volume (Billion), by Country 2025 & 2033
- Figure 81: Rest of ASEAN ASEAN Waste Management Industry Revenue Share (%), by Country 2025 & 2033
- Figure 82: Rest of ASEAN ASEAN Waste Management Industry Volume Share (%), by Country 2025 & 2033
List of Tables
- Table 1: Global ASEAN Waste Management Industry Revenue Million Forecast, by Waste type 2020 & 2033
- Table 2: Global ASEAN Waste Management Industry Volume Billion Forecast, by Waste type 2020 & 2033
- Table 3: Global ASEAN Waste Management Industry Revenue Million Forecast, by Disposal methods 2020 & 2033
- Table 4: Global ASEAN Waste Management Industry Volume Billion Forecast, by Disposal methods 2020 & 2033
- Table 5: Global ASEAN Waste Management Industry Revenue Million Forecast, by Geography 2020 & 2033
- Table 6: Global ASEAN Waste Management Industry Volume Billion Forecast, by Geography 2020 & 2033
- Table 7: Global ASEAN Waste Management Industry Revenue Million Forecast, by Region 2020 & 2033
- Table 8: Global ASEAN Waste Management Industry Volume Billion Forecast, by Region 2020 & 2033
- Table 9: Global ASEAN Waste Management Industry Revenue Million Forecast, by Waste type 2020 & 2033
- Table 10: Global ASEAN Waste Management Industry Volume Billion Forecast, by Waste type 2020 & 2033
- Table 11: Global ASEAN Waste Management Industry Revenue Million Forecast, by Disposal methods 2020 & 2033
- Table 12: Global ASEAN Waste Management Industry Volume Billion Forecast, by Disposal methods 2020 & 2033
- Table 13: Global ASEAN Waste Management Industry Revenue Million Forecast, by Geography 2020 & 2033
- Table 14: Global ASEAN Waste Management Industry Volume Billion Forecast, by Geography 2020 & 2033
- Table 15: Global ASEAN Waste Management Industry Revenue Million Forecast, by Country 2020 & 2033
- Table 16: Global ASEAN Waste Management Industry Volume Billion Forecast, by Country 2020 & 2033
- Table 17: Global ASEAN Waste Management Industry Revenue Million Forecast, by Waste type 2020 & 2033
- Table 18: Global ASEAN Waste Management Industry Volume Billion Forecast, by Waste type 2020 & 2033
- Table 19: Global ASEAN Waste Management Industry Revenue Million Forecast, by Disposal methods 2020 & 2033
- Table 20: Global ASEAN Waste Management Industry Volume Billion Forecast, by Disposal methods 2020 & 2033
- Table 21: Global ASEAN Waste Management Industry Revenue Million Forecast, by Geography 2020 & 2033
- Table 22: Global ASEAN Waste Management Industry Volume Billion Forecast, by Geography 2020 & 2033
- Table 23: Global ASEAN Waste Management Industry Revenue Million Forecast, by Country 2020 & 2033
- Table 24: Global ASEAN Waste Management Industry Volume Billion Forecast, by Country 2020 & 2033
- Table 25: Global ASEAN Waste Management Industry Revenue Million Forecast, by Waste type 2020 & 2033
- Table 26: Global ASEAN Waste Management Industry Volume Billion Forecast, by Waste type 2020 & 2033
- Table 27: Global ASEAN Waste Management Industry Revenue Million Forecast, by Disposal methods 2020 & 2033
- Table 28: Global ASEAN Waste Management Industry Volume Billion Forecast, by Disposal methods 2020 & 2033
- Table 29: Global ASEAN Waste Management Industry Revenue Million Forecast, by Geography 2020 & 2033
- Table 30: Global ASEAN Waste Management Industry Volume Billion Forecast, by Geography 2020 & 2033
- Table 31: Global ASEAN Waste Management Industry Revenue Million Forecast, by Country 2020 & 2033
- Table 32: Global ASEAN Waste Management Industry Volume Billion Forecast, by Country 2020 & 2033
- Table 33: Global ASEAN Waste Management Industry Revenue Million Forecast, by Waste type 2020 & 2033
- Table 34: Global ASEAN Waste Management Industry Volume Billion Forecast, by Waste type 2020 & 2033
- Table 35: Global ASEAN Waste Management Industry Revenue Million Forecast, by Disposal methods 2020 & 2033
- Table 36: Global ASEAN Waste Management Industry Volume Billion Forecast, by Disposal methods 2020 & 2033
- Table 37: Global ASEAN Waste Management Industry Revenue Million Forecast, by Geography 2020 & 2033
- Table 38: Global ASEAN Waste Management Industry Volume Billion Forecast, by Geography 2020 & 2033
- Table 39: Global ASEAN Waste Management Industry Revenue Million Forecast, by Country 2020 & 2033
- Table 40: Global ASEAN Waste Management Industry Volume Billion Forecast, by Country 2020 & 2033
- Table 41: Global ASEAN Waste Management Industry Revenue Million Forecast, by Waste type 2020 & 2033
- Table 42: Global ASEAN Waste Management Industry Volume Billion Forecast, by Waste type 2020 & 2033
- Table 43: Global ASEAN Waste Management Industry Revenue Million Forecast, by Disposal methods 2020 & 2033
- Table 44: Global ASEAN Waste Management Industry Volume Billion Forecast, by Disposal methods 2020 & 2033
- Table 45: Global ASEAN Waste Management Industry Revenue Million Forecast, by Geography 2020 & 2033
- Table 46: Global ASEAN Waste Management Industry Volume Billion Forecast, by Geography 2020 & 2033
- Table 47: Global ASEAN Waste Management Industry Revenue Million Forecast, by Country 2020 & 2033
- Table 48: Global ASEAN Waste Management Industry Volume Billion Forecast, by Country 2020 & 2033
Frequently Asked Questions
1. What is the projected Compound Annual Growth Rate (CAGR) of the ASEAN Waste Management Industry?
The projected CAGR is approximately 6.74%.
2. Which companies are prominent players in the ASEAN Waste Management Industry?
Key companies in the market include Sembcorp Environmental Management Pte Ltd (Singapore), Veolia Environmental S A, Colex Holdings Limited, Remondis, Klang Waste Care, Starpal Pte Ltd, Blue Planet Environmental Solutions, Greenway Environmental, PT Prasadha Pamunah Limbah Industri - PPLI, Boon Poh Refuse Disposal Pte Ltd, Suez Environment, Earth Recycling Services Ltd, ALBA Group Asia, Se Cure Waste Management**List Not Exhaustive.
3. What are the main segments of the ASEAN Waste Management Industry?
The market segments include Waste type, Disposal methods, Geography.
4. Can you provide details about the market size?
The market size is estimated to be USD 31.25 Million as of 2022.
5. What are some drivers contributing to market growth?
N/A
6. What are the notable trends driving market growth?
Indonesia Advances Zero-Plastic Waste Ambitions with Public-Private Partnership to Build Waste Management Capacity and Capability.
7. Are there any restraints impacting market growth?
N/A
8. Can you provide examples of recent developments in the market?
December 2022: A cooperative venture called Rebottle between Singapore Polytechnic (SP) and SembWaste, a fully owned subsidiary of Sembcorp Industries (Sembcorp) intends to increase the amount of PET bottles that are recycled in Singapore, beginning with the Punggol Shore area.June 2022: The introduction of a representative office in the Wijayakusuma Industrial Area was conducted on Thursday, June 30, 2022, making it a significant day in the history of PT Prasadha Pamunah Waste Industries (PPLI). The Wijayakusuma Industrial Estate's management, PT KIW, has leased space to the newly established PT PPLI representative office (Persero). Selling land for industrial usage, renting Ready-to-Use Factory Buildings (BPSP), and leasing space for offices are all part of PT KIW's primary business. The PT PPLI-DESI representative office will be opened with the intention of being a dependable partner for businesses, the Indonesian government, and other stakeholders, and contributing to Indonesia's economic and environmental growth.
9. What pricing options are available for accessing the report?
Pricing options include single-user, multi-user, and enterprise licenses priced at USD 4750, USD 5250, and USD 8750 respectively.
10. Is the market size provided in terms of value or volume?
The market size is provided in terms of value, measured in Million and volume, measured in Billion.
11. Are there any specific market keywords associated with the report?
Yes, the market keyword associated with the report is "ASEAN Waste Management Industry," which aids in identifying and referencing the specific market segment covered.
12. How do I determine which pricing option suits my needs best?
The pricing options vary based on user requirements and access needs. Individual users may opt for single-user licenses, while businesses requiring broader access may choose multi-user or enterprise licenses for cost-effective access to the report.
13. Are there any additional resources or data provided in the ASEAN Waste Management Industry report?
While the report offers comprehensive insights, it's advisable to review the specific contents or supplementary materials provided to ascertain if additional resources or data are available.
14. How can I stay updated on further developments or reports in the ASEAN Waste Management Industry?
To stay informed about further developments, trends, and reports in the ASEAN Waste Management Industry, consider subscribing to industry newsletters, following relevant companies and organizations, or regularly checking reputable industry news sources and publications.
Methodology
Step 1 - Identification of Relevant Samples Size from Population Database


Step 2 - Approaches for Defining Global Market Size (Value, Volume* & Price*)

Note*: In applicable scenarios
Step 3 - Data Sources
Primary Research
- Web Analytics
- Survey Reports
- Research Institute
- Latest Research Reports
- Opinion Leaders
Secondary Research
- Annual Reports
- White Paper
- Latest Press Release
- Industry Association
- Paid Database
- Investor Presentations

Step 4 - Data Triangulation
Involves using different sources of information in order to increase the validity of a study
These sources are likely to be stakeholders in a program - participants, other researchers, program staff, other community members, and so on.
Then we put all data in single framework & apply various statistical tools to find out the dynamic on the market.
During the analysis stage, feedback from the stakeholder groups would be compared to determine areas of agreement as well as areas of divergence