


Key Insights
The global carbonated drinks market, valued at $500,260 million in 2025, is projected to experience robust growth, driven by several key factors. The 4.76% CAGR indicates a steady increase in demand over the forecast period (2025-2033). This growth is fueled by the enduring popularity of classic cola and other carbonated beverages, particularly among younger demographics. However, increasing health consciousness is a significant restraint. The market is witnessing a shift towards healthier options, with the diet cola and fruit-flavored carbonate segments experiencing faster growth compared to standard cola. This trend is further supported by innovative packaging choices, like the increasing adoption of PET bottles for sustainability and convenience. The on-trade channel (restaurants, bars, etc.) remains a crucial distribution segment, while the off-trade (retail stores) continues its significant share, reflecting consumer purchasing habits. Competition is fierce, with established players like Coca-Cola and PepsiCo vying for market share alongside regional and emerging brands. Geographic variations exist, with North America and Europe holding substantial market shares, while Asia-Pacific demonstrates significant growth potential driven by rising disposable incomes and changing consumption patterns. The market's future hinges on adapting to consumer preferences for healthier options and sustainable practices, while maintaining the appeal of classic carbonated drinks.

Carbonated Drinks Market Market Size (In Billion)

This necessitates strategic product diversification by companies, incorporating natural flavors and reduced sugar content. Furthermore, effective distribution strategies and targeted marketing campaigns are essential to reach diverse consumer segments. The growing emphasis on eco-friendly packaging materials, such as recycled PET bottles and aluminum cans, underscores the crucial role of sustainability in shaping the market landscape. The introduction of innovative flavors and functional beverages within the carbonated drinks category also presents opportunities for growth, catering to increasingly discerning consumer preferences. Expansion into emerging markets, particularly in Asia and Africa, presents considerable potential for companies seeking to capitalize on growing demand and untapped markets. However, navigating regulatory hurdles related to sugar taxes and health regulations will be a significant challenge.

Carbonated Drinks Market Company Market Share
Carbonated Drinks Market Report: 2019-2033
This comprehensive report provides a detailed analysis of the global carbonated drinks market, offering actionable insights for industry professionals and investors. Covering the period from 2019 to 2033, with a focus on 2025, this report dissects market dynamics, key players, and future trends. The report leverages extensive data analysis to provide a clear and concise understanding of this dynamic market.
Carbonated Drinks Market Structure & Innovation Trends
The carbonated drinks market exhibits a high level of concentration, with a few multinational corporations holding significant market share. The Coca-Cola Company and PepsiCo Inc. are dominant players, commanding a combined xx% of the global market in 2024. Other key players include Asahi Group Holdings Ltd, Suntory Holdings Limited, and Keurig Dr Pepper Inc., each contributing significantly to the market's overall volume. Market share is constantly shifting due to new product launches and aggressive marketing strategies. The market is characterized by ongoing innovation driven by consumer demand for healthier options and diverse flavors. Regulatory frameworks, particularly those focused on sugar content and labeling, significantly influence product development and marketing. The rise of health-conscious consumers fuels the demand for low-sugar and sugar-free options, creating opportunities for companies to innovate and capture market share. Substitutes like sparkling water and fruit juices present competitive challenges, forcing carbonated drink manufacturers to adapt and differentiate their products. M&A activity remains significant, with deal values exceeding xx Million in 2024, mostly driven by efforts to expand product portfolios and geographic reach. The demographic trends show a growing demand in emerging markets, while established markets are showing saturation.
- Market Concentration: Highly concentrated, with Coca-Cola and PepsiCo leading.
- Innovation Drivers: Health consciousness, diverse flavor preferences, technological advancements.
- Regulatory Frameworks: Impacting sugar content, labeling, and marketing.
- Product Substitutes: Sparkling water, fruit juices, and other functional beverages.
- M&A Activity: Deal values exceeding xx Million in 2024.
Carbonated Drinks Market Dynamics & Trends
The global carbonated drinks market is projected to experience a CAGR of xx% during the forecast period (2025-2033). Market growth is fueled by several factors, including rising disposable incomes in emerging economies, increasing urbanization, and changing consumer preferences. However, growing health concerns regarding sugar intake pose a significant challenge. The market is witnessing technological disruptions, such as advancements in packaging and distribution, impacting both efficiency and sustainability. Consumer preferences are shifting towards healthier options, including low-sugar, sugar-free, and natural flavors. Intense competition among established players and the emergence of new entrants significantly influence market dynamics. Market penetration of premium and functional carbonated drinks is increasing, reflecting consumer willingness to pay for higher-quality and specialized products. This dynamic environment necessitates constant innovation and strategic adaptations by market participants. Furthermore, increased environmental concerns are pushing companies toward more sustainable packaging solutions.
Dominant Regions & Segments in Carbonated Drinks Market
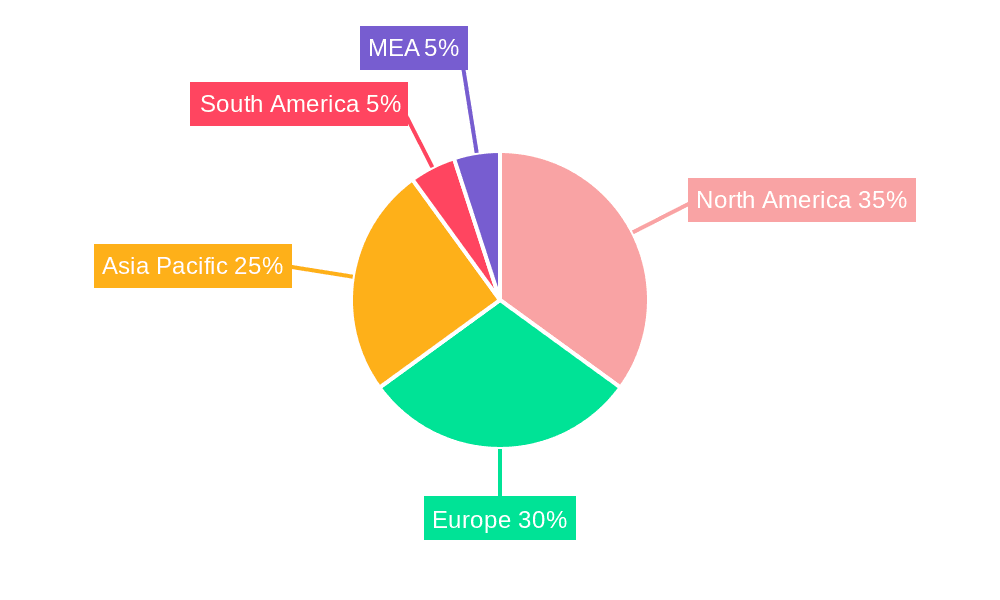
The North American region continues to be the leading market for carbonated drinks, driven by high consumption rates and established distribution networks. However, significant growth is projected in Asia-Pacific and other emerging markets.
Key Drivers for Regional Dominance:
- North America: High per capita consumption, established distribution infrastructure, strong brand presence.
- Asia-Pacific: Rapid economic growth, rising disposable incomes, and increasing urbanization.
Leading Segments:
- Soft Drink Type: Standard cola remains the dominant segment, but diet cola and fruit-flavored carbonates are experiencing significant growth, fueled by health-conscious consumers.
- Packaging Type: PET bottles hold the largest market share due to their cost-effectiveness and convenience. Metal cans are gaining popularity due to their sustainability and premium perception.
- Distribution Channel: Off-trade channels (retail stores, supermarkets) dominate, reflecting the majority of carbonated drink purchases. The on-trade segment (restaurants, bars) also shows a considerable contribution.
The dominance of these segments is influenced by consumer preferences, cost factors, and the availability of distribution networks.
Carbonated Drinks Market Product Innovations
Recent innovations in the carbonated drinks market focus on healthier options, including low-sugar and sugar-free formulations, along with the introduction of innovative flavors and functional ingredients. Technological advancements in packaging, such as sustainable materials and improved sealing techniques, are enhancing product shelf life and appeal. Companies are leveraging AI and data analytics to understand consumer preferences better and create personalized experiences. The market fit of these innovations depends on factors such as consumer acceptance, pricing strategies, and distribution channels.
Report Scope & Segmentation Analysis
This report comprehensively analyzes the carbonated drinks market across various segments:
- Soft Drink Type: Standard Cola, Diet Cola, Fruit Flavored Carbonates, Other Types. Growth projections vary significantly across these segments, reflecting changing consumer preferences. Competitive dynamics are shaped by product differentiation and marketing strategies.
- Packaging Type: Disposable Cups, Glass Bottles, Metal Can, PET Bottles. Market size and growth vary by packaging type, influenced by cost, sustainability, and convenience factors. Competitive dynamics reflect innovation in materials and design.
- Distribution Channel: Off-trade, On-trade. Market size and growth differ, reflecting consumer purchasing habits and industry structures. Competitive dynamics are determined by channel access and relationships.
Each segment shows distinct growth patterns and competitive landscapes.
Key Drivers of Carbonated Drinks Market Growth
Several factors drive the growth of the carbonated drinks market: increasing disposable incomes in developing countries fuel demand; urbanization leads to higher consumption in urban centers; product diversification with new flavors and functional ingredients cater to evolving consumer preferences; advancements in packaging technology enhance product shelf life and sustainability. Finally, effective marketing and branding campaigns significantly impact market penetration.
Challenges in the Carbonated Drinks Market Sector
The carbonated drinks market faces significant challenges, including growing health concerns regarding sugar intake leading to reduced consumption in developed markets; intense competition among established players and new entrants impacting profitability; fluctuations in raw material costs affecting production costs; increasing regulatory scrutiny regarding labeling and marketing, especially concerning sugar content and health claims; and evolving consumer preferences and demanding more sustainable and ethically sourced products. These challenges necessitate strategic adaptations by market participants.
Emerging Opportunities in Carbonated Drinks Market
Emerging opportunities in the carbonated drinks market include the growing demand for healthier options, such as low-sugar and functional beverages; expanding into new and emerging markets in developing economies; leveraging technological advancements in personalization and customization of products; focus on sustainable packaging and production processes to meet increasing consumer demand; and strategic partnerships and collaborations to access new markets and technologies.
Leading Players in the Carbonated Drinks Market Market
- Asahi Group Holdings Ltd
- PepsiCo Inc
- Nongfu Spring Co Ltd
- Rauch Fruchtsäfte GmbH & Co OG
- PT Anggada Putra Rekso Mulia
- Suntory Holdings Limited
- Keurig Dr Pepper Inc
- National Beverage Corp
- Refresco Group BV
- The Coca-Cola Company
- Hangzhou Wahaha Group Co Ltd
- Kirin Holdings Company Limited
- Britvic PLC
- Tingyi (Cayman Islands) Holding Corporation
- Thai Beverages PCL
Key Developments in Carbonated Drinks Market Industry
- December 2023: Kirin launched its Tokusei Ginger Ale Sour and sugar-free tea products (black tea and Hojicha) in Japan, responding to the growing demand for healthier options.
- October 2023: Coca-Cola launched Coca-Cola Y3000, an AI-created limited-edition flavor under its Coca-Cola Creations platform.
- January 2023: PepsiCo Inc. launched Starry, a lemon-lime flavored soda in regular and zero-sugar versions.
Future Outlook for Carbonated Drinks Market Market
The future of the carbonated drinks market is promising, driven by continued innovation, expansion into new markets, and the rising demand for healthier and more sustainable options. Strategic partnerships, mergers, and acquisitions will play a crucial role in shaping the market landscape. Companies focusing on product differentiation, technological advancements, and sustainable practices will be best positioned for success in this dynamic market.
Carbonated Drinks Market Segmentation
-
1. Soft Drink Type
- 1.1. Diet Cola
- 1.2. Fruit Flavored Carbonates
- 1.3. Standard Cola
- 1.4. Other Types
-
2. Packaging Type
- 2.1. Disposable Cups
- 2.2. Glass Bottles
- 2.3. Metal Can
- 2.4. PET Bottles
-
3. Distribution Channel
-
3.1. Off-trade
- 3.1.1. Convenience Stores
- 3.1.2. Online Retail
- 3.1.3. Supermarket/Hypermarket
- 3.1.4. Others
- 3.2. On-trade
-
3.1. Off-trade
Carbonated Drinks Market Segmentation By Geography
-
1. North America
- 1.1. United States
- 1.2. Canada
- 1.3. Mexico
-
2. South America
- 2.1. Brazil
- 2.2. Argentina
- 2.3. Rest of South America
-
3. Europe
- 3.1. United Kingdom
- 3.2. Germany
- 3.3. France
- 3.4. Italy
- 3.5. Spain
- 3.6. Russia
- 3.7. Benelux
- 3.8. Nordics
- 3.9. Rest of Europe
-
4. Middle East & Africa
- 4.1. Turkey
- 4.2. Israel
- 4.3. GCC
- 4.4. North Africa
- 4.5. South Africa
- 4.6. Rest of Middle East & Africa
-
5. Asia Pacific
- 5.1. China
- 5.2. India
- 5.3. Japan
- 5.4. South Korea
- 5.5. ASEAN
- 5.6. Oceania
- 5.7. Rest of Asia Pacific
Carbonated Drinks Market Regional Market Share
Geographic Coverage of Carbonated Drinks Market
Carbonated Drinks Market REPORT HIGHLIGHTS
| Aspects | Details |
|---|---|
| Study Period | 2020-2034 |
| Base Year | 2025 |
| Estimated Year | 2026 |
| Forecast Period | 2026-2034 |
| Historical Period | 2020-2025 |
| Growth Rate | CAGR of 4.76% from 2020-2034 |
| Segmentation |
|
Table of Contents
- 1. Introduction
- 1.1. Research Scope
- 1.2. Market Segmentation
- 1.3. Research Methodology
- 1.4. Definitions and Assumptions
- 2. Executive Summary
- 2.1. Introduction
- 3. Market Dynamics
- 3.1. Introduction
- 3.2. Market Drivers
- 3.2.1. Growing preference for low alcoholic beer by volume (abv) or non-alcoholic beers; Rising number of breweries leading to high prominence of craft beer
- 3.3. Market Restrains
- 3.3.1. Demand for other alcoholic beverages
- 3.4. Market Trends
- 3.4.1. OTHER KEY INDUSTRY TRENDS COVERED IN THE REPORT
- 4. Market Factor Analysis
- 4.1. Porters Five Forces
- 4.2. Supply/Value Chain
- 4.3. PESTEL analysis
- 4.4. Market Entropy
- 4.5. Patent/Trademark Analysis
- 5. Global Carbonated Drinks Market Analysis, Insights and Forecast, 2020-2032
- 5.1. Market Analysis, Insights and Forecast - by Soft Drink Type
- 5.1.1. Diet Cola
- 5.1.2. Fruit Flavored Carbonates
- 5.1.3. Standard Cola
- 5.1.4. Other Types
- 5.2. Market Analysis, Insights and Forecast - by Packaging Type
- 5.2.1. Disposable Cups
- 5.2.2. Glass Bottles
- 5.2.3. Metal Can
- 5.2.4. PET Bottles
- 5.3. Market Analysis, Insights and Forecast - by Distribution Channel
- 5.3.1. Off-trade
- 5.3.1.1. Convenience Stores
- 5.3.1.2. Online Retail
- 5.3.1.3. Supermarket/Hypermarket
- 5.3.1.4. Others
- 5.3.2. On-trade
- 5.3.1. Off-trade
- 5.4. Market Analysis, Insights and Forecast - by Region
- 5.4.1. North America
- 5.4.2. South America
- 5.4.3. Europe
- 5.4.4. Middle East & Africa
- 5.4.5. Asia Pacific
- 5.1. Market Analysis, Insights and Forecast - by Soft Drink Type
- 6. North America Carbonated Drinks Market Analysis, Insights and Forecast, 2020-2032
- 6.1. Market Analysis, Insights and Forecast - by Soft Drink Type
- 6.1.1. Diet Cola
- 6.1.2. Fruit Flavored Carbonates
- 6.1.3. Standard Cola
- 6.1.4. Other Types
- 6.2. Market Analysis, Insights and Forecast - by Packaging Type
- 6.2.1. Disposable Cups
- 6.2.2. Glass Bottles
- 6.2.3. Metal Can
- 6.2.4. PET Bottles
- 6.3. Market Analysis, Insights and Forecast - by Distribution Channel
- 6.3.1. Off-trade
- 6.3.1.1. Convenience Stores
- 6.3.1.2. Online Retail
- 6.3.1.3. Supermarket/Hypermarket
- 6.3.1.4. Others
- 6.3.2. On-trade
- 6.3.1. Off-trade
- 6.1. Market Analysis, Insights and Forecast - by Soft Drink Type
- 7. South America Carbonated Drinks Market Analysis, Insights and Forecast, 2020-2032
- 7.1. Market Analysis, Insights and Forecast - by Soft Drink Type
- 7.1.1. Diet Cola
- 7.1.2. Fruit Flavored Carbonates
- 7.1.3. Standard Cola
- 7.1.4. Other Types
- 7.2. Market Analysis, Insights and Forecast - by Packaging Type
- 7.2.1. Disposable Cups
- 7.2.2. Glass Bottles
- 7.2.3. Metal Can
- 7.2.4. PET Bottles
- 7.3. Market Analysis, Insights and Forecast - by Distribution Channel
- 7.3.1. Off-trade
- 7.3.1.1. Convenience Stores
- 7.3.1.2. Online Retail
- 7.3.1.3. Supermarket/Hypermarket
- 7.3.1.4. Others
- 7.3.2. On-trade
- 7.3.1. Off-trade
- 7.1. Market Analysis, Insights and Forecast - by Soft Drink Type
- 8. Europe Carbonated Drinks Market Analysis, Insights and Forecast, 2020-2032
- 8.1. Market Analysis, Insights and Forecast - by Soft Drink Type
- 8.1.1. Diet Cola
- 8.1.2. Fruit Flavored Carbonates
- 8.1.3. Standard Cola
- 8.1.4. Other Types
- 8.2. Market Analysis, Insights and Forecast - by Packaging Type
- 8.2.1. Disposable Cups
- 8.2.2. Glass Bottles
- 8.2.3. Metal Can
- 8.2.4. PET Bottles
- 8.3. Market Analysis, Insights and Forecast - by Distribution Channel
- 8.3.1. Off-trade
- 8.3.1.1. Convenience Stores
- 8.3.1.2. Online Retail
- 8.3.1.3. Supermarket/Hypermarket
- 8.3.1.4. Others
- 8.3.2. On-trade
- 8.3.1. Off-trade
- 8.1. Market Analysis, Insights and Forecast - by Soft Drink Type
- 9. Middle East & Africa Carbonated Drinks Market Analysis, Insights and Forecast, 2020-2032
- 9.1. Market Analysis, Insights and Forecast - by Soft Drink Type
- 9.1.1. Diet Cola
- 9.1.2. Fruit Flavored Carbonates
- 9.1.3. Standard Cola
- 9.1.4. Other Types
- 9.2. Market Analysis, Insights and Forecast - by Packaging Type
- 9.2.1. Disposable Cups
- 9.2.2. Glass Bottles
- 9.2.3. Metal Can
- 9.2.4. PET Bottles
- 9.3. Market Analysis, Insights and Forecast - by Distribution Channel
- 9.3.1. Off-trade
- 9.3.1.1. Convenience Stores
- 9.3.1.2. Online Retail
- 9.3.1.3. Supermarket/Hypermarket
- 9.3.1.4. Others
- 9.3.2. On-trade
- 9.3.1. Off-trade
- 9.1. Market Analysis, Insights and Forecast - by Soft Drink Type
- 10. Asia Pacific Carbonated Drinks Market Analysis, Insights and Forecast, 2020-2032
- 10.1. Market Analysis, Insights and Forecast - by Soft Drink Type
- 10.1.1. Diet Cola
- 10.1.2. Fruit Flavored Carbonates
- 10.1.3. Standard Cola
- 10.1.4. Other Types
- 10.2. Market Analysis, Insights and Forecast - by Packaging Type
- 10.2.1. Disposable Cups
- 10.2.2. Glass Bottles
- 10.2.3. Metal Can
- 10.2.4. PET Bottles
- 10.3. Market Analysis, Insights and Forecast - by Distribution Channel
- 10.3.1. Off-trade
- 10.3.1.1. Convenience Stores
- 10.3.1.2. Online Retail
- 10.3.1.3. Supermarket/Hypermarket
- 10.3.1.4. Others
- 10.3.2. On-trade
- 10.3.1. Off-trade
- 10.1. Market Analysis, Insights and Forecast - by Soft Drink Type
- 11. Competitive Analysis
- 11.1. Global Market Share Analysis 2025
- 11.2. Company Profiles
- 11.2.1 Asahi Group Holdings Ltd
- 11.2.1.1. Overview
- 11.2.1.2. Products
- 11.2.1.3. SWOT Analysis
- 11.2.1.4. Recent Developments
- 11.2.1.5. Financials (Based on Availability)
- 11.2.2 PepsiCo Inc
- 11.2.2.1. Overview
- 11.2.2.2. Products
- 11.2.2.3. SWOT Analysis
- 11.2.2.4. Recent Developments
- 11.2.2.5. Financials (Based on Availability)
- 11.2.3 Nongfu Spring Co Ltd
- 11.2.3.1. Overview
- 11.2.3.2. Products
- 11.2.3.3. SWOT Analysis
- 11.2.3.4. Recent Developments
- 11.2.3.5. Financials (Based on Availability)
- 11.2.4 Rauch Fruchtsäfte GmbH & Co OG
- 11.2.4.1. Overview
- 11.2.4.2. Products
- 11.2.4.3. SWOT Analysis
- 11.2.4.4. Recent Developments
- 11.2.4.5. Financials (Based on Availability)
- 11.2.5 PT Anggada Putra Rekso Mulia
- 11.2.5.1. Overview
- 11.2.5.2. Products
- 11.2.5.3. SWOT Analysis
- 11.2.5.4. Recent Developments
- 11.2.5.5. Financials (Based on Availability)
- 11.2.6 Suntory Holdings Limited
- 11.2.6.1. Overview
- 11.2.6.2. Products
- 11.2.6.3. SWOT Analysis
- 11.2.6.4. Recent Developments
- 11.2.6.5. Financials (Based on Availability)
- 11.2.7 Keurig Dr Pepper Inc
- 11.2.7.1. Overview
- 11.2.7.2. Products
- 11.2.7.3. SWOT Analysis
- 11.2.7.4. Recent Developments
- 11.2.7.5. Financials (Based on Availability)
- 11.2.8 National Beverage Corp
- 11.2.8.1. Overview
- 11.2.8.2. Products
- 11.2.8.3. SWOT Analysis
- 11.2.8.4. Recent Developments
- 11.2.8.5. Financials (Based on Availability)
- 11.2.9 Refresco Group BV
- 11.2.9.1. Overview
- 11.2.9.2. Products
- 11.2.9.3. SWOT Analysis
- 11.2.9.4. Recent Developments
- 11.2.9.5. Financials (Based on Availability)
- 11.2.10 The Coca-Cola Company
- 11.2.10.1. Overview
- 11.2.10.2. Products
- 11.2.10.3. SWOT Analysis
- 11.2.10.4. Recent Developments
- 11.2.10.5. Financials (Based on Availability)
- 11.2.11 Hangzhou Wahaha Group Co Ltd
- 11.2.11.1. Overview
- 11.2.11.2. Products
- 11.2.11.3. SWOT Analysis
- 11.2.11.4. Recent Developments
- 11.2.11.5. Financials (Based on Availability)
- 11.2.12 Kirin Holdings Company Limited
- 11.2.12.1. Overview
- 11.2.12.2. Products
- 11.2.12.3. SWOT Analysis
- 11.2.12.4. Recent Developments
- 11.2.12.5. Financials (Based on Availability)
- 11.2.13 Britvic PLC
- 11.2.13.1. Overview
- 11.2.13.2. Products
- 11.2.13.3. SWOT Analysis
- 11.2.13.4. Recent Developments
- 11.2.13.5. Financials (Based on Availability)
- 11.2.14 Tingyi (Cayman Islands) Holding Corporatio
- 11.2.14.1. Overview
- 11.2.14.2. Products
- 11.2.14.3. SWOT Analysis
- 11.2.14.4. Recent Developments
- 11.2.14.5. Financials (Based on Availability)
- 11.2.15 Thai Beverages PCL
- 11.2.15.1. Overview
- 11.2.15.2. Products
- 11.2.15.3. SWOT Analysis
- 11.2.15.4. Recent Developments
- 11.2.15.5. Financials (Based on Availability)
- 11.2.1 Asahi Group Holdings Ltd
List of Figures
- Figure 1: Global Carbonated Drinks Market Revenue Breakdown (Million, %) by Region 2025 & 2033
- Figure 2: Global Carbonated Drinks Market Volume Breakdown (liter , %) by Region 2025 & 2033
- Figure 3: North America Carbonated Drinks Market Revenue (Million), by Soft Drink Type 2025 & 2033
- Figure 4: North America Carbonated Drinks Market Volume (liter ), by Soft Drink Type 2025 & 2033
- Figure 5: North America Carbonated Drinks Market Revenue Share (%), by Soft Drink Type 2025 & 2033
- Figure 6: North America Carbonated Drinks Market Volume Share (%), by Soft Drink Type 2025 & 2033
- Figure 7: North America Carbonated Drinks Market Revenue (Million), by Packaging Type 2025 & 2033
- Figure 8: North America Carbonated Drinks Market Volume (liter ), by Packaging Type 2025 & 2033
- Figure 9: North America Carbonated Drinks Market Revenue Share (%), by Packaging Type 2025 & 2033
- Figure 10: North America Carbonated Drinks Market Volume Share (%), by Packaging Type 2025 & 2033
- Figure 11: North America Carbonated Drinks Market Revenue (Million), by Distribution Channel 2025 & 2033
- Figure 12: North America Carbonated Drinks Market Volume (liter ), by Distribution Channel 2025 & 2033
- Figure 13: North America Carbonated Drinks Market Revenue Share (%), by Distribution Channel 2025 & 2033
- Figure 14: North America Carbonated Drinks Market Volume Share (%), by Distribution Channel 2025 & 2033
- Figure 15: North America Carbonated Drinks Market Revenue (Million), by Country 2025 & 2033
- Figure 16: North America Carbonated Drinks Market Volume (liter ), by Country 2025 & 2033
- Figure 17: North America Carbonated Drinks Market Revenue Share (%), by Country 2025 & 2033
- Figure 18: North America Carbonated Drinks Market Volume Share (%), by Country 2025 & 2033
- Figure 19: South America Carbonated Drinks Market Revenue (Million), by Soft Drink Type 2025 & 2033
- Figure 20: South America Carbonated Drinks Market Volume (liter ), by Soft Drink Type 2025 & 2033
- Figure 21: South America Carbonated Drinks Market Revenue Share (%), by Soft Drink Type 2025 & 2033
- Figure 22: South America Carbonated Drinks Market Volume Share (%), by Soft Drink Type 2025 & 2033
- Figure 23: South America Carbonated Drinks Market Revenue (Million), by Packaging Type 2025 & 2033
- Figure 24: South America Carbonated Drinks Market Volume (liter ), by Packaging Type 2025 & 2033
- Figure 25: South America Carbonated Drinks Market Revenue Share (%), by Packaging Type 2025 & 2033
- Figure 26: South America Carbonated Drinks Market Volume Share (%), by Packaging Type 2025 & 2033
- Figure 27: South America Carbonated Drinks Market Revenue (Million), by Distribution Channel 2025 & 2033
- Figure 28: South America Carbonated Drinks Market Volume (liter ), by Distribution Channel 2025 & 2033
- Figure 29: South America Carbonated Drinks Market Revenue Share (%), by Distribution Channel 2025 & 2033
- Figure 30: South America Carbonated Drinks Market Volume Share (%), by Distribution Channel 2025 & 2033
- Figure 31: South America Carbonated Drinks Market Revenue (Million), by Country 2025 & 2033
- Figure 32: South America Carbonated Drinks Market Volume (liter ), by Country 2025 & 2033
- Figure 33: South America Carbonated Drinks Market Revenue Share (%), by Country 2025 & 2033
- Figure 34: South America Carbonated Drinks Market Volume Share (%), by Country 2025 & 2033
- Figure 35: Europe Carbonated Drinks Market Revenue (Million), by Soft Drink Type 2025 & 2033
- Figure 36: Europe Carbonated Drinks Market Volume (liter ), by Soft Drink Type 2025 & 2033
- Figure 37: Europe Carbonated Drinks Market Revenue Share (%), by Soft Drink Type 2025 & 2033
- Figure 38: Europe Carbonated Drinks Market Volume Share (%), by Soft Drink Type 2025 & 2033
- Figure 39: Europe Carbonated Drinks Market Revenue (Million), by Packaging Type 2025 & 2033
- Figure 40: Europe Carbonated Drinks Market Volume (liter ), by Packaging Type 2025 & 2033
- Figure 41: Europe Carbonated Drinks Market Revenue Share (%), by Packaging Type 2025 & 2033
- Figure 42: Europe Carbonated Drinks Market Volume Share (%), by Packaging Type 2025 & 2033
- Figure 43: Europe Carbonated Drinks Market Revenue (Million), by Distribution Channel 2025 & 2033
- Figure 44: Europe Carbonated Drinks Market Volume (liter ), by Distribution Channel 2025 & 2033
- Figure 45: Europe Carbonated Drinks Market Revenue Share (%), by Distribution Channel 2025 & 2033
- Figure 46: Europe Carbonated Drinks Market Volume Share (%), by Distribution Channel 2025 & 2033
- Figure 47: Europe Carbonated Drinks Market Revenue (Million), by Country 2025 & 2033
- Figure 48: Europe Carbonated Drinks Market Volume (liter ), by Country 2025 & 2033
- Figure 49: Europe Carbonated Drinks Market Revenue Share (%), by Country 2025 & 2033
- Figure 50: Europe Carbonated Drinks Market Volume Share (%), by Country 2025 & 2033
- Figure 51: Middle East & Africa Carbonated Drinks Market Revenue (Million), by Soft Drink Type 2025 & 2033
- Figure 52: Middle East & Africa Carbonated Drinks Market Volume (liter ), by Soft Drink Type 2025 & 2033
- Figure 53: Middle East & Africa Carbonated Drinks Market Revenue Share (%), by Soft Drink Type 2025 & 2033
- Figure 54: Middle East & Africa Carbonated Drinks Market Volume Share (%), by Soft Drink Type 2025 & 2033
- Figure 55: Middle East & Africa Carbonated Drinks Market Revenue (Million), by Packaging Type 2025 & 2033
- Figure 56: Middle East & Africa Carbonated Drinks Market Volume (liter ), by Packaging Type 2025 & 2033
- Figure 57: Middle East & Africa Carbonated Drinks Market Revenue Share (%), by Packaging Type 2025 & 2033
- Figure 58: Middle East & Africa Carbonated Drinks Market Volume Share (%), by Packaging Type 2025 & 2033
- Figure 59: Middle East & Africa Carbonated Drinks Market Revenue (Million), by Distribution Channel 2025 & 2033
- Figure 60: Middle East & Africa Carbonated Drinks Market Volume (liter ), by Distribution Channel 2025 & 2033
- Figure 61: Middle East & Africa Carbonated Drinks Market Revenue Share (%), by Distribution Channel 2025 & 2033
- Figure 62: Middle East & Africa Carbonated Drinks Market Volume Share (%), by Distribution Channel 2025 & 2033
- Figure 63: Middle East & Africa Carbonated Drinks Market Revenue (Million), by Country 2025 & 2033
- Figure 64: Middle East & Africa Carbonated Drinks Market Volume (liter ), by Country 2025 & 2033
- Figure 65: Middle East & Africa Carbonated Drinks Market Revenue Share (%), by Country 2025 & 2033
- Figure 66: Middle East & Africa Carbonated Drinks Market Volume Share (%), by Country 2025 & 2033
- Figure 67: Asia Pacific Carbonated Drinks Market Revenue (Million), by Soft Drink Type 2025 & 2033
- Figure 68: Asia Pacific Carbonated Drinks Market Volume (liter ), by Soft Drink Type 2025 & 2033
- Figure 69: Asia Pacific Carbonated Drinks Market Revenue Share (%), by Soft Drink Type 2025 & 2033
- Figure 70: Asia Pacific Carbonated Drinks Market Volume Share (%), by Soft Drink Type 2025 & 2033
- Figure 71: Asia Pacific Carbonated Drinks Market Revenue (Million), by Packaging Type 2025 & 2033
- Figure 72: Asia Pacific Carbonated Drinks Market Volume (liter ), by Packaging Type 2025 & 2033
- Figure 73: Asia Pacific Carbonated Drinks Market Revenue Share (%), by Packaging Type 2025 & 2033
- Figure 74: Asia Pacific Carbonated Drinks Market Volume Share (%), by Packaging Type 2025 & 2033
- Figure 75: Asia Pacific Carbonated Drinks Market Revenue (Million), by Distribution Channel 2025 & 2033
- Figure 76: Asia Pacific Carbonated Drinks Market Volume (liter ), by Distribution Channel 2025 & 2033
- Figure 77: Asia Pacific Carbonated Drinks Market Revenue Share (%), by Distribution Channel 2025 & 2033
- Figure 78: Asia Pacific Carbonated Drinks Market Volume Share (%), by Distribution Channel 2025 & 2033
- Figure 79: Asia Pacific Carbonated Drinks Market Revenue (Million), by Country 2025 & 2033
- Figure 80: Asia Pacific Carbonated Drinks Market Volume (liter ), by Country 2025 & 2033
- Figure 81: Asia Pacific Carbonated Drinks Market Revenue Share (%), by Country 2025 & 2033
- Figure 82: Asia Pacific Carbonated Drinks Market Volume Share (%), by Country 2025 & 2033
List of Tables
- Table 1: Global Carbonated Drinks Market Revenue Million Forecast, by Soft Drink Type 2020 & 2033
- Table 2: Global Carbonated Drinks Market Volume liter Forecast, by Soft Drink Type 2020 & 2033
- Table 3: Global Carbonated Drinks Market Revenue Million Forecast, by Packaging Type 2020 & 2033
- Table 4: Global Carbonated Drinks Market Volume liter Forecast, by Packaging Type 2020 & 2033
- Table 5: Global Carbonated Drinks Market Revenue Million Forecast, by Distribution Channel 2020 & 2033
- Table 6: Global Carbonated Drinks Market Volume liter Forecast, by Distribution Channel 2020 & 2033
- Table 7: Global Carbonated Drinks Market Revenue Million Forecast, by Region 2020 & 2033
- Table 8: Global Carbonated Drinks Market Volume liter Forecast, by Region 2020 & 2033
- Table 9: Global Carbonated Drinks Market Revenue Million Forecast, by Soft Drink Type 2020 & 2033
- Table 10: Global Carbonated Drinks Market Volume liter Forecast, by Soft Drink Type 2020 & 2033
- Table 11: Global Carbonated Drinks Market Revenue Million Forecast, by Packaging Type 2020 & 2033
- Table 12: Global Carbonated Drinks Market Volume liter Forecast, by Packaging Type 2020 & 2033
- Table 13: Global Carbonated Drinks Market Revenue Million Forecast, by Distribution Channel 2020 & 2033
- Table 14: Global Carbonated Drinks Market Volume liter Forecast, by Distribution Channel 2020 & 2033
- Table 15: Global Carbonated Drinks Market Revenue Million Forecast, by Country 2020 & 2033
- Table 16: Global Carbonated Drinks Market Volume liter Forecast, by Country 2020 & 2033
- Table 17: United States Carbonated Drinks Market Revenue (Million) Forecast, by Application 2020 & 2033
- Table 18: United States Carbonated Drinks Market Volume (liter ) Forecast, by Application 2020 & 2033
- Table 19: Canada Carbonated Drinks Market Revenue (Million) Forecast, by Application 2020 & 2033
- Table 20: Canada Carbonated Drinks Market Volume (liter ) Forecast, by Application 2020 & 2033
- Table 21: Mexico Carbonated Drinks Market Revenue (Million) Forecast, by Application 2020 & 2033
- Table 22: Mexico Carbonated Drinks Market Volume (liter ) Forecast, by Application 2020 & 2033
- Table 23: Global Carbonated Drinks Market Revenue Million Forecast, by Soft Drink Type 2020 & 2033
- Table 24: Global Carbonated Drinks Market Volume liter Forecast, by Soft Drink Type 2020 & 2033
- Table 25: Global Carbonated Drinks Market Revenue Million Forecast, by Packaging Type 2020 & 2033
- Table 26: Global Carbonated Drinks Market Volume liter Forecast, by Packaging Type 2020 & 2033
- Table 27: Global Carbonated Drinks Market Revenue Million Forecast, by Distribution Channel 2020 & 2033
- Table 28: Global Carbonated Drinks Market Volume liter Forecast, by Distribution Channel 2020 & 2033
- Table 29: Global Carbonated Drinks Market Revenue Million Forecast, by Country 2020 & 2033
- Table 30: Global Carbonated Drinks Market Volume liter Forecast, by Country 2020 & 2033
- Table 31: Brazil Carbonated Drinks Market Revenue (Million) Forecast, by Application 2020 & 2033
- Table 32: Brazil Carbonated Drinks Market Volume (liter ) Forecast, by Application 2020 & 2033
- Table 33: Argentina Carbonated Drinks Market Revenue (Million) Forecast, by Application 2020 & 2033
- Table 34: Argentina Carbonated Drinks Market Volume (liter ) Forecast, by Application 2020 & 2033
- Table 35: Rest of South America Carbonated Drinks Market Revenue (Million) Forecast, by Application 2020 & 2033
- Table 36: Rest of South America Carbonated Drinks Market Volume (liter ) Forecast, by Application 2020 & 2033
- Table 37: Global Carbonated Drinks Market Revenue Million Forecast, by Soft Drink Type 2020 & 2033
- Table 38: Global Carbonated Drinks Market Volume liter Forecast, by Soft Drink Type 2020 & 2033
- Table 39: Global Carbonated Drinks Market Revenue Million Forecast, by Packaging Type 2020 & 2033
- Table 40: Global Carbonated Drinks Market Volume liter Forecast, by Packaging Type 2020 & 2033
- Table 41: Global Carbonated Drinks Market Revenue Million Forecast, by Distribution Channel 2020 & 2033
- Table 42: Global Carbonated Drinks Market Volume liter Forecast, by Distribution Channel 2020 & 2033
- Table 43: Global Carbonated Drinks Market Revenue Million Forecast, by Country 2020 & 2033
- Table 44: Global Carbonated Drinks Market Volume liter Forecast, by Country 2020 & 2033
- Table 45: United Kingdom Carbonated Drinks Market Revenue (Million) Forecast, by Application 2020 & 2033
- Table 46: United Kingdom Carbonated Drinks Market Volume (liter ) Forecast, by Application 2020 & 2033
- Table 47: Germany Carbonated Drinks Market Revenue (Million) Forecast, by Application 2020 & 2033
- Table 48: Germany Carbonated Drinks Market Volume (liter ) Forecast, by Application 2020 & 2033
- Table 49: France Carbonated Drinks Market Revenue (Million) Forecast, by Application 2020 & 2033
- Table 50: France Carbonated Drinks Market Volume (liter ) Forecast, by Application 2020 & 2033
- Table 51: Italy Carbonated Drinks Market Revenue (Million) Forecast, by Application 2020 & 2033
- Table 52: Italy Carbonated Drinks Market Volume (liter ) Forecast, by Application 2020 & 2033
- Table 53: Spain Carbonated Drinks Market Revenue (Million) Forecast, by Application 2020 & 2033
- Table 54: Spain Carbonated Drinks Market Volume (liter ) Forecast, by Application 2020 & 2033
- Table 55: Russia Carbonated Drinks Market Revenue (Million) Forecast, by Application 2020 & 2033
- Table 56: Russia Carbonated Drinks Market Volume (liter ) Forecast, by Application 2020 & 2033
- Table 57: Benelux Carbonated Drinks Market Revenue (Million) Forecast, by Application 2020 & 2033
- Table 58: Benelux Carbonated Drinks Market Volume (liter ) Forecast, by Application 2020 & 2033
- Table 59: Nordics Carbonated Drinks Market Revenue (Million) Forecast, by Application 2020 & 2033
- Table 60: Nordics Carbonated Drinks Market Volume (liter ) Forecast, by Application 2020 & 2033
- Table 61: Rest of Europe Carbonated Drinks Market Revenue (Million) Forecast, by Application 2020 & 2033
- Table 62: Rest of Europe Carbonated Drinks Market Volume (liter ) Forecast, by Application 2020 & 2033
- Table 63: Global Carbonated Drinks Market Revenue Million Forecast, by Soft Drink Type 2020 & 2033
- Table 64: Global Carbonated Drinks Market Volume liter Forecast, by Soft Drink Type 2020 & 2033
- Table 65: Global Carbonated Drinks Market Revenue Million Forecast, by Packaging Type 2020 & 2033
- Table 66: Global Carbonated Drinks Market Volume liter Forecast, by Packaging Type 2020 & 2033
- Table 67: Global Carbonated Drinks Market Revenue Million Forecast, by Distribution Channel 2020 & 2033
- Table 68: Global Carbonated Drinks Market Volume liter Forecast, by Distribution Channel 2020 & 2033
- Table 69: Global Carbonated Drinks Market Revenue Million Forecast, by Country 2020 & 2033
- Table 70: Global Carbonated Drinks Market Volume liter Forecast, by Country 2020 & 2033
- Table 71: Turkey Carbonated Drinks Market Revenue (Million) Forecast, by Application 2020 & 2033
- Table 72: Turkey Carbonated Drinks Market Volume (liter ) Forecast, by Application 2020 & 2033
- Table 73: Israel Carbonated Drinks Market Revenue (Million) Forecast, by Application 2020 & 2033
- Table 74: Israel Carbonated Drinks Market Volume (liter ) Forecast, by Application 2020 & 2033
- Table 75: GCC Carbonated Drinks Market Revenue (Million) Forecast, by Application 2020 & 2033
- Table 76: GCC Carbonated Drinks Market Volume (liter ) Forecast, by Application 2020 & 2033
- Table 77: North Africa Carbonated Drinks Market Revenue (Million) Forecast, by Application 2020 & 2033
- Table 78: North Africa Carbonated Drinks Market Volume (liter ) Forecast, by Application 2020 & 2033
- Table 79: South Africa Carbonated Drinks Market Revenue (Million) Forecast, by Application 2020 & 2033
- Table 80: South Africa Carbonated Drinks Market Volume (liter ) Forecast, by Application 2020 & 2033
- Table 81: Rest of Middle East & Africa Carbonated Drinks Market Revenue (Million) Forecast, by Application 2020 & 2033
- Table 82: Rest of Middle East & Africa Carbonated Drinks Market Volume (liter ) Forecast, by Application 2020 & 2033
- Table 83: Global Carbonated Drinks Market Revenue Million Forecast, by Soft Drink Type 2020 & 2033
- Table 84: Global Carbonated Drinks Market Volume liter Forecast, by Soft Drink Type 2020 & 2033
- Table 85: Global Carbonated Drinks Market Revenue Million Forecast, by Packaging Type 2020 & 2033
- Table 86: Global Carbonated Drinks Market Volume liter Forecast, by Packaging Type 2020 & 2033
- Table 87: Global Carbonated Drinks Market Revenue Million Forecast, by Distribution Channel 2020 & 2033
- Table 88: Global Carbonated Drinks Market Volume liter Forecast, by Distribution Channel 2020 & 2033
- Table 89: Global Carbonated Drinks Market Revenue Million Forecast, by Country 2020 & 2033
- Table 90: Global Carbonated Drinks Market Volume liter Forecast, by Country 2020 & 2033
- Table 91: China Carbonated Drinks Market Revenue (Million) Forecast, by Application 2020 & 2033
- Table 92: China Carbonated Drinks Market Volume (liter ) Forecast, by Application 2020 & 2033
- Table 93: India Carbonated Drinks Market Revenue (Million) Forecast, by Application 2020 & 2033
- Table 94: India Carbonated Drinks Market Volume (liter ) Forecast, by Application 2020 & 2033
- Table 95: Japan Carbonated Drinks Market Revenue (Million) Forecast, by Application 2020 & 2033
- Table 96: Japan Carbonated Drinks Market Volume (liter ) Forecast, by Application 2020 & 2033
- Table 97: South Korea Carbonated Drinks Market Revenue (Million) Forecast, by Application 2020 & 2033
- Table 98: South Korea Carbonated Drinks Market Volume (liter ) Forecast, by Application 2020 & 2033
- Table 99: ASEAN Carbonated Drinks Market Revenue (Million) Forecast, by Application 2020 & 2033
- Table 100: ASEAN Carbonated Drinks Market Volume (liter ) Forecast, by Application 2020 & 2033
- Table 101: Oceania Carbonated Drinks Market Revenue (Million) Forecast, by Application 2020 & 2033
- Table 102: Oceania Carbonated Drinks Market Volume (liter ) Forecast, by Application 2020 & 2033
- Table 103: Rest of Asia Pacific Carbonated Drinks Market Revenue (Million) Forecast, by Application 2020 & 2033
- Table 104: Rest of Asia Pacific Carbonated Drinks Market Volume (liter ) Forecast, by Application 2020 & 2033
Frequently Asked Questions
1. What is the projected Compound Annual Growth Rate (CAGR) of the Carbonated Drinks Market?
The projected CAGR is approximately 4.76%.
2. Which companies are prominent players in the Carbonated Drinks Market?
Key companies in the market include Asahi Group Holdings Ltd, PepsiCo Inc, Nongfu Spring Co Ltd, Rauch Fruchtsäfte GmbH & Co OG, PT Anggada Putra Rekso Mulia, Suntory Holdings Limited, Keurig Dr Pepper Inc, National Beverage Corp, Refresco Group BV, The Coca-Cola Company, Hangzhou Wahaha Group Co Ltd, Kirin Holdings Company Limited, Britvic PLC, Tingyi (Cayman Islands) Holding Corporatio, Thai Beverages PCL.
3. What are the main segments of the Carbonated Drinks Market?
The market segments include Soft Drink Type, Packaging Type, Distribution Channel.
4. Can you provide details about the market size?
The market size is estimated to be USD 500260 Million as of 2022.
5. What are some drivers contributing to market growth?
Growing preference for low alcoholic beer by volume (abv) or non-alcoholic beers; Rising number of breweries leading to high prominence of craft beer.
6. What are the notable trends driving market growth?
OTHER KEY INDUSTRY TRENDS COVERED IN THE REPORT.
7. Are there any restraints impacting market growth?
Demand for other alcoholic beverages.
8. Can you provide examples of recent developments in the market?
December 2023: Kirin launched its Tokusei Ginger Ale Sour and sugar-free tea products, including black tea and Hojicha, in response to the growing demand for sugar-free beverages due to heightened health awareness in Japan. Kirin limited the availability of the Kirin Tokusei Ginger Ale Sour and sugar-free tea products to the local Japanese market as of 2023.October 2023: Coca-Cola launched Coca-Cola Y3000, the beverage is created with the help of artificial intelligence. Coca-Cola Y3000 is the latest limited-edition flavor to launch under its Coca-Cola Creations platform.January 2023: PepsiCo Inc. launched Starry, a tasting soda with a Lemon-Lime flavor. This drink is available in regular and zero-sugar versions.
9. What pricing options are available for accessing the report?
Pricing options include single-user, multi-user, and enterprise licenses priced at USD 3800, USD 4500, and USD 5800 respectively.
10. Is the market size provided in terms of value or volume?
The market size is provided in terms of value, measured in Million and volume, measured in liter .
11. Are there any specific market keywords associated with the report?
Yes, the market keyword associated with the report is "Carbonated Drinks Market," which aids in identifying and referencing the specific market segment covered.
12. How do I determine which pricing option suits my needs best?
The pricing options vary based on user requirements and access needs. Individual users may opt for single-user licenses, while businesses requiring broader access may choose multi-user or enterprise licenses for cost-effective access to the report.
13. Are there any additional resources or data provided in the Carbonated Drinks Market report?
While the report offers comprehensive insights, it's advisable to review the specific contents or supplementary materials provided to ascertain if additional resources or data are available.
14. How can I stay updated on further developments or reports in the Carbonated Drinks Market?
To stay informed about further developments, trends, and reports in the Carbonated Drinks Market, consider subscribing to industry newsletters, following relevant companies and organizations, or regularly checking reputable industry news sources and publications.
Methodology
Step 1 - Identification of Relevant Samples Size from Population Database


Step 2 - Approaches for Defining Global Market Size (Value, Volume* & Price*)

Note*: In applicable scenarios
Step 3 - Data Sources
Primary Research
- Web Analytics
- Survey Reports
- Research Institute
- Latest Research Reports
- Opinion Leaders
Secondary Research
- Annual Reports
- White Paper
- Latest Press Release
- Industry Association
- Paid Database
- Investor Presentations

Step 4 - Data Triangulation
Involves using different sources of information in order to increase the validity of a study
These sources are likely to be stakeholders in a program - participants, other researchers, program staff, other community members, and so on.
Then we put all data in single framework & apply various statistical tools to find out the dynamic on the market.
During the analysis stage, feedback from the stakeholder groups would be compared to determine areas of agreement as well as areas of divergence