

Key Insights
The global Champagne market, valued at approximately 6.43 billion in 2025, is projected to experience robust growth, exhibiting a compound annual growth rate (CAGR) of 2.3% from 2025 to 2033. This expansion is driven by rising disposable incomes in emerging economies, an increasing appreciation for luxury goods, and the growing significance of celebratory occasions. Innovative product development, including the introduction of Rosé Champagne and prestige cuvées, caters to evolving consumer preferences. The premiumization trend within the beverage sector, with consumers prioritizing high-quality products, further contributes to market growth. While challenges such as stringent regulations and price sensitivity exist, the market's trajectory remains positive, supported by continuous innovation from established players like LVMH Moët Hennessy.
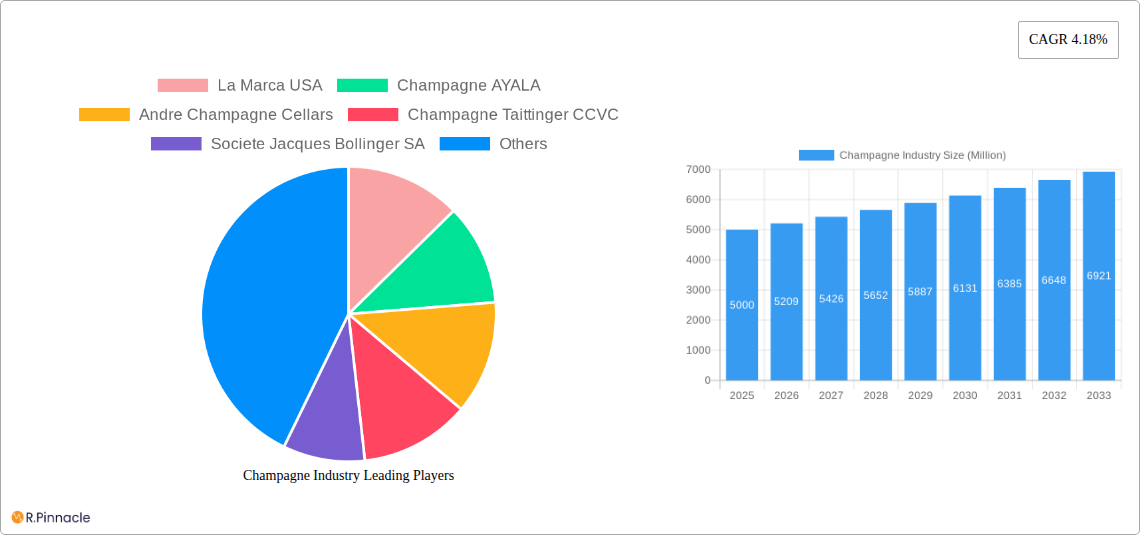
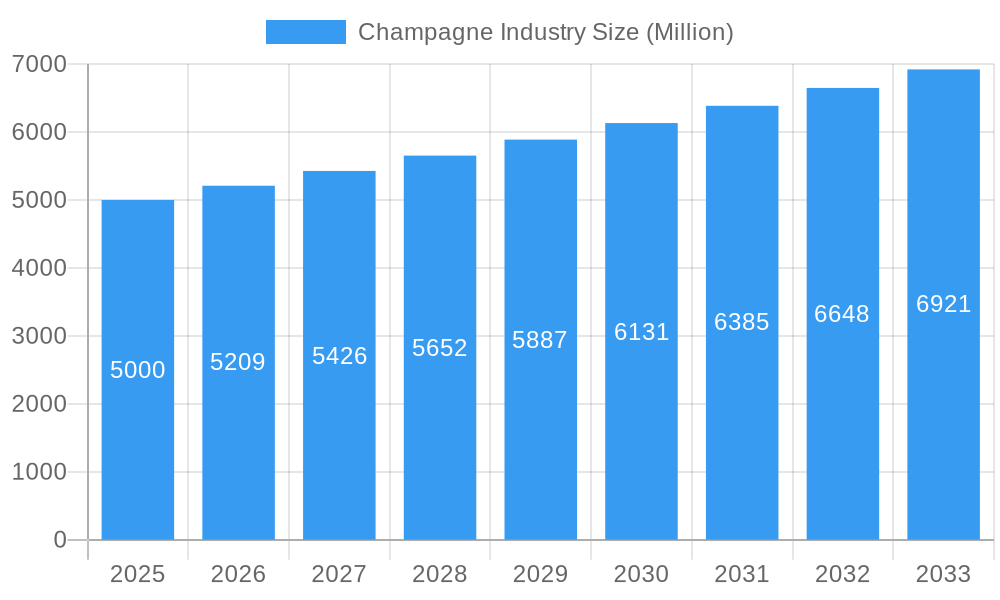
Champagne Industry Market Size (In Billion)
The Champagne market is segmented by type (Brut, Rosé, Blanc de Blancs, Blanc de Noirs, Demi-Sec, Prestige Cuvée) and distribution channel (on-trade, off-trade). The on-trade segment, including restaurants and hotels, is anticipated to maintain a significant market share due to its association with celebratory events. However, the off-trade segment, driven by online sales and retail availability, is projected for substantial growth as consumer preferences shift towards convenient purchasing. Geographically, Europe, particularly France, remains the dominant market, with faster growth expected in North America and Asia-Pacific due to increasing consumption among affluent demographics. The competitive landscape features both multinational corporations and boutique houses, ensuring diverse product offerings and pricing strategies. Future growth hinges on maintaining product quality, targeted marketing emphasizing luxury, and adapting to evolving consumer tastes and purchasing behaviors.
Champagne Industry Company Market Share
Champagne Market Analysis and Forecast: 2019-2033
This comprehensive report offers detailed analysis of the global Champagne industry, providing essential insights for industry professionals, investors, and strategic planners. It covers market structure, dynamics, and future outlook from 2019 to 2033, including historical data (2019-2024), a base year of 2025, and a forecast period from 2025 to 2033. The report examines key segments, leading players, and emerging trends, delivering actionable intelligence for navigating this prestigious market. The global Champagne market is estimated to reach 6.43 billion by 2025.
Champagne Industry Market Structure & Innovation Trends
The Champagne industry is characterized by a complex interplay of established players and emerging brands, resulting in a moderately concentrated market structure. Key players such as LVMH Moët Hennessy, Laurent-Perrier Group, and Diageo plc hold significant market share, driving innovation and influencing market trends. However, smaller, boutique Champagne houses also contribute significantly to the market’s diversity and appeal.
- Market Concentration: The top 5 players command approximately xx% of the global market share (estimated in 2025).
- Innovation Drivers: Consumer demand for premiumization, sustainable practices, and unique flavor profiles fuels innovation. This leads to the development of new cuvées, packaging, and marketing strategies.
- Regulatory Frameworks: Strict regulations regarding grape varietals, production methods, and labeling impact both the cost of production and product differentiation.
- Product Substitutes: Still wines, sparkling wines from other regions, and other luxury alcoholic beverages present competitive challenges.
- End-User Demographics: The primary consumer base skews towards high-income individuals and groups, with increasing interest from younger demographics seeking premium experiences.
- M&A Activities: The industry has seen a moderate level of M&A activity in recent years, with deal values ranging from xx Million to xx Million, primarily driven by consolidation efforts and brand expansion strategies. Examples include (but are not limited to): the acquisition of smaller Champagne houses by larger conglomerates.
Champagne Industry Market Dynamics & Trends
The Champagne industry demonstrates consistent growth, driven by several key factors. The increasing global affluence, particularly in emerging markets, fuels demand for luxury goods. Premiumization, characterized by a focus on high-quality products and unique experiences, is a prominent trend, increasing price points and market value. Technological advancements in viticulture, winemaking, and marketing techniques further enhance the sector's dynamism. However, economic downturns, shifting consumer preferences, and competitive pressures from other luxury beverage sectors present dynamic challenges to sustainable growth. The projected Compound Annual Growth Rate (CAGR) for the Champagne market is estimated at xx% between 2025 and 2033. Market penetration in key regions shows potential for further growth.
Dominant Regions & Segments in Champagne Industry
The Champagne region of France remains the undisputed global leader in Champagne production, leveraging its unique terroir and established reputation. Among Champagne types, Brut Champagne dominates the market, followed by Rosé Champagne, reflecting prevailing consumer preferences. The on-trade (restaurants, bars, hotels) channel holds a significant share of the market, although the off-trade (retail sales) segment also shows substantial growth potential.
Key Drivers for the Champagne Region’s Dominance:
- Unique Terroir: The specific climate and soil conditions of the Champagne region are crucial to the distinct quality of the Champagne produced there.
- Established Reputation: Centuries of tradition and expertise have created a globally recognized brand synonymous with quality and luxury.
- Strict Regulations: The Appellation d'Origine Contrôlée (AOC) regulations ensure high quality standards, protecting the reputation and integrity of the product.
- Tourism: Champagne tourism contributes to the economic strength of the region, attracting consumers and boosting sales.
Dominant Champagne Types:
- Brut Champagne: Remains the most popular segment due to its versatility and wide appeal.
- Rosé Champagne: Growing in popularity due to increasing consumer interest in Rosé wines in general.
Dominant Distribution Channels:
- On-Trade: Restaurants, bars, and hotels play a significant role, particularly for premium Champagne brands.
- Off-Trade: Retail stores, supermarkets, and online sales are becoming increasingly important, especially for broader consumer reach.
Champagne Industry Product Innovations
Recent innovations include the development of new cuvées, enhanced packaging designs tailored to specific consumer preferences (e.g., sustainable packaging), and the creation of unique tasting experiences. Technological advancements in vineyard management and winemaking contribute to improved quality and consistency. These innovations are crucial for maintaining market competitiveness and attracting new consumer segments.
Report Scope & Segmentation Analysis
This report segments the Champagne market by type (Brut Champagne, Rosé Champagne, Blanc de Blancs, Blanc de Noirs, Demi-Sec, Prestige Cuvée) and distribution channel (On-Trade, Off-Trade). Each segment displays unique growth trajectories influenced by consumer preferences, pricing strategies, and distribution networks. Market size projections for each segment are provided for the forecast period (2025-2033), alongside an analysis of competitive dynamics within each segment. For example, the Prestige Cuvée segment exhibits higher growth potential due to increasing demand for premium products.
Key Drivers of Champagne Industry Growth
The Champagne industry's growth is fueled by several factors: increasing disposable incomes in key markets, growing consumer appreciation for luxury goods, and successful marketing campaigns that effectively position Champagne as a celebratory beverage and a symbol of sophistication. Further, innovation in product offerings, sustainable practices, and evolving consumer preferences create opportunities for sustained growth. Favorable regulatory environments in key markets also contribute to market expansion.
Challenges in the Champagne Industry Sector
The Champagne industry faces challenges such as climate change impacting grape yields and the resulting price volatility, intense competition among established and emerging brands, and supply chain disruptions impacting distribution and availability. Economic downturns can significantly impact consumer spending on luxury goods, presenting a major risk to industry growth. Furthermore, increasing regulatory pressures and evolving consumer preferences towards more sustainable and ethical production practices demand constant adaptation.
Emerging Opportunities in Champagne Industry
Emerging markets in Asia and Latin America present substantial growth opportunities, coupled with the rising popularity of Champagne among millennial and Gen Z consumers who seek unique brand experiences. Technological advancements in winemaking and packaging offer opportunities for efficiency gains and premium product development. Sustainability initiatives and eco-friendly packaging cater to the increasing consumer demand for ethical and environmentally conscious products.
Leading Players in the Champagne Industry Market
- La Marca USA
- Champagne AYALA
- Andre Champagne Cellars
- Champagne Taittinger CCVC
- Societe Jacques Bollinger SA
- LVMH Moet Hennessy
- Laurent-Perrier Group
- Diageo plc
- F Korbel & Bros
- Cook's Champagne Cellars
Key Developments in Champagne Industry
- October 2022: Societe Jacques Bollinger SA launched a limited-edition champagne, "Special Cuvée, The Bollinger Style," celebrating its 40-year partnership with James Bond. This marketing initiative boosted brand visibility and sales.
- April 2022: Champagne Krug (LVMH) released two new "Grande Cuvées" (white and rosé), composed in 2014, which was considered an erratic year, adding to product diversity.
- February 2022: Champagne Louis Roederer launched its 2014 vintage "Cristal," priced at approximately USD 331.98 per 75 cl bottle, reflecting the premiumization trend.
Future Outlook for Champagne Industry Market
The Champagne industry is poised for continued growth, driven by expanding global demand, premiumization, and innovation in product offerings and marketing strategies. Strategic partnerships, focused on sustainability, and expansion into new markets will shape the industry's future, while addressing the challenges posed by economic volatility and evolving consumer preferences is crucial for long-term success. The market shows strong potential for expansion into emerging markets and sustained growth across all segments.
Champagne Industry Segmentation
-
1. Type
- 1.1. Brut Champagne
- 1.2. Rose Champagne
- 1.3. Blanc De Blancs
- 1.4. Blanc De Noirs
- 1.5. Demi-Sec
- 1.6. Prestige Cuvee
-
2. Distribution Channel
- 2.1. On-Trade
-
2.2. Off-Trade
- 2.2.1. Online Retail Stores
- 2.2.2. Offline Retail Stores
Champagne Industry Segmentation By Geography
-
1. North America
- 1.1. United States
- 1.2. Canada
- 1.3. Mexico
- 1.4. Rest of North America
-
2. Europe
- 2.1. United Kingdom
- 2.2. Germany
- 2.3. Spain
- 2.4. France
- 2.5. Italy
- 2.6. Russia
- 2.7. Rest of Europe
-
3. Asia Pacific
- 3.1. China
- 3.2. Japan
- 3.3. India
- 3.4. Australia
- 3.5. Rest of Asia Pacific
-
4. South America
- 4.1. Brazil
- 4.2. Argentina
- 4.3. Rest of South America
-
5. Middle East and Africa
- 5.1. South Africa
- 5.2. Saudi Arabia
- 5.3. Rest of Middle East and Africa
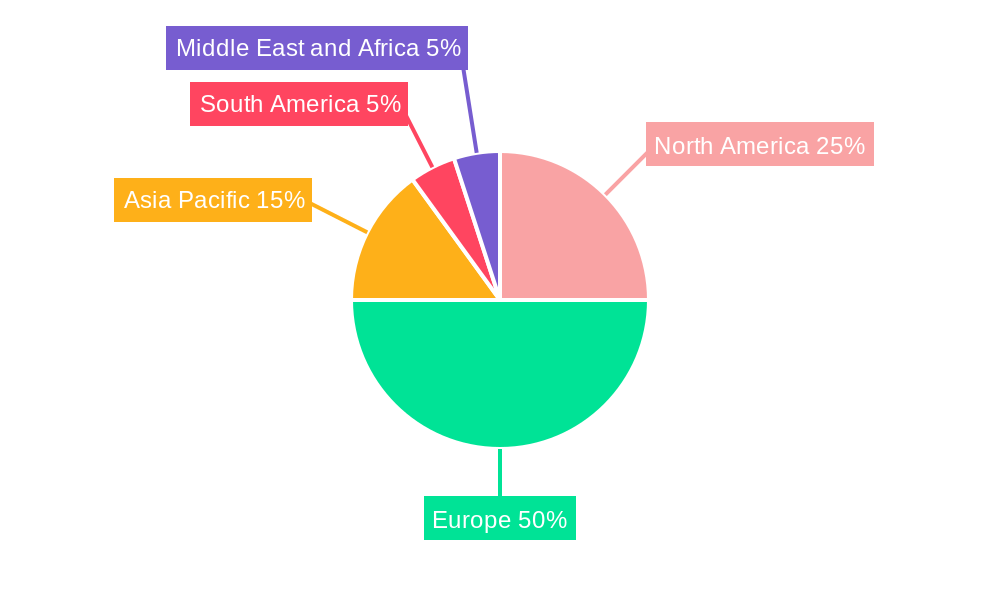
Champagne Industry Regional Market Share
Geographic Coverage of Champagne Industry
Champagne Industry REPORT HIGHLIGHTS
| Aspects | Details |
|---|---|
| Study Period | 2020-2034 |
| Base Year | 2025 |
| Estimated Year | 2026 |
| Forecast Period | 2026-2034 |
| Historical Period | 2020-2025 |
| Growth Rate | CAGR of 2.3% from 2020-2034 |
| Segmentation |
|
Table of Contents
- 1. Introduction
- 1.1. Research Scope
- 1.2. Market Segmentation
- 1.3. Research Objective
- 1.4. Definitions and Assumptions
- 2. Executive Summary
- 2.1. Market Snapshot
- 3. Market Dynamics
- 3.1. Market Drivers
- 3.2. Market Restrains
- 3.3. Market Trends
- 3.4. Market Opportunities
- 4. Market Factor Analysis
- 4.1. Porters Five Forces
- 4.1.1. Bargaining Power of Suppliers
- 4.1.2. Bargaining Power of Buyers
- 4.1.3. Threat of New Entrants
- 4.1.4. Threat of Substitutes
- 4.1.5. Competitive Rivalry
- 4.2. PESTEL analysis
- 4.3. BCG Analysis
- 4.3.1. Stars (High Growth, High Market Share)
- 4.3.2. Cash Cows (Low Growth, High Market Share)
- 4.3.3. Question Mark (High Growth, Low Market Share)
- 4.3.4. Dogs (Low Growth, Low Market Share)
- 4.4. Ansoff Matrix Analysis
- 4.5. Supply Chain Analysis
- 4.6. Regulatory Landscape
- 4.7. Current Market Potential and Opportunity Assessment (TAM–SAM–SOM Framework)
- 4.8. PRI Analyst Note
- 4.1. Porters Five Forces
- 5. Market Analysis, Insights and Forecast 2021-2033
- 5.1. Market Analysis, Insights and Forecast - by Type
- 5.1.1. Brut Champagne
- 5.1.2. Rose Champagne
- 5.1.3. Blanc De Blancs
- 5.1.4. Blanc De Noirs
- 5.1.5. Demi-Sec
- 5.1.6. Prestige Cuvee
- 5.2. Market Analysis, Insights and Forecast - by Distribution Channel
- 5.2.1. On-Trade
- 5.2.2. Off-Trade
- 5.2.2.1. Online Retail Stores
- 5.2.2.2. Offline Retail Stores
- 5.3. Market Analysis, Insights and Forecast - by Region
- 5.3.1. North America
- 5.3.2. Europe
- 5.3.3. Asia Pacific
- 5.3.4. South America
- 5.3.5. Middle East and Africa
- 5.1. Market Analysis, Insights and Forecast - by Type
- 6. Global Champagne Industry Analysis, Insights and Forecast, 2021-2033
- 6.1. Market Analysis, Insights and Forecast - by Type
- 6.1.1. Brut Champagne
- 6.1.2. Rose Champagne
- 6.1.3. Blanc De Blancs
- 6.1.4. Blanc De Noirs
- 6.1.5. Demi-Sec
- 6.1.6. Prestige Cuvee
- 6.2. Market Analysis, Insights and Forecast - by Distribution Channel
- 6.2.1. On-Trade
- 6.2.2. Off-Trade
- 6.2.2.1. Online Retail Stores
- 6.2.2.2. Offline Retail Stores
- 6.1. Market Analysis, Insights and Forecast - by Type
- 7. North America Champagne Industry Analysis, Insights and Forecast, 2020-2032
- 7.1. Market Analysis, Insights and Forecast - by Type
- 7.1.1. Brut Champagne
- 7.1.2. Rose Champagne
- 7.1.3. Blanc De Blancs
- 7.1.4. Blanc De Noirs
- 7.1.5. Demi-Sec
- 7.1.6. Prestige Cuvee
- 7.2. Market Analysis, Insights and Forecast - by Distribution Channel
- 7.2.1. On-Trade
- 7.2.2. Off-Trade
- 7.2.2.1. Online Retail Stores
- 7.2.2.2. Offline Retail Stores
- 7.1. Market Analysis, Insights and Forecast - by Type
- 8. Europe Champagne Industry Analysis, Insights and Forecast, 2020-2032
- 8.1. Market Analysis, Insights and Forecast - by Type
- 8.1.1. Brut Champagne
- 8.1.2. Rose Champagne
- 8.1.3. Blanc De Blancs
- 8.1.4. Blanc De Noirs
- 8.1.5. Demi-Sec
- 8.1.6. Prestige Cuvee
- 8.2. Market Analysis, Insights and Forecast - by Distribution Channel
- 8.2.1. On-Trade
- 8.2.2. Off-Trade
- 8.2.2.1. Online Retail Stores
- 8.2.2.2. Offline Retail Stores
- 8.1. Market Analysis, Insights and Forecast - by Type
- 9. Asia Pacific Champagne Industry Analysis, Insights and Forecast, 2020-2032
- 9.1. Market Analysis, Insights and Forecast - by Type
- 9.1.1. Brut Champagne
- 9.1.2. Rose Champagne
- 9.1.3. Blanc De Blancs
- 9.1.4. Blanc De Noirs
- 9.1.5. Demi-Sec
- 9.1.6. Prestige Cuvee
- 9.2. Market Analysis, Insights and Forecast - by Distribution Channel
- 9.2.1. On-Trade
- 9.2.2. Off-Trade
- 9.2.2.1. Online Retail Stores
- 9.2.2.2. Offline Retail Stores
- 9.1. Market Analysis, Insights and Forecast - by Type
- 10. South America Champagne Industry Analysis, Insights and Forecast, 2020-2032
- 10.1. Market Analysis, Insights and Forecast - by Type
- 10.1.1. Brut Champagne
- 10.1.2. Rose Champagne
- 10.1.3. Blanc De Blancs
- 10.1.4. Blanc De Noirs
- 10.1.5. Demi-Sec
- 10.1.6. Prestige Cuvee
- 10.2. Market Analysis, Insights and Forecast - by Distribution Channel
- 10.2.1. On-Trade
- 10.2.2. Off-Trade
- 10.2.2.1. Online Retail Stores
- 10.2.2.2. Offline Retail Stores
- 10.1. Market Analysis, Insights and Forecast - by Type
- 11. Middle East and Africa Champagne Industry Analysis, Insights and Forecast, 2020-2032
- 11.1. Market Analysis, Insights and Forecast - by Type
- 11.1.1. Brut Champagne
- 11.1.2. Rose Champagne
- 11.1.3. Blanc De Blancs
- 11.1.4. Blanc De Noirs
- 11.1.5. Demi-Sec
- 11.1.6. Prestige Cuvee
- 11.2. Market Analysis, Insights and Forecast - by Distribution Channel
- 11.2.1. On-Trade
- 11.2.2. Off-Trade
- 11.2.2.1. Online Retail Stores
- 11.2.2.2. Offline Retail Stores
- 11.1. Market Analysis, Insights and Forecast - by Type
- 12. Competitive Analysis
- 12.1. Company Profiles
- 12.1.1 La Marca USA
- 12.1.1.1. Company Overview
- 12.1.1.2. Products
- 12.1.1.3. Company Financials
- 12.1.1.4. SWOT Analysis
- 12.1.2 Champagne AYALA
- 12.1.2.1. Company Overview
- 12.1.2.2. Products
- 12.1.2.3. Company Financials
- 12.1.2.4. SWOT Analysis
- 12.1.3 Andre Champagne Cellars
- 12.1.3.1. Company Overview
- 12.1.3.2. Products
- 12.1.3.3. Company Financials
- 12.1.3.4. SWOT Analysis
- 12.1.4 Champagne Taittinger CCVC
- 12.1.4.1. Company Overview
- 12.1.4.2. Products
- 12.1.4.3. Company Financials
- 12.1.4.4. SWOT Analysis
- 12.1.5 Societe Jacques Bollinger SA
- 12.1.5.1. Company Overview
- 12.1.5.2. Products
- 12.1.5.3. Company Financials
- 12.1.5.4. SWOT Analysis
- 12.1.6 LVMH Moet Hennessy*List Not Exhaustive
- 12.1.6.1. Company Overview
- 12.1.6.2. Products
- 12.1.6.3. Company Financials
- 12.1.6.4. SWOT Analysis
- 12.1.7 Laurent-Perrier Group
- 12.1.7.1. Company Overview
- 12.1.7.2. Products
- 12.1.7.3. Company Financials
- 12.1.7.4. SWOT Analysis
- 12.1.8 Diageo plc
- 12.1.8.1. Company Overview
- 12.1.8.2. Products
- 12.1.8.3. Company Financials
- 12.1.8.4. SWOT Analysis
- 12.1.9 F Korbel & Bros
- 12.1.9.1. Company Overview
- 12.1.9.2. Products
- 12.1.9.3. Company Financials
- 12.1.9.4. SWOT Analysis
- 12.1.10 Cook's Champagne Cellars
- 12.1.10.1. Company Overview
- 12.1.10.2. Products
- 12.1.10.3. Company Financials
- 12.1.10.4. SWOT Analysis
- 12.1.1 La Marca USA
- 12.2. Market Entropy
- 12.2.1 Company's Key Areas Served
- 12.2.2 Recent Developments
- 12.3. Company Market Share Analysis 2025
- 12.3.1 Top 5 Companies Market Share Analysis
- 12.3.2 Top 3 Companies Market Share Analysis
- 12.4. List of Potential Customers
- 13. Research Methodology
List of Figures
- Figure 1: Global Champagne Industry Revenue Breakdown (billion, %) by Region 2025 & 2033
- Figure 2: Global Champagne Industry Volume Breakdown (Million, %) by Region 2025 & 2033
- Figure 3: North America Champagne Industry Revenue (billion), by Type 2025 & 2033
- Figure 4: North America Champagne Industry Volume (Million), by Type 2025 & 2033
- Figure 5: North America Champagne Industry Revenue Share (%), by Type 2025 & 2033
- Figure 6: North America Champagne Industry Volume Share (%), by Type 2025 & 2033
- Figure 7: North America Champagne Industry Revenue (billion), by Distribution Channel 2025 & 2033
- Figure 8: North America Champagne Industry Volume (Million), by Distribution Channel 2025 & 2033
- Figure 9: North America Champagne Industry Revenue Share (%), by Distribution Channel 2025 & 2033
- Figure 10: North America Champagne Industry Volume Share (%), by Distribution Channel 2025 & 2033
- Figure 11: North America Champagne Industry Revenue (billion), by Country 2025 & 2033
- Figure 12: North America Champagne Industry Volume (Million), by Country 2025 & 2033
- Figure 13: North America Champagne Industry Revenue Share (%), by Country 2025 & 2033
- Figure 14: North America Champagne Industry Volume Share (%), by Country 2025 & 2033
- Figure 15: Europe Champagne Industry Revenue (billion), by Type 2025 & 2033
- Figure 16: Europe Champagne Industry Volume (Million), by Type 2025 & 2033
- Figure 17: Europe Champagne Industry Revenue Share (%), by Type 2025 & 2033
- Figure 18: Europe Champagne Industry Volume Share (%), by Type 2025 & 2033
- Figure 19: Europe Champagne Industry Revenue (billion), by Distribution Channel 2025 & 2033
- Figure 20: Europe Champagne Industry Volume (Million), by Distribution Channel 2025 & 2033
- Figure 21: Europe Champagne Industry Revenue Share (%), by Distribution Channel 2025 & 2033
- Figure 22: Europe Champagne Industry Volume Share (%), by Distribution Channel 2025 & 2033
- Figure 23: Europe Champagne Industry Revenue (billion), by Country 2025 & 2033
- Figure 24: Europe Champagne Industry Volume (Million), by Country 2025 & 2033
- Figure 25: Europe Champagne Industry Revenue Share (%), by Country 2025 & 2033
- Figure 26: Europe Champagne Industry Volume Share (%), by Country 2025 & 2033
- Figure 27: Asia Pacific Champagne Industry Revenue (billion), by Type 2025 & 2033
- Figure 28: Asia Pacific Champagne Industry Volume (Million), by Type 2025 & 2033
- Figure 29: Asia Pacific Champagne Industry Revenue Share (%), by Type 2025 & 2033
- Figure 30: Asia Pacific Champagne Industry Volume Share (%), by Type 2025 & 2033
- Figure 31: Asia Pacific Champagne Industry Revenue (billion), by Distribution Channel 2025 & 2033
- Figure 32: Asia Pacific Champagne Industry Volume (Million), by Distribution Channel 2025 & 2033
- Figure 33: Asia Pacific Champagne Industry Revenue Share (%), by Distribution Channel 2025 & 2033
- Figure 34: Asia Pacific Champagne Industry Volume Share (%), by Distribution Channel 2025 & 2033
- Figure 35: Asia Pacific Champagne Industry Revenue (billion), by Country 2025 & 2033
- Figure 36: Asia Pacific Champagne Industry Volume (Million), by Country 2025 & 2033
- Figure 37: Asia Pacific Champagne Industry Revenue Share (%), by Country 2025 & 2033
- Figure 38: Asia Pacific Champagne Industry Volume Share (%), by Country 2025 & 2033
- Figure 39: South America Champagne Industry Revenue (billion), by Type 2025 & 2033
- Figure 40: South America Champagne Industry Volume (Million), by Type 2025 & 2033
- Figure 41: South America Champagne Industry Revenue Share (%), by Type 2025 & 2033
- Figure 42: South America Champagne Industry Volume Share (%), by Type 2025 & 2033
- Figure 43: South America Champagne Industry Revenue (billion), by Distribution Channel 2025 & 2033
- Figure 44: South America Champagne Industry Volume (Million), by Distribution Channel 2025 & 2033
- Figure 45: South America Champagne Industry Revenue Share (%), by Distribution Channel 2025 & 2033
- Figure 46: South America Champagne Industry Volume Share (%), by Distribution Channel 2025 & 2033
- Figure 47: South America Champagne Industry Revenue (billion), by Country 2025 & 2033
- Figure 48: South America Champagne Industry Volume (Million), by Country 2025 & 2033
- Figure 49: South America Champagne Industry Revenue Share (%), by Country 2025 & 2033
- Figure 50: South America Champagne Industry Volume Share (%), by Country 2025 & 2033
- Figure 51: Middle East and Africa Champagne Industry Revenue (billion), by Type 2025 & 2033
- Figure 52: Middle East and Africa Champagne Industry Volume (Million), by Type 2025 & 2033
- Figure 53: Middle East and Africa Champagne Industry Revenue Share (%), by Type 2025 & 2033
- Figure 54: Middle East and Africa Champagne Industry Volume Share (%), by Type 2025 & 2033
- Figure 55: Middle East and Africa Champagne Industry Revenue (billion), by Distribution Channel 2025 & 2033
- Figure 56: Middle East and Africa Champagne Industry Volume (Million), by Distribution Channel 2025 & 2033
- Figure 57: Middle East and Africa Champagne Industry Revenue Share (%), by Distribution Channel 2025 & 2033
- Figure 58: Middle East and Africa Champagne Industry Volume Share (%), by Distribution Channel 2025 & 2033
- Figure 59: Middle East and Africa Champagne Industry Revenue (billion), by Country 2025 & 2033
- Figure 60: Middle East and Africa Champagne Industry Volume (Million), by Country 2025 & 2033
- Figure 61: Middle East and Africa Champagne Industry Revenue Share (%), by Country 2025 & 2033
- Figure 62: Middle East and Africa Champagne Industry Volume Share (%), by Country 2025 & 2033
List of Tables
- Table 1: Global Champagne Industry Revenue billion Forecast, by Type 2020 & 2033
- Table 2: Global Champagne Industry Volume Million Forecast, by Type 2020 & 2033
- Table 3: Global Champagne Industry Revenue billion Forecast, by Distribution Channel 2020 & 2033
- Table 4: Global Champagne Industry Volume Million Forecast, by Distribution Channel 2020 & 2033
- Table 5: Global Champagne Industry Revenue billion Forecast, by Region 2020 & 2033
- Table 6: Global Champagne Industry Volume Million Forecast, by Region 2020 & 2033
- Table 7: Global Champagne Industry Revenue billion Forecast, by Type 2020 & 2033
- Table 8: Global Champagne Industry Volume Million Forecast, by Type 2020 & 2033
- Table 9: Global Champagne Industry Revenue billion Forecast, by Distribution Channel 2020 & 2033
- Table 10: Global Champagne Industry Volume Million Forecast, by Distribution Channel 2020 & 2033
- Table 11: Global Champagne Industry Revenue billion Forecast, by Country 2020 & 2033
- Table 12: Global Champagne Industry Volume Million Forecast, by Country 2020 & 2033
- Table 13: United States Champagne Industry Revenue (billion) Forecast, by Application 2020 & 2033
- Table 14: United States Champagne Industry Volume (Million) Forecast, by Application 2020 & 2033
- Table 15: Canada Champagne Industry Revenue (billion) Forecast, by Application 2020 & 2033
- Table 16: Canada Champagne Industry Volume (Million) Forecast, by Application 2020 & 2033
- Table 17: Mexico Champagne Industry Revenue (billion) Forecast, by Application 2020 & 2033
- Table 18: Mexico Champagne Industry Volume (Million) Forecast, by Application 2020 & 2033
- Table 19: Rest of North America Champagne Industry Revenue (billion) Forecast, by Application 2020 & 2033
- Table 20: Rest of North America Champagne Industry Volume (Million) Forecast, by Application 2020 & 2033
- Table 21: Global Champagne Industry Revenue billion Forecast, by Type 2020 & 2033
- Table 22: Global Champagne Industry Volume Million Forecast, by Type 2020 & 2033
- Table 23: Global Champagne Industry Revenue billion Forecast, by Distribution Channel 2020 & 2033
- Table 24: Global Champagne Industry Volume Million Forecast, by Distribution Channel 2020 & 2033
- Table 25: Global Champagne Industry Revenue billion Forecast, by Country 2020 & 2033
- Table 26: Global Champagne Industry Volume Million Forecast, by Country 2020 & 2033
- Table 27: United Kingdom Champagne Industry Revenue (billion) Forecast, by Application 2020 & 2033
- Table 28: United Kingdom Champagne Industry Volume (Million) Forecast, by Application 2020 & 2033
- Table 29: Germany Champagne Industry Revenue (billion) Forecast, by Application 2020 & 2033
- Table 30: Germany Champagne Industry Volume (Million) Forecast, by Application 2020 & 2033
- Table 31: Spain Champagne Industry Revenue (billion) Forecast, by Application 2020 & 2033
- Table 32: Spain Champagne Industry Volume (Million) Forecast, by Application 2020 & 2033
- Table 33: France Champagne Industry Revenue (billion) Forecast, by Application 2020 & 2033
- Table 34: France Champagne Industry Volume (Million) Forecast, by Application 2020 & 2033
- Table 35: Italy Champagne Industry Revenue (billion) Forecast, by Application 2020 & 2033
- Table 36: Italy Champagne Industry Volume (Million) Forecast, by Application 2020 & 2033
- Table 37: Russia Champagne Industry Revenue (billion) Forecast, by Application 2020 & 2033
- Table 38: Russia Champagne Industry Volume (Million) Forecast, by Application 2020 & 2033
- Table 39: Rest of Europe Champagne Industry Revenue (billion) Forecast, by Application 2020 & 2033
- Table 40: Rest of Europe Champagne Industry Volume (Million) Forecast, by Application 2020 & 2033
- Table 41: Global Champagne Industry Revenue billion Forecast, by Type 2020 & 2033
- Table 42: Global Champagne Industry Volume Million Forecast, by Type 2020 & 2033
- Table 43: Global Champagne Industry Revenue billion Forecast, by Distribution Channel 2020 & 2033
- Table 44: Global Champagne Industry Volume Million Forecast, by Distribution Channel 2020 & 2033
- Table 45: Global Champagne Industry Revenue billion Forecast, by Country 2020 & 2033
- Table 46: Global Champagne Industry Volume Million Forecast, by Country 2020 & 2033
- Table 47: China Champagne Industry Revenue (billion) Forecast, by Application 2020 & 2033
- Table 48: China Champagne Industry Volume (Million) Forecast, by Application 2020 & 2033
- Table 49: Japan Champagne Industry Revenue (billion) Forecast, by Application 2020 & 2033
- Table 50: Japan Champagne Industry Volume (Million) Forecast, by Application 2020 & 2033
- Table 51: India Champagne Industry Revenue (billion) Forecast, by Application 2020 & 2033
- Table 52: India Champagne Industry Volume (Million) Forecast, by Application 2020 & 2033
- Table 53: Australia Champagne Industry Revenue (billion) Forecast, by Application 2020 & 2033
- Table 54: Australia Champagne Industry Volume (Million) Forecast, by Application 2020 & 2033
- Table 55: Rest of Asia Pacific Champagne Industry Revenue (billion) Forecast, by Application 2020 & 2033
- Table 56: Rest of Asia Pacific Champagne Industry Volume (Million) Forecast, by Application 2020 & 2033
- Table 57: Global Champagne Industry Revenue billion Forecast, by Type 2020 & 2033
- Table 58: Global Champagne Industry Volume Million Forecast, by Type 2020 & 2033
- Table 59: Global Champagne Industry Revenue billion Forecast, by Distribution Channel 2020 & 2033
- Table 60: Global Champagne Industry Volume Million Forecast, by Distribution Channel 2020 & 2033
- Table 61: Global Champagne Industry Revenue billion Forecast, by Country 2020 & 2033
- Table 62: Global Champagne Industry Volume Million Forecast, by Country 2020 & 2033
- Table 63: Brazil Champagne Industry Revenue (billion) Forecast, by Application 2020 & 2033
- Table 64: Brazil Champagne Industry Volume (Million) Forecast, by Application 2020 & 2033
- Table 65: Argentina Champagne Industry Revenue (billion) Forecast, by Application 2020 & 2033
- Table 66: Argentina Champagne Industry Volume (Million) Forecast, by Application 2020 & 2033
- Table 67: Rest of South America Champagne Industry Revenue (billion) Forecast, by Application 2020 & 2033
- Table 68: Rest of South America Champagne Industry Volume (Million) Forecast, by Application 2020 & 2033
- Table 69: Global Champagne Industry Revenue billion Forecast, by Type 2020 & 2033
- Table 70: Global Champagne Industry Volume Million Forecast, by Type 2020 & 2033
- Table 71: Global Champagne Industry Revenue billion Forecast, by Distribution Channel 2020 & 2033
- Table 72: Global Champagne Industry Volume Million Forecast, by Distribution Channel 2020 & 2033
- Table 73: Global Champagne Industry Revenue billion Forecast, by Country 2020 & 2033
- Table 74: Global Champagne Industry Volume Million Forecast, by Country 2020 & 2033
- Table 75: South Africa Champagne Industry Revenue (billion) Forecast, by Application 2020 & 2033
- Table 76: South Africa Champagne Industry Volume (Million) Forecast, by Application 2020 & 2033
- Table 77: Saudi Arabia Champagne Industry Revenue (billion) Forecast, by Application 2020 & 2033
- Table 78: Saudi Arabia Champagne Industry Volume (Million) Forecast, by Application 2020 & 2033
- Table 79: Rest of Middle East and Africa Champagne Industry Revenue (billion) Forecast, by Application 2020 & 2033
- Table 80: Rest of Middle East and Africa Champagne Industry Volume (Million) Forecast, by Application 2020 & 2033
Frequently Asked Questions
1. What is the projected Compound Annual Growth Rate (CAGR) of the Champagne Industry?
The projected CAGR is approximately 2.3%.
2. Which companies are prominent players in the Champagne Industry?
Key companies in the market include La Marca USA, Champagne AYALA, Andre Champagne Cellars, Champagne Taittinger CCVC, Societe Jacques Bollinger SA, LVMH Moet Hennessy*List Not Exhaustive, Laurent-Perrier Group, Diageo plc, F Korbel & Bros, Cook's Champagne Cellars.
3. What are the main segments of the Champagne Industry?
The market segments include Type, Distribution Channel.
4. Can you provide details about the market size?
The market size is estimated to be USD 6.43 billion as of 2022.
5. What are some drivers contributing to market growth?
Demand for Premium and Super Premium Vodka; Effective Branding and Marketing by Players.
6. What are the notable trends driving market growth?
Online Platform to Increase the Market Growth.
7. Are there any restraints impacting market growth?
Stringent Regulations Pertaining to Vodka; Popularity of Non-alcoholic Beverages.
8. Can you provide examples of recent developments in the market?
October 2022: Societe Jacques Bollinger SA introduced a new limited edition champagne, "Special Cuvee, The Bollinger Style," to celebrate 40 years of partnership with 007. The limited edition gift box features the silhouette of James Bond alongside his Aston Martin DB5.
9. What pricing options are available for accessing the report?
Pricing options include single-user, multi-user, and enterprise licenses priced at USD 4750, USD 5250, and USD 8750 respectively.
10. Is the market size provided in terms of value or volume?
The market size is provided in terms of value, measured in billion and volume, measured in Million.
11. Are there any specific market keywords associated with the report?
Yes, the market keyword associated with the report is "Champagne Industry," which aids in identifying and referencing the specific market segment covered.
12. How do I determine which pricing option suits my needs best?
The pricing options vary based on user requirements and access needs. Individual users may opt for single-user licenses, while businesses requiring broader access may choose multi-user or enterprise licenses for cost-effective access to the report.
13. Are there any additional resources or data provided in the Champagne Industry report?
While the report offers comprehensive insights, it's advisable to review the specific contents or supplementary materials provided to ascertain if additional resources or data are available.
14. How can I stay updated on further developments or reports in the Champagne Industry?
To stay informed about further developments, trends, and reports in the Champagne Industry, consider subscribing to industry newsletters, following relevant companies and organizations, or regularly checking reputable industry news sources and publications.
Methodology
Step 1 - Identification of Relevant Samples Size from Population Database


Step 2 - Approaches for Defining Global Market Size (Value, Volume* & Price*)

Note*: In applicable scenarios
Step 3 - Data Sources
Primary Research
- Web Analytics
- Survey Reports
- Research Institute
- Latest Research Reports
- Opinion Leaders
Secondary Research
- Annual Reports
- White Paper
- Latest Press Release
- Industry Association
- Paid Database
- Investor Presentations

Step 4 - Data Triangulation
Involves using different sources of information in order to increase the validity of a study
These sources are likely to be stakeholders in a program - participants, other researchers, program staff, other community members, and so on.
Then we put all data in single framework & apply various statistical tools to find out the dynamic on the market.
During the analysis stage, feedback from the stakeholder groups would be compared to determine areas of agreement as well as areas of divergence