

Key Insights
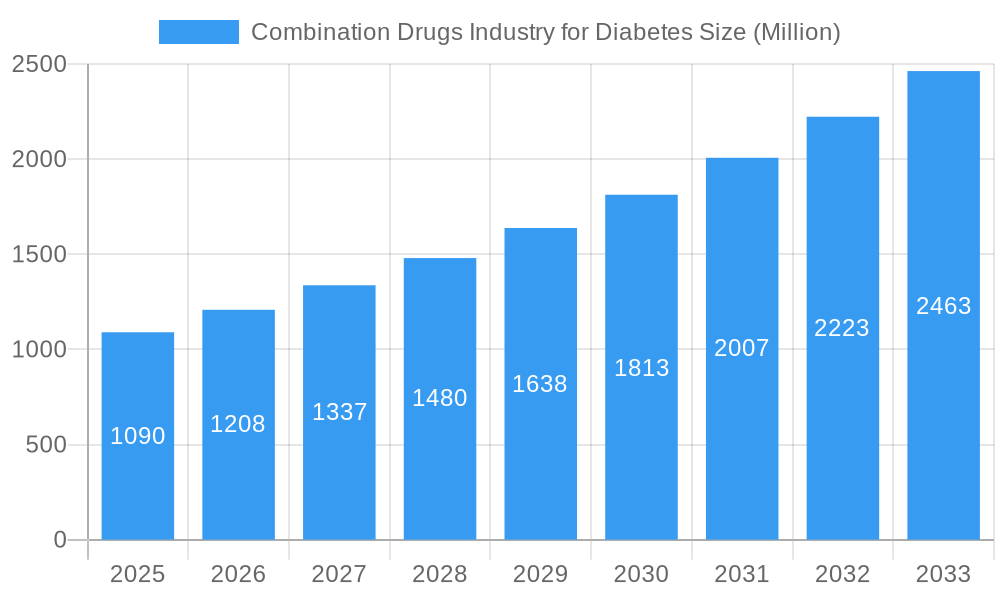
The global market for combination drugs in diabetes treatment is experiencing robust growth, projected to reach $1.09 billion in 2025 and exhibiting a Compound Annual Growth Rate (CAGR) of 10.87% from 2025 to 2033. This expansion is fueled by several key factors. The rising prevalence of type 2 diabetes, particularly in developing nations with aging populations, significantly drives demand. Furthermore, the efficacy and convenience of combination therapies, offering superior glycemic control compared to monotherapies, are major contributing factors. The market is segmented by drug type, encompassing oral combinations like Janumet (Sitagliptin and Metformin HCl), and injectable insulin combinations such as NovoMix (Biphasic Insulin Aspart), Ryzodeg (Insulin Degludec and Insulin Aspart), and Xultophy (Insulin Degludec and Liraglutide). Leading pharmaceutical companies like Novo Nordisk A/S, Merck, Sanofi, Eli Lilly, and Boehringer Ingelheim hold significant market shares, competing through innovation and market penetration strategies. Regional variations exist, with North America and Europe currently dominating the market due to higher diabetes prevalence and greater access to advanced medical treatments. However, rapid growth is anticipated in the Asia-Pacific region, driven by increasing awareness, improving healthcare infrastructure, and rising disposable incomes. The market's continued growth is expected to be influenced by ongoing research and development in novel combination therapies, focusing on improved efficacy, reduced side effects, and enhanced patient convenience.
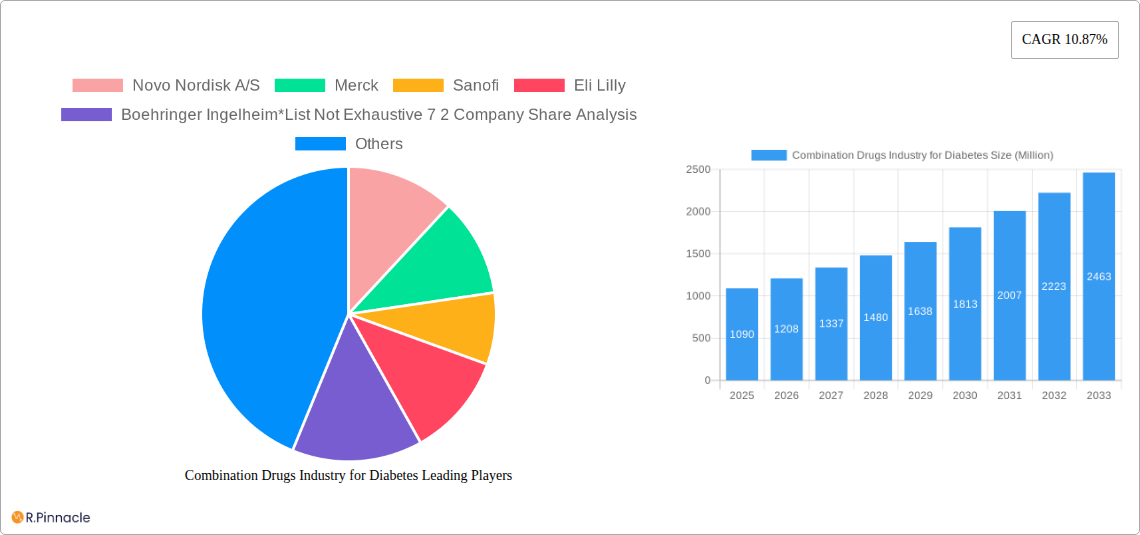
Combination Drugs Industry for Diabetes Market Size (In Billion)
Despite the positive growth trajectory, challenges remain. The high cost of combination therapies can hinder accessibility, particularly in low- and middle-income countries. Furthermore, potential side effects associated with certain combination drugs need ongoing monitoring and management. Competitive pressures among pharmaceutical companies, coupled with the emergence of biosimilar drugs, will further shape market dynamics in the coming years. Nevertheless, the long-term outlook for the combination diabetes drug market remains promising, driven by the unmet need for effective diabetes management and ongoing innovation in this crucial therapeutic area.
Combination Drugs Industry for Diabetes Company Market Share
Combination Drugs Industry for Diabetes: A Comprehensive Market Report (2019-2033)
This in-depth report provides a comprehensive analysis of the global combination drugs market for diabetes, offering actionable insights for industry professionals. The study period covers 2019-2033, with 2025 as the base and estimated year, and a forecast period of 2025-2033. The historical period analyzed is 2019-2024. This report leverages high-ranking keywords to boost search visibility and provides critical data on market size, growth drivers, challenges, and future opportunities. The report includes detailed analysis on key players like Novo Nordisk A/S, Merck, Sanofi, Eli Lilly, and Boehringer Ingelheim, amongst others.
Combination Drugs Industry for Diabetes Market Structure & Innovation Trends
The combination drugs market for diabetes displays a moderately consolidated structure with significant market share held by a few major players. Novo Nordisk A/S, Merck, and Sanofi collectively command approximately xx% of the market (2024 estimate), while "Other" players represent the remaining share. This section analyzes market concentration, highlighting the competitive landscape and the strategic moves of key players. Innovation is driven by the need for improved efficacy, reduced side effects, and convenient administration. Regulatory frameworks significantly influence product approvals and market access. M&A activity has played a crucial role in shaping the market landscape, with deal values reaching hundreds of Millions in recent years. Substitute products, including single-agent therapies and alternative treatment modalities, also exert influence on the market. End-user demographics (age, disease severity, etc.) significantly impact market demand.
- Market Concentration: High, with top 3 players holding xx% market share (2024).
- Innovation Drivers: Improved efficacy, reduced side effects, convenient administration.
- Regulatory Frameworks: Stringent approval processes impact market entry.
- M&A Activity: Significant, with deal values exceeding xx Million in recent years.
- Product Substitutes: Single-agent therapies and alternative treatments.
- End-User Demographics: Age, disease severity, and treatment adherence influence market demand.
Combination Drugs Industry for Diabetes Market Dynamics & Trends
The global combination drugs market for diabetes is experiencing robust growth, driven by increasing prevalence of type 2 diabetes, an aging global population, and growing awareness of the benefits of combination therapy. The market is estimated to reach xx Million by 2025 and is projected to exhibit a CAGR of xx% during the forecast period (2025-2033). Technological advancements such as the development of novel drug combinations and improved delivery systems are contributing to market expansion. Consumer preferences for convenient and effective therapies, coupled with changing healthcare policies, further fuel market growth. Competitive dynamics are characterized by intense rivalry among leading pharmaceutical companies through innovative product launches, strategic partnerships, and aggressive marketing campaigns. Market penetration of combination therapies is increasing steadily, particularly in developed economies.
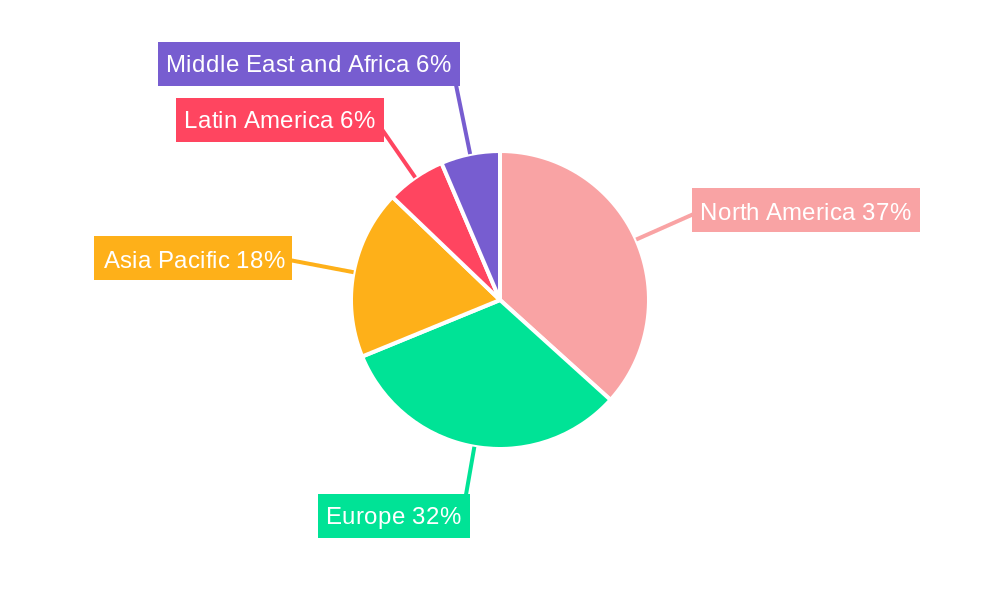
Dominant Regions & Segments in Combination Drugs Industry for Diabetes
North America currently holds the dominant position in the global combination drugs market for diabetes, followed by Europe and Asia-Pacific. This dominance is attributable to several key factors, including high prevalence of diabetes, robust healthcare infrastructure, and high per capita healthcare spending. Within the segment breakdown, Insulin combinations (e.g., NovoMix, Ryzodeg, Xultophy) command a larger market share compared to Oral Combinations (e.g., Janumet), largely due to superior efficacy in managing advanced diabetes.
- Key Drivers in North America: High prevalence of diabetes, well-established healthcare infrastructure, high per capita healthcare spending.
- Key Drivers in Europe: Growing diabetic population, strong regulatory framework supporting new drug approvals, increasing healthcare expenditure.
- Key Drivers in Asia-Pacific: Rapidly rising prevalence of diabetes, increasing awareness, growing disposable incomes.
- Segment Dominance: Insulin combination therapies hold a larger market share than oral combination therapies.
Combination Drugs Industry for Diabetes Product Innovations
Recent product innovations focus on enhancing efficacy, reducing hypoglycemic events, and improving patient convenience. This includes the development of fixed-dose combinations with improved pharmacokinetic profiles and novel delivery systems like pre-filled pens and insulin pumps. The market is witnessing a shift toward personalized medicine approaches, with a growing focus on tailoring combination therapies to individual patient needs. The competitive advantage lies in offering superior efficacy, safety, and convenience compared to existing treatments. Technological trends such as the use of advanced analytical techniques and big data analytics are accelerating product development.
Report Scope & Segmentation Analysis
This report segments the combination drugs market for diabetes based on drug type (Oral Combination, Insulin Combination) and geography (North America, Europe, Asia-Pacific, Rest of the World). The Oral Combination segment, primarily driven by Janumet (Sitagliptin and Metformin HCl), is projected to exhibit a CAGR of xx% during the forecast period. The Insulin Combination segment, featuring drugs like NovoMix, Ryzodeg, and Xultophy, is expected to grow at a CAGR of xx%, driven by higher efficacy in managing advanced diabetes. Competitive dynamics within each segment are analyzed, highlighting key players and their market strategies.
Key Drivers of Combination Drugs Industry for Diabetes Growth
The growth of the combination drugs market for diabetes is primarily driven by the increasing prevalence of type 2 diabetes globally. Technological advancements, such as the development of novel drug combinations with improved efficacy and safety profiles, also contribute significantly. Favorable regulatory frameworks that facilitate timely drug approvals accelerate market growth. Furthermore, rising healthcare spending and increasing awareness among patients are boosting market demand.
Challenges in the Combination Drugs Industry for Diabetes Sector
The combination drugs market faces challenges such as stringent regulatory hurdles for new drug approvals, impacting market entry. Supply chain disruptions can lead to production delays and shortages. Intense competition among established pharmaceutical companies necessitates continuous innovation and cost-effective manufacturing. High drug prices and limited access to combination therapies in developing countries also pose significant challenges.
Emerging Opportunities in Combination Drugs Industry for Diabetes
Emerging opportunities lie in developing novel combination therapies targeting specific patient subgroups, focusing on personalized medicine approaches. The market presents potential for growth in untapped markets, particularly in developing economies with high prevalence of diabetes but limited access to advanced therapies. Investment in advanced drug delivery systems and digital health technologies offers significant opportunities for improving patient outcomes and optimizing treatment.
Leading Players in the Combination Drugs Industry for Diabetes Market
- Novo Nordisk A/S
- Merck
- Sanofi
- Eli Lilly
- Boehringer Ingelheim
Key Developments in Combination Drugs Industry for Diabetes Industry
- July 2022: Glenmark Pharmaceuticals Limited launched sitagliptin and its fixed-dose combinations for adults with Type 2 diabetes in India, introducing 8 different combinations under the brand name SITAZIT. This development significantly impacted market access and affordability in India.
- July 2022: The European Commission granted marketing authorization for "Sitagliptin/Metformin hydrochloride Accord," expanding market availability in Europe.
Future Outlook for Combination Drugs Industry for Diabetes Market
The future outlook for the combination drugs market for diabetes is positive, driven by continuous innovation in drug development, expanding patient populations, and rising healthcare expenditure. Strategic partnerships and collaborations among pharmaceutical companies are expected to accelerate product development and market penetration. The focus on personalized medicine and digital health technologies will further enhance market growth and improve patient outcomes in the coming years.
Combination Drugs Industry for Diabetes Segmentation
-
1. Oral Combination
- 1.1. Janumet (Sitagliptin and Metformin HCl)
-
2. Insulin Combination
- 2.1. NovoMix (Biphasic Insulin Aspart)
- 2.2. Ryzodeg (Insulin Degludec and Insulin Aspart)
- 2.3. Xultophy (Insulin Degludec and Liraglutide)
Combination Drugs Industry for Diabetes Segmentation By Geography
-
1. North America
- 1.1. United States
- 1.2. Canada
- 1.3. Rest of North America
-
2. Europe
- 2.1. France
- 2.2. Germany
- 2.3. Italy
- 2.4. Spain
- 2.5. United Kingdom
- 2.6. Russia
- 2.7. Rest of Europe
-
3. Latin America
- 3.1. Mexico
- 3.2. Brazil
- 3.3. Rest of Latin America
-
4. Asia Pacific
- 4.1. Australia
- 4.2. China
- 4.3. India
- 4.4. Indonesia
- 4.5. Japan
- 4.6. Malaysia
- 4.7. Philippines
- 4.8. South Korea
- 4.9. Thailand
- 4.10. Vietnam
- 4.11. Rest of Asia Pacific
-
5. Middle East and Africa
- 5.1. Saudi Arabia
- 5.2. Iran
- 5.3. Egypt
- 5.4. Oman
- 5.5. South Africa
- 5.6. Rest of Middle East and Africa
Combination Drugs Industry for Diabetes Regional Market Share
Geographic Coverage of Combination Drugs Industry for Diabetes
Combination Drugs Industry for Diabetes REPORT HIGHLIGHTS
| Aspects | Details |
|---|---|
| Study Period | 2020-2034 |
| Base Year | 2025 |
| Estimated Year | 2026 |
| Forecast Period | 2026-2034 |
| Historical Period | 2020-2025 |
| Growth Rate | CAGR of 10.87% from 2020-2034 |
| Segmentation |
|
Table of Contents
- 1. Introduction
- 1.1. Research Scope
- 1.2. Market Segmentation
- 1.3. Research Objective
- 1.4. Definitions and Assumptions
- 2. Executive Summary
- 2.1. Market Snapshot
- 3. Market Dynamics
- 3.1. Market Drivers
- 3.2. Market Restrains
- 3.3. Market Trends
- 3.4. Market Opportunities
- 4. Market Factor Analysis
- 4.1. Porters Five Forces
- 4.1.1. Bargaining Power of Suppliers
- 4.1.2. Bargaining Power of Buyers
- 4.1.3. Threat of New Entrants
- 4.1.4. Threat of Substitutes
- 4.1.5. Competitive Rivalry
- 4.2. PESTEL analysis
- 4.3. BCG Analysis
- 4.3.1. Stars (High Growth, High Market Share)
- 4.3.2. Cash Cows (Low Growth, High Market Share)
- 4.3.3. Question Mark (High Growth, Low Market Share)
- 4.3.4. Dogs (Low Growth, Low Market Share)
- 4.4. Ansoff Matrix Analysis
- 4.5. Supply Chain Analysis
- 4.6. Regulatory Landscape
- 4.7. Current Market Potential and Opportunity Assessment (TAM–SAM–SOM Framework)
- 4.8. PRI Analyst Note
- 4.1. Porters Five Forces
- 5. Market Analysis, Insights and Forecast 2021-2033
- 5.1. Market Analysis, Insights and Forecast - by Oral Combination
- 5.1.1. Janumet (Sitagliptin and Metformin HCl)
- 5.2. Market Analysis, Insights and Forecast - by Insulin Combination
- 5.2.1. NovoMix (Biphasic Insulin Aspart)
- 5.2.2. Ryzodeg (Insulin Degludec and Insulin Aspart)
- 5.2.3. Xultophy (Insulin Degludec and Liraglutide)
- 5.3. Market Analysis, Insights and Forecast - by Region
- 5.3.1. North America
- 5.3.2. Europe
- 5.3.3. Latin America
- 5.3.4. Asia Pacific
- 5.3.5. Middle East and Africa
- 5.1. Market Analysis, Insights and Forecast - by Oral Combination
- 6. Global Combination Drugs Industry for Diabetes Analysis, Insights and Forecast, 2021-2033
- 6.1. Market Analysis, Insights and Forecast - by Oral Combination
- 6.1.1. Janumet (Sitagliptin and Metformin HCl)
- 6.2. Market Analysis, Insights and Forecast - by Insulin Combination
- 6.2.1. NovoMix (Biphasic Insulin Aspart)
- 6.2.2. Ryzodeg (Insulin Degludec and Insulin Aspart)
- 6.2.3. Xultophy (Insulin Degludec and Liraglutide)
- 6.1. Market Analysis, Insights and Forecast - by Oral Combination
- 7. North America Combination Drugs Industry for Diabetes Analysis, Insights and Forecast, 2020-2032
- 7.1. Market Analysis, Insights and Forecast - by Oral Combination
- 7.1.1. Janumet (Sitagliptin and Metformin HCl)
- 7.2. Market Analysis, Insights and Forecast - by Insulin Combination
- 7.2.1. NovoMix (Biphasic Insulin Aspart)
- 7.2.2. Ryzodeg (Insulin Degludec and Insulin Aspart)
- 7.2.3. Xultophy (Insulin Degludec and Liraglutide)
- 7.1. Market Analysis, Insights and Forecast - by Oral Combination
- 8. Europe Combination Drugs Industry for Diabetes Analysis, Insights and Forecast, 2020-2032
- 8.1. Market Analysis, Insights and Forecast - by Oral Combination
- 8.1.1. Janumet (Sitagliptin and Metformin HCl)
- 8.2. Market Analysis, Insights and Forecast - by Insulin Combination
- 8.2.1. NovoMix (Biphasic Insulin Aspart)
- 8.2.2. Ryzodeg (Insulin Degludec and Insulin Aspart)
- 8.2.3. Xultophy (Insulin Degludec and Liraglutide)
- 8.1. Market Analysis, Insights and Forecast - by Oral Combination
- 9. Latin America Combination Drugs Industry for Diabetes Analysis, Insights and Forecast, 2020-2032
- 9.1. Market Analysis, Insights and Forecast - by Oral Combination
- 9.1.1. Janumet (Sitagliptin and Metformin HCl)
- 9.2. Market Analysis, Insights and Forecast - by Insulin Combination
- 9.2.1. NovoMix (Biphasic Insulin Aspart)
- 9.2.2. Ryzodeg (Insulin Degludec and Insulin Aspart)
- 9.2.3. Xultophy (Insulin Degludec and Liraglutide)
- 9.1. Market Analysis, Insights and Forecast - by Oral Combination
- 10. Asia Pacific Combination Drugs Industry for Diabetes Analysis, Insights and Forecast, 2020-2032
- 10.1. Market Analysis, Insights and Forecast - by Oral Combination
- 10.1.1. Janumet (Sitagliptin and Metformin HCl)
- 10.2. Market Analysis, Insights and Forecast - by Insulin Combination
- 10.2.1. NovoMix (Biphasic Insulin Aspart)
- 10.2.2. Ryzodeg (Insulin Degludec and Insulin Aspart)
- 10.2.3. Xultophy (Insulin Degludec and Liraglutide)
- 10.1. Market Analysis, Insights and Forecast - by Oral Combination
- 11. Middle East and Africa Combination Drugs Industry for Diabetes Analysis, Insights and Forecast, 2020-2032
- 11.1. Market Analysis, Insights and Forecast - by Oral Combination
- 11.1.1. Janumet (Sitagliptin and Metformin HCl)
- 11.2. Market Analysis, Insights and Forecast - by Insulin Combination
- 11.2.1. NovoMix (Biphasic Insulin Aspart)
- 11.2.2. Ryzodeg (Insulin Degludec and Insulin Aspart)
- 11.2.3. Xultophy (Insulin Degludec and Liraglutide)
- 11.1. Market Analysis, Insights and Forecast - by Oral Combination
- 12. Competitive Analysis
- 12.1. Company Profiles
- 12.1.1 Novo Nordisk A/S
- 12.1.1.1. Company Overview
- 12.1.1.2. Products
- 12.1.1.3. Company Financials
- 12.1.1.4. SWOT Analysis
- 12.1.2 Merck
- 12.1.2.1. Company Overview
- 12.1.2.2. Products
- 12.1.2.3. Company Financials
- 12.1.2.4. SWOT Analysis
- 12.1.3 Sanofi
- 12.1.3.1. Company Overview
- 12.1.3.2. Products
- 12.1.3.3. Company Financials
- 12.1.3.4. SWOT Analysis
- 12.1.4 Eli Lilly
- 12.1.4.1. Company Overview
- 12.1.4.2. Products
- 12.1.4.3. Company Financials
- 12.1.4.4. SWOT Analysis
- 12.1.5 Boehringer Ingelheim*List Not Exhaustive 7 2 Company Share Analysis
- 12.1.5.1. Company Overview
- 12.1.5.2. Products
- 12.1.5.3. Company Financials
- 12.1.5.4. SWOT Analysis
- 12.1.6 Novo Nordisk A/S
- 12.1.6.1. Company Overview
- 12.1.6.2. Products
- 12.1.6.3. Company Financials
- 12.1.6.4. SWOT Analysis
- 12.1.7 Merck
- 12.1.7.1. Company Overview
- 12.1.7.2. Products
- 12.1.7.3. Company Financials
- 12.1.7.4. SWOT Analysis
- 12.1.8 Sanofi
- 12.1.8.1. Company Overview
- 12.1.8.2. Products
- 12.1.8.3. Company Financials
- 12.1.8.4. SWOT Analysis
- 12.1.9 Other
- 12.1.9.1. Company Overview
- 12.1.9.2. Products
- 12.1.9.3. Company Financials
- 12.1.9.4. SWOT Analysis
- 12.1.1 Novo Nordisk A/S
- 12.2. Market Entropy
- 12.2.1 Company's Key Areas Served
- 12.2.2 Recent Developments
- 12.3. Company Market Share Analysis 2025
- 12.3.1 Top 5 Companies Market Share Analysis
- 12.3.2 Top 3 Companies Market Share Analysis
- 12.4. List of Potential Customers
- 13. Research Methodology
List of Figures
- Figure 1: Global Combination Drugs Industry for Diabetes Revenue Breakdown (Million, %) by Region 2025 & 2033
- Figure 2: Global Combination Drugs Industry for Diabetes Volume Breakdown (Billion, %) by Region 2025 & 2033
- Figure 3: North America Combination Drugs Industry for Diabetes Revenue (Million), by Oral Combination 2025 & 2033
- Figure 4: North America Combination Drugs Industry for Diabetes Volume (Billion), by Oral Combination 2025 & 2033
- Figure 5: North America Combination Drugs Industry for Diabetes Revenue Share (%), by Oral Combination 2025 & 2033
- Figure 6: North America Combination Drugs Industry for Diabetes Volume Share (%), by Oral Combination 2025 & 2033
- Figure 7: North America Combination Drugs Industry for Diabetes Revenue (Million), by Insulin Combination 2025 & 2033
- Figure 8: North America Combination Drugs Industry for Diabetes Volume (Billion), by Insulin Combination 2025 & 2033
- Figure 9: North America Combination Drugs Industry for Diabetes Revenue Share (%), by Insulin Combination 2025 & 2033
- Figure 10: North America Combination Drugs Industry for Diabetes Volume Share (%), by Insulin Combination 2025 & 2033
- Figure 11: North America Combination Drugs Industry for Diabetes Revenue (Million), by Country 2025 & 2033
- Figure 12: North America Combination Drugs Industry for Diabetes Volume (Billion), by Country 2025 & 2033
- Figure 13: North America Combination Drugs Industry for Diabetes Revenue Share (%), by Country 2025 & 2033
- Figure 14: North America Combination Drugs Industry for Diabetes Volume Share (%), by Country 2025 & 2033
- Figure 15: Europe Combination Drugs Industry for Diabetes Revenue (Million), by Oral Combination 2025 & 2033
- Figure 16: Europe Combination Drugs Industry for Diabetes Volume (Billion), by Oral Combination 2025 & 2033
- Figure 17: Europe Combination Drugs Industry for Diabetes Revenue Share (%), by Oral Combination 2025 & 2033
- Figure 18: Europe Combination Drugs Industry for Diabetes Volume Share (%), by Oral Combination 2025 & 2033
- Figure 19: Europe Combination Drugs Industry for Diabetes Revenue (Million), by Insulin Combination 2025 & 2033
- Figure 20: Europe Combination Drugs Industry for Diabetes Volume (Billion), by Insulin Combination 2025 & 2033
- Figure 21: Europe Combination Drugs Industry for Diabetes Revenue Share (%), by Insulin Combination 2025 & 2033
- Figure 22: Europe Combination Drugs Industry for Diabetes Volume Share (%), by Insulin Combination 2025 & 2033
- Figure 23: Europe Combination Drugs Industry for Diabetes Revenue (Million), by Country 2025 & 2033
- Figure 24: Europe Combination Drugs Industry for Diabetes Volume (Billion), by Country 2025 & 2033
- Figure 25: Europe Combination Drugs Industry for Diabetes Revenue Share (%), by Country 2025 & 2033
- Figure 26: Europe Combination Drugs Industry for Diabetes Volume Share (%), by Country 2025 & 2033
- Figure 27: Latin America Combination Drugs Industry for Diabetes Revenue (Million), by Oral Combination 2025 & 2033
- Figure 28: Latin America Combination Drugs Industry for Diabetes Volume (Billion), by Oral Combination 2025 & 2033
- Figure 29: Latin America Combination Drugs Industry for Diabetes Revenue Share (%), by Oral Combination 2025 & 2033
- Figure 30: Latin America Combination Drugs Industry for Diabetes Volume Share (%), by Oral Combination 2025 & 2033
- Figure 31: Latin America Combination Drugs Industry for Diabetes Revenue (Million), by Insulin Combination 2025 & 2033
- Figure 32: Latin America Combination Drugs Industry for Diabetes Volume (Billion), by Insulin Combination 2025 & 2033
- Figure 33: Latin America Combination Drugs Industry for Diabetes Revenue Share (%), by Insulin Combination 2025 & 2033
- Figure 34: Latin America Combination Drugs Industry for Diabetes Volume Share (%), by Insulin Combination 2025 & 2033
- Figure 35: Latin America Combination Drugs Industry for Diabetes Revenue (Million), by Country 2025 & 2033
- Figure 36: Latin America Combination Drugs Industry for Diabetes Volume (Billion), by Country 2025 & 2033
- Figure 37: Latin America Combination Drugs Industry for Diabetes Revenue Share (%), by Country 2025 & 2033
- Figure 38: Latin America Combination Drugs Industry for Diabetes Volume Share (%), by Country 2025 & 2033
- Figure 39: Asia Pacific Combination Drugs Industry for Diabetes Revenue (Million), by Oral Combination 2025 & 2033
- Figure 40: Asia Pacific Combination Drugs Industry for Diabetes Volume (Billion), by Oral Combination 2025 & 2033
- Figure 41: Asia Pacific Combination Drugs Industry for Diabetes Revenue Share (%), by Oral Combination 2025 & 2033
- Figure 42: Asia Pacific Combination Drugs Industry for Diabetes Volume Share (%), by Oral Combination 2025 & 2033
- Figure 43: Asia Pacific Combination Drugs Industry for Diabetes Revenue (Million), by Insulin Combination 2025 & 2033
- Figure 44: Asia Pacific Combination Drugs Industry for Diabetes Volume (Billion), by Insulin Combination 2025 & 2033
- Figure 45: Asia Pacific Combination Drugs Industry for Diabetes Revenue Share (%), by Insulin Combination 2025 & 2033
- Figure 46: Asia Pacific Combination Drugs Industry for Diabetes Volume Share (%), by Insulin Combination 2025 & 2033
- Figure 47: Asia Pacific Combination Drugs Industry for Diabetes Revenue (Million), by Country 2025 & 2033
- Figure 48: Asia Pacific Combination Drugs Industry for Diabetes Volume (Billion), by Country 2025 & 2033
- Figure 49: Asia Pacific Combination Drugs Industry for Diabetes Revenue Share (%), by Country 2025 & 2033
- Figure 50: Asia Pacific Combination Drugs Industry for Diabetes Volume Share (%), by Country 2025 & 2033
- Figure 51: Middle East and Africa Combination Drugs Industry for Diabetes Revenue (Million), by Oral Combination 2025 & 2033
- Figure 52: Middle East and Africa Combination Drugs Industry for Diabetes Volume (Billion), by Oral Combination 2025 & 2033
- Figure 53: Middle East and Africa Combination Drugs Industry for Diabetes Revenue Share (%), by Oral Combination 2025 & 2033
- Figure 54: Middle East and Africa Combination Drugs Industry for Diabetes Volume Share (%), by Oral Combination 2025 & 2033
- Figure 55: Middle East and Africa Combination Drugs Industry for Diabetes Revenue (Million), by Insulin Combination 2025 & 2033
- Figure 56: Middle East and Africa Combination Drugs Industry for Diabetes Volume (Billion), by Insulin Combination 2025 & 2033
- Figure 57: Middle East and Africa Combination Drugs Industry for Diabetes Revenue Share (%), by Insulin Combination 2025 & 2033
- Figure 58: Middle East and Africa Combination Drugs Industry for Diabetes Volume Share (%), by Insulin Combination 2025 & 2033
- Figure 59: Middle East and Africa Combination Drugs Industry for Diabetes Revenue (Million), by Country 2025 & 2033
- Figure 60: Middle East and Africa Combination Drugs Industry for Diabetes Volume (Billion), by Country 2025 & 2033
- Figure 61: Middle East and Africa Combination Drugs Industry for Diabetes Revenue Share (%), by Country 2025 & 2033
- Figure 62: Middle East and Africa Combination Drugs Industry for Diabetes Volume Share (%), by Country 2025 & 2033
List of Tables
- Table 1: Global Combination Drugs Industry for Diabetes Revenue Million Forecast, by Oral Combination 2020 & 2033
- Table 2: Global Combination Drugs Industry for Diabetes Volume Billion Forecast, by Oral Combination 2020 & 2033
- Table 3: Global Combination Drugs Industry for Diabetes Revenue Million Forecast, by Insulin Combination 2020 & 2033
- Table 4: Global Combination Drugs Industry for Diabetes Volume Billion Forecast, by Insulin Combination 2020 & 2033
- Table 5: Global Combination Drugs Industry for Diabetes Revenue Million Forecast, by Region 2020 & 2033
- Table 6: Global Combination Drugs Industry for Diabetes Volume Billion Forecast, by Region 2020 & 2033
- Table 7: Global Combination Drugs Industry for Diabetes Revenue Million Forecast, by Oral Combination 2020 & 2033
- Table 8: Global Combination Drugs Industry for Diabetes Volume Billion Forecast, by Oral Combination 2020 & 2033
- Table 9: Global Combination Drugs Industry for Diabetes Revenue Million Forecast, by Insulin Combination 2020 & 2033
- Table 10: Global Combination Drugs Industry for Diabetes Volume Billion Forecast, by Insulin Combination 2020 & 2033
- Table 11: Global Combination Drugs Industry for Diabetes Revenue Million Forecast, by Country 2020 & 2033
- Table 12: Global Combination Drugs Industry for Diabetes Volume Billion Forecast, by Country 2020 & 2033
- Table 13: United States Combination Drugs Industry for Diabetes Revenue (Million) Forecast, by Application 2020 & 2033
- Table 14: United States Combination Drugs Industry for Diabetes Volume (Billion) Forecast, by Application 2020 & 2033
- Table 15: Canada Combination Drugs Industry for Diabetes Revenue (Million) Forecast, by Application 2020 & 2033
- Table 16: Canada Combination Drugs Industry for Diabetes Volume (Billion) Forecast, by Application 2020 & 2033
- Table 17: Rest of North America Combination Drugs Industry for Diabetes Revenue (Million) Forecast, by Application 2020 & 2033
- Table 18: Rest of North America Combination Drugs Industry for Diabetes Volume (Billion) Forecast, by Application 2020 & 2033
- Table 19: Global Combination Drugs Industry for Diabetes Revenue Million Forecast, by Oral Combination 2020 & 2033
- Table 20: Global Combination Drugs Industry for Diabetes Volume Billion Forecast, by Oral Combination 2020 & 2033
- Table 21: Global Combination Drugs Industry for Diabetes Revenue Million Forecast, by Insulin Combination 2020 & 2033
- Table 22: Global Combination Drugs Industry for Diabetes Volume Billion Forecast, by Insulin Combination 2020 & 2033
- Table 23: Global Combination Drugs Industry for Diabetes Revenue Million Forecast, by Country 2020 & 2033
- Table 24: Global Combination Drugs Industry for Diabetes Volume Billion Forecast, by Country 2020 & 2033
- Table 25: France Combination Drugs Industry for Diabetes Revenue (Million) Forecast, by Application 2020 & 2033
- Table 26: France Combination Drugs Industry for Diabetes Volume (Billion) Forecast, by Application 2020 & 2033
- Table 27: Germany Combination Drugs Industry for Diabetes Revenue (Million) Forecast, by Application 2020 & 2033
- Table 28: Germany Combination Drugs Industry for Diabetes Volume (Billion) Forecast, by Application 2020 & 2033
- Table 29: Italy Combination Drugs Industry for Diabetes Revenue (Million) Forecast, by Application 2020 & 2033
- Table 30: Italy Combination Drugs Industry for Diabetes Volume (Billion) Forecast, by Application 2020 & 2033
- Table 31: Spain Combination Drugs Industry for Diabetes Revenue (Million) Forecast, by Application 2020 & 2033
- Table 32: Spain Combination Drugs Industry for Diabetes Volume (Billion) Forecast, by Application 2020 & 2033
- Table 33: United Kingdom Combination Drugs Industry for Diabetes Revenue (Million) Forecast, by Application 2020 & 2033
- Table 34: United Kingdom Combination Drugs Industry for Diabetes Volume (Billion) Forecast, by Application 2020 & 2033
- Table 35: Russia Combination Drugs Industry for Diabetes Revenue (Million) Forecast, by Application 2020 & 2033
- Table 36: Russia Combination Drugs Industry for Diabetes Volume (Billion) Forecast, by Application 2020 & 2033
- Table 37: Rest of Europe Combination Drugs Industry for Diabetes Revenue (Million) Forecast, by Application 2020 & 2033
- Table 38: Rest of Europe Combination Drugs Industry for Diabetes Volume (Billion) Forecast, by Application 2020 & 2033
- Table 39: Global Combination Drugs Industry for Diabetes Revenue Million Forecast, by Oral Combination 2020 & 2033
- Table 40: Global Combination Drugs Industry for Diabetes Volume Billion Forecast, by Oral Combination 2020 & 2033
- Table 41: Global Combination Drugs Industry for Diabetes Revenue Million Forecast, by Insulin Combination 2020 & 2033
- Table 42: Global Combination Drugs Industry for Diabetes Volume Billion Forecast, by Insulin Combination 2020 & 2033
- Table 43: Global Combination Drugs Industry for Diabetes Revenue Million Forecast, by Country 2020 & 2033
- Table 44: Global Combination Drugs Industry for Diabetes Volume Billion Forecast, by Country 2020 & 2033
- Table 45: Mexico Combination Drugs Industry for Diabetes Revenue (Million) Forecast, by Application 2020 & 2033
- Table 46: Mexico Combination Drugs Industry for Diabetes Volume (Billion) Forecast, by Application 2020 & 2033
- Table 47: Brazil Combination Drugs Industry for Diabetes Revenue (Million) Forecast, by Application 2020 & 2033
- Table 48: Brazil Combination Drugs Industry for Diabetes Volume (Billion) Forecast, by Application 2020 & 2033
- Table 49: Rest of Latin America Combination Drugs Industry for Diabetes Revenue (Million) Forecast, by Application 2020 & 2033
- Table 50: Rest of Latin America Combination Drugs Industry for Diabetes Volume (Billion) Forecast, by Application 2020 & 2033
- Table 51: Global Combination Drugs Industry for Diabetes Revenue Million Forecast, by Oral Combination 2020 & 2033
- Table 52: Global Combination Drugs Industry for Diabetes Volume Billion Forecast, by Oral Combination 2020 & 2033
- Table 53: Global Combination Drugs Industry for Diabetes Revenue Million Forecast, by Insulin Combination 2020 & 2033
- Table 54: Global Combination Drugs Industry for Diabetes Volume Billion Forecast, by Insulin Combination 2020 & 2033
- Table 55: Global Combination Drugs Industry for Diabetes Revenue Million Forecast, by Country 2020 & 2033
- Table 56: Global Combination Drugs Industry for Diabetes Volume Billion Forecast, by Country 2020 & 2033
- Table 57: Australia Combination Drugs Industry for Diabetes Revenue (Million) Forecast, by Application 2020 & 2033
- Table 58: Australia Combination Drugs Industry for Diabetes Volume (Billion) Forecast, by Application 2020 & 2033
- Table 59: China Combination Drugs Industry for Diabetes Revenue (Million) Forecast, by Application 2020 & 2033
- Table 60: China Combination Drugs Industry for Diabetes Volume (Billion) Forecast, by Application 2020 & 2033
- Table 61: India Combination Drugs Industry for Diabetes Revenue (Million) Forecast, by Application 2020 & 2033
- Table 62: India Combination Drugs Industry for Diabetes Volume (Billion) Forecast, by Application 2020 & 2033
- Table 63: Indonesia Combination Drugs Industry for Diabetes Revenue (Million) Forecast, by Application 2020 & 2033
- Table 64: Indonesia Combination Drugs Industry for Diabetes Volume (Billion) Forecast, by Application 2020 & 2033
- Table 65: Japan Combination Drugs Industry for Diabetes Revenue (Million) Forecast, by Application 2020 & 2033
- Table 66: Japan Combination Drugs Industry for Diabetes Volume (Billion) Forecast, by Application 2020 & 2033
- Table 67: Malaysia Combination Drugs Industry for Diabetes Revenue (Million) Forecast, by Application 2020 & 2033
- Table 68: Malaysia Combination Drugs Industry for Diabetes Volume (Billion) Forecast, by Application 2020 & 2033
- Table 69: Philippines Combination Drugs Industry for Diabetes Revenue (Million) Forecast, by Application 2020 & 2033
- Table 70: Philippines Combination Drugs Industry for Diabetes Volume (Billion) Forecast, by Application 2020 & 2033
- Table 71: South Korea Combination Drugs Industry for Diabetes Revenue (Million) Forecast, by Application 2020 & 2033
- Table 72: South Korea Combination Drugs Industry for Diabetes Volume (Billion) Forecast, by Application 2020 & 2033
- Table 73: Thailand Combination Drugs Industry for Diabetes Revenue (Million) Forecast, by Application 2020 & 2033
- Table 74: Thailand Combination Drugs Industry for Diabetes Volume (Billion) Forecast, by Application 2020 & 2033
- Table 75: Vietnam Combination Drugs Industry for Diabetes Revenue (Million) Forecast, by Application 2020 & 2033
- Table 76: Vietnam Combination Drugs Industry for Diabetes Volume (Billion) Forecast, by Application 2020 & 2033
- Table 77: Rest of Asia Pacific Combination Drugs Industry for Diabetes Revenue (Million) Forecast, by Application 2020 & 2033
- Table 78: Rest of Asia Pacific Combination Drugs Industry for Diabetes Volume (Billion) Forecast, by Application 2020 & 2033
- Table 79: Global Combination Drugs Industry for Diabetes Revenue Million Forecast, by Oral Combination 2020 & 2033
- Table 80: Global Combination Drugs Industry for Diabetes Volume Billion Forecast, by Oral Combination 2020 & 2033
- Table 81: Global Combination Drugs Industry for Diabetes Revenue Million Forecast, by Insulin Combination 2020 & 2033
- Table 82: Global Combination Drugs Industry for Diabetes Volume Billion Forecast, by Insulin Combination 2020 & 2033
- Table 83: Global Combination Drugs Industry for Diabetes Revenue Million Forecast, by Country 2020 & 2033
- Table 84: Global Combination Drugs Industry for Diabetes Volume Billion Forecast, by Country 2020 & 2033
- Table 85: Saudi Arabia Combination Drugs Industry for Diabetes Revenue (Million) Forecast, by Application 2020 & 2033
- Table 86: Saudi Arabia Combination Drugs Industry for Diabetes Volume (Billion) Forecast, by Application 2020 & 2033
- Table 87: Iran Combination Drugs Industry for Diabetes Revenue (Million) Forecast, by Application 2020 & 2033
- Table 88: Iran Combination Drugs Industry for Diabetes Volume (Billion) Forecast, by Application 2020 & 2033
- Table 89: Egypt Combination Drugs Industry for Diabetes Revenue (Million) Forecast, by Application 2020 & 2033
- Table 90: Egypt Combination Drugs Industry for Diabetes Volume (Billion) Forecast, by Application 2020 & 2033
- Table 91: Oman Combination Drugs Industry for Diabetes Revenue (Million) Forecast, by Application 2020 & 2033
- Table 92: Oman Combination Drugs Industry for Diabetes Volume (Billion) Forecast, by Application 2020 & 2033
- Table 93: South Africa Combination Drugs Industry for Diabetes Revenue (Million) Forecast, by Application 2020 & 2033
- Table 94: South Africa Combination Drugs Industry for Diabetes Volume (Billion) Forecast, by Application 2020 & 2033
- Table 95: Rest of Middle East and Africa Combination Drugs Industry for Diabetes Revenue (Million) Forecast, by Application 2020 & 2033
- Table 96: Rest of Middle East and Africa Combination Drugs Industry for Diabetes Volume (Billion) Forecast, by Application 2020 & 2033
Frequently Asked Questions
1. What is the projected Compound Annual Growth Rate (CAGR) of the Combination Drugs Industry for Diabetes?
The projected CAGR is approximately 10.87%.
2. Which companies are prominent players in the Combination Drugs Industry for Diabetes?
Key companies in the market include Novo Nordisk A/S, Merck, Sanofi, Eli Lilly, Boehringer Ingelheim*List Not Exhaustive 7 2 Company Share Analysis, Novo Nordisk A/S, Merck, Sanofi, Other.
3. What are the main segments of the Combination Drugs Industry for Diabetes?
The market segments include Oral Combination, Insulin Combination.
4. Can you provide details about the market size?
The market size is estimated to be USD 1.09 Million as of 2022.
5. What are some drivers contributing to market growth?
N/A
6. What are the notable trends driving market growth?
Janumet holds the highest market share in the Combination Anti-Diabetes Drugs Market in the current year.
7. Are there any restraints impacting market growth?
N/A
8. Can you provide examples of recent developments in the market?
July 2022: Glenmark Pharmaceuticals Limited announced that it had launched sitagliptin and its fixed-dose combinations for adults with Type 2 diabetes in India. Glenmark introduced 8 different combinations of sitagliptin-based drugs under the brand name SITAZIT and its variants at an affordable price.
9. What pricing options are available for accessing the report?
Pricing options include single-user, multi-user, and enterprise licenses priced at USD 4750, USD 5250, and USD 8750 respectively.
10. Is the market size provided in terms of value or volume?
The market size is provided in terms of value, measured in Million and volume, measured in Billion.
11. Are there any specific market keywords associated with the report?
Yes, the market keyword associated with the report is "Combination Drugs Industry for Diabetes," which aids in identifying and referencing the specific market segment covered.
12. How do I determine which pricing option suits my needs best?
The pricing options vary based on user requirements and access needs. Individual users may opt for single-user licenses, while businesses requiring broader access may choose multi-user or enterprise licenses for cost-effective access to the report.
13. Are there any additional resources or data provided in the Combination Drugs Industry for Diabetes report?
While the report offers comprehensive insights, it's advisable to review the specific contents or supplementary materials provided to ascertain if additional resources or data are available.
14. How can I stay updated on further developments or reports in the Combination Drugs Industry for Diabetes?
To stay informed about further developments, trends, and reports in the Combination Drugs Industry for Diabetes, consider subscribing to industry newsletters, following relevant companies and organizations, or regularly checking reputable industry news sources and publications.
Methodology
Step 1 - Identification of Relevant Samples Size from Population Database


Step 2 - Approaches for Defining Global Market Size (Value, Volume* & Price*)

Note*: In applicable scenarios
Step 3 - Data Sources
Primary Research
- Web Analytics
- Survey Reports
- Research Institute
- Latest Research Reports
- Opinion Leaders
Secondary Research
- Annual Reports
- White Paper
- Latest Press Release
- Industry Association
- Paid Database
- Investor Presentations

Step 4 - Data Triangulation
Involves using different sources of information in order to increase the validity of a study
These sources are likely to be stakeholders in a program - participants, other researchers, program staff, other community members, and so on.
Then we put all data in single framework & apply various statistical tools to find out the dynamic on the market.
During the analysis stage, feedback from the stakeholder groups would be compared to determine areas of agreement as well as areas of divergence