

Key Insights
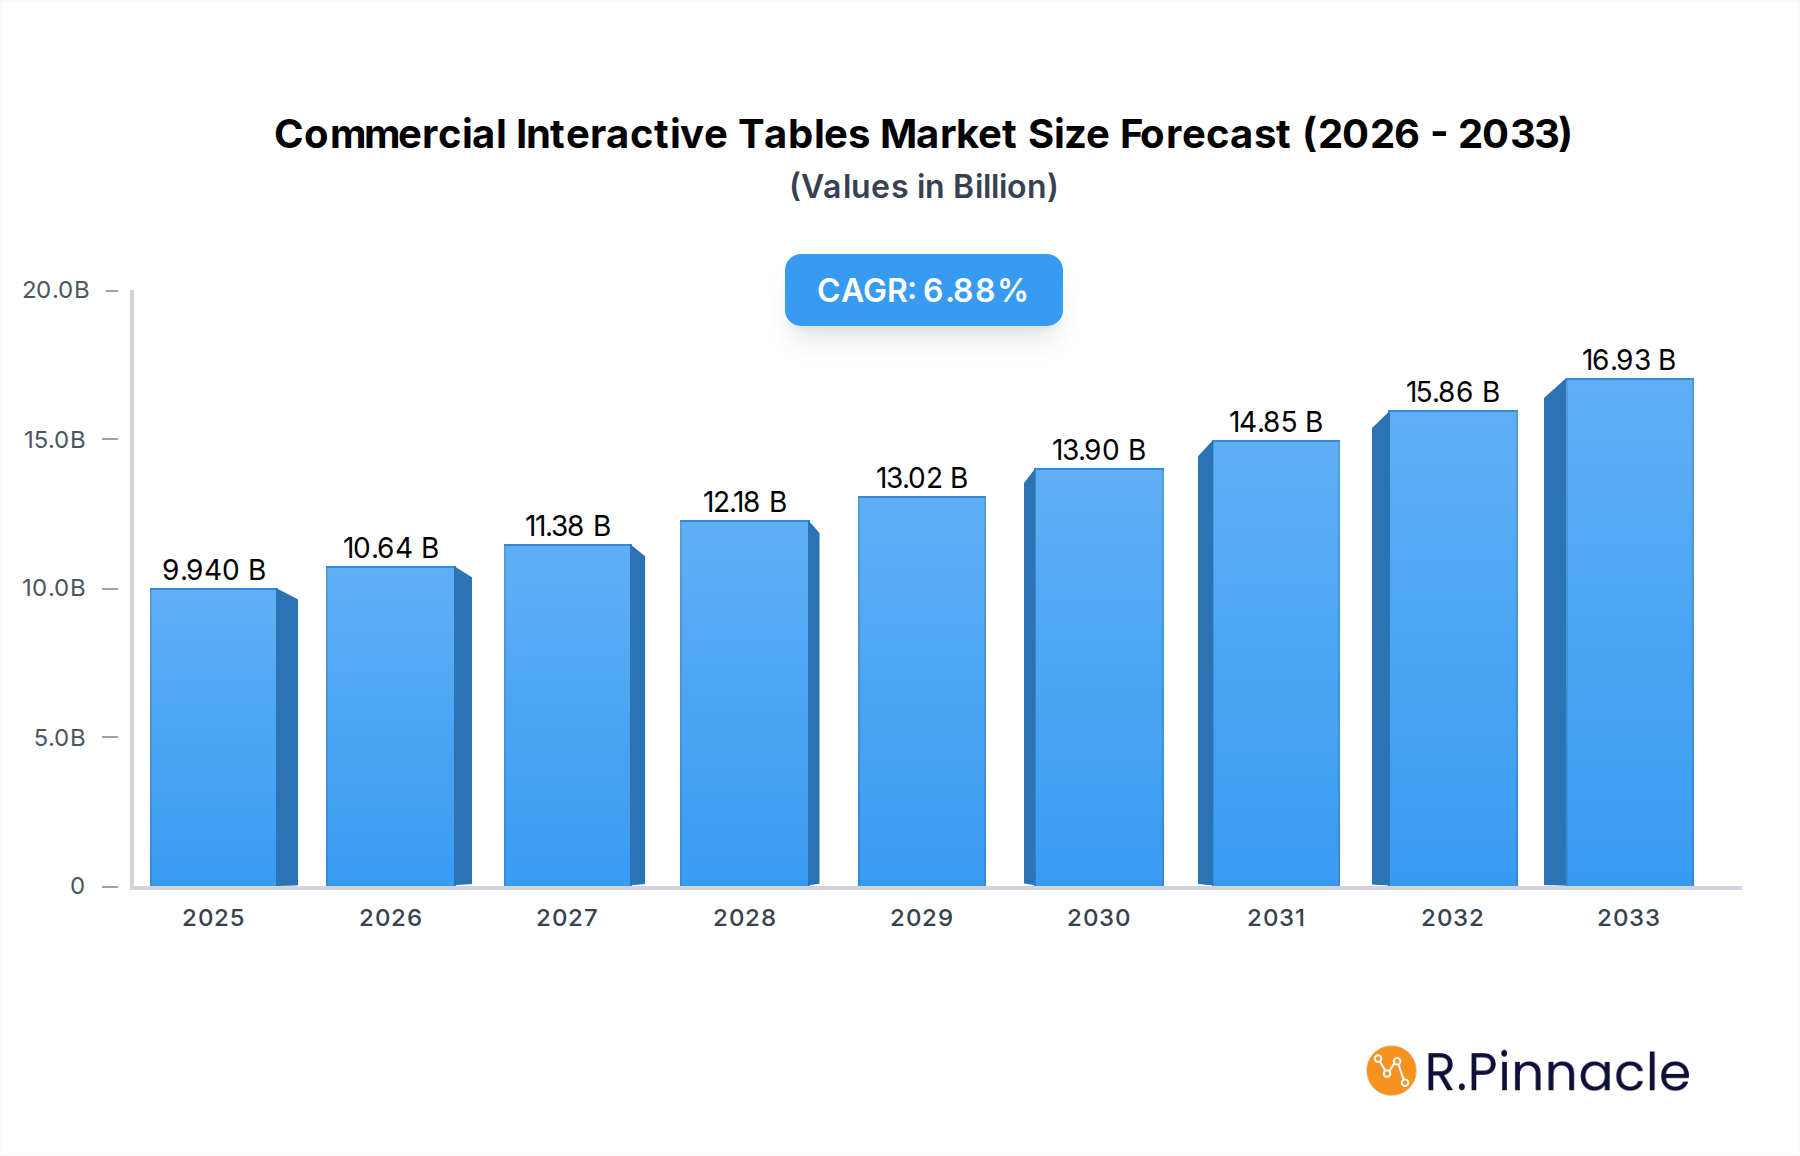
The global Commercial Interactive Tables market is poised for robust expansion, projected to reach USD 9.94 billion in 2025 and exhibit a significant Compound Annual Growth Rate (CAGR) of 7.08% throughout the forecast period of 2025-2033. This upward trajectory is fueled by a confluence of technological advancements and increasing demand across diverse commercial sectors. Key drivers include the growing adoption of immersive and collaborative technologies in retail environments for enhanced customer engagement and product visualization, as well as the burgeoning need for advanced collaborative tools in corporate settings to facilitate brainstorming, design, and remote teamwork. The transportation sector is increasingly leveraging interactive tables for passenger information systems and operational management, while healthcare is exploring their utility in patient education and surgical planning. Furthermore, the hospitality industry is integrating them for interactive guest services and entertainment, and museums are adopting them to provide richer, more engaging visitor experiences. These evolving use cases are creating a dynamic market landscape with substantial growth opportunities.

Commercial Interactive Tables Market Size (In Billion)
The market's growth is further propelled by several prevailing trends, including the integration of artificial intelligence (AI) and machine learning (ML) to provide personalized user experiences and predictive analytics. The miniaturization and increased affordability of components are also contributing to wider adoption. However, the market also faces certain restraints, such as the high initial investment cost associated with sophisticated interactive table solutions, which can be a barrier for small and medium-sized enterprises. Concerns regarding data security and privacy, especially in corporate and healthcare applications, also require careful consideration and robust solutions. Despite these challenges, the continuous innovation in display technologies, such as higher resolutions and improved touch sensitivity, alongside the development of intuitive user interfaces, will continue to drive market penetration and solidify the position of commercial interactive tables as a vital tool for modern businesses seeking to enhance engagement, collaboration, and operational efficiency.
Commercial Interactive Tables Company Market Share
Unlocking the Future of Collaboration and Customer Engagement: The Definitive Commercial Interactive Tables Market Report (2019–2033)
Gain unparalleled insights into the rapidly evolving Commercial Interactive Tables market. This comprehensive report, spanning from 2019 to 2033, provides a data-driven analysis of market structure, dynamics, key players, and future trends. Discover how leading companies like SMART Technologies, Microsoft Surface Hub, Promethean, Ideum, KAPSYS, HANNSPREE, Meridian Kiosks, NCR Interactive Solutions, Sharp Electronics Corporation, Samsung Electronics Co. Ltd., TouchIT Technologies, DynaTouch, Four Winds Interactive, TouchSource, Intuilab, MultiTaction, Planar Systems Inc., Garamantis GmbH, Foyer Pro, and Circle Technology are shaping the industry. With a base year of 2025 and a forecast period extending to 2033, this report is your essential guide to navigating market opportunities and challenges in retail, corporate, transportation, healthcare, hospitality, museum, and other critical sectors.
Commercial Interactive Tables Market Structure & Innovation Trends
The commercial interactive tables market exhibits a moderate to high degree of market concentration, with several key players holding significant market share. Innovation drivers are primarily fueled by advancements in touch technology, AI integration for enhanced user experience, and the demand for more immersive and collaborative environments. Regulatory frameworks, particularly concerning data privacy and accessibility standards, are becoming increasingly influential. Product substitutes, such as traditional displays and whiteboards, are continuously being challenged by the superior functionality and engagement offered by interactive tables. End-user demographics are diversifying, with a growing adoption among educational institutions, design firms, and public spaces. Mergers and acquisitions (M&A) activities are strategically shaping the market landscape, with estimated M&A deal values in the hundreds of billions of dollars, as companies seek to expand their product portfolios and market reach. Key M&A activities are projected to consolidate market share in the coming years, with a focus on acquiring innovative technologies and established customer bases.
Commercial Interactive Tables Market Dynamics & Trends
The global commercial interactive tables market is poised for substantial growth, driven by an escalating demand for enhanced collaboration, streamlined operations, and engaging customer experiences across diverse industries. The projected Compound Annual Growth Rate (CAGR) for the forecast period is estimated to be XX%, indicating a robust expansion trajectory. Market penetration is steadily increasing, particularly within the corporate and retail sectors, as businesses recognize the transformative potential of these intuitive interfaces. Technological disruptions, including the integration of AI for personalized interactions and advanced analytics, are revolutionizing how users engage with information and each other. Consumer preferences are shifting towards more interactive and intuitive solutions, moving away from static displays and towards dynamic, touch-enabled surfaces that foster collaboration and simplify complex tasks. Competitive dynamics are characterized by a blend of established technology giants and agile innovators, all vying for market dominance through product differentiation, strategic partnerships, and aggressive market penetration strategies. The increasing affordability and accessibility of these technologies, coupled with a growing understanding of their ROI, are accelerating adoption rates. Furthermore, the rise of remote and hybrid work models is fueling the demand for collaborative tools, positioning interactive tables as essential components of modern office environments. The hospitality and retail sectors are leveraging these tables for enhanced customer engagement, offering interactive menus, product showcases, and personalized service. In transportation hubs and museums, interactive tables are transforming the visitor experience, providing engaging wayfinding, informative exhibits, and seamless access to data.
Dominant Regions & Segments in Commercial Interactive Tables
North America currently stands as the dominant region in the Commercial Interactive Tables market, driven by a strong economic foundation, early adoption of advanced technologies, and significant investments in digital transformation initiatives across various sectors. Within North America, the United States leads in market size and innovation, supported by robust corporate spending, government initiatives promoting digital infrastructure, and a high concentration of technology-forward companies.
- Key Drivers of Dominance in North America:
- Economic Policies: Favorable business environments and significant R&D investment.
- Infrastructure: Advanced digital and communication infrastructure facilitating seamless integration.
- Technological Adoption: High propensity for adopting new technologies in business and public services.
- Enterprise Spending: Strong willingness of corporations to invest in tools that enhance productivity and collaboration.
The Corporate application segment is exhibiting the most significant dominance globally, largely due to the increasing need for collaborative workspaces, efficient meeting solutions, and interactive data visualization in modern business environments.
- Key Drivers of Corporate Segment Dominance:
- Remote Work Solutions: Facilitating seamless collaboration in hybrid and remote work settings.
- Productivity Enhancement: Streamlining decision-making processes and project management.
- Data Visualization: Enabling clearer understanding and interaction with complex data sets.
- Client Engagement: Providing impactful presentations and interactive client experiences.
The LCD display type is the leading segment within the Commercial Interactive Tables market, owing to its mature technology, cost-effectiveness, superior image quality, and wide availability.
- Key Drivers of LCD Segment Dominance:
- Cost-Effectiveness: Offering a compelling value proposition for businesses of all sizes.
- Image Quality: Providing clear and vibrant visual displays suitable for various applications.
- Technological Maturity: Well-established manufacturing processes and ongoing improvements in resolution and brightness.
- Versatility: Adaptable to a wide range of sizes and form factors for diverse deployment needs.
Commercial Interactive Tables Product Innovations
Product innovations in commercial interactive tables are primarily focused on enhancing user interaction, integrating AI for intelligent functionalities, and improving durability and connectivity. Developments include ultra-high definition displays, multi-touch capabilities with improved responsiveness, and seamless integration with cloud-based platforms for real-time data sharing and collaboration. These innovations aim to create more intuitive and immersive user experiences, cater to specific industry needs, and provide competitive advantages through features like gesture recognition, advanced haptic feedback, and integrated video conferencing. The market is witnessing a trend towards customizable solutions, allowing businesses to tailor interactive tables to their unique branding and operational requirements, thereby increasing their market fit and appeal.
Report Scope & Segmentation Analysis
This report meticulously segments the Commercial Interactive Tables market across key application areas and display technologies.
- Application Segments: The market is analyzed across Retail, Corporate, Transportation, Healthcare, Hospitality, Museum, and Others. Each segment is projected to witness varying growth rates, with the Corporate segment expected to lead in market size and growth during the forecast period.
- Type Segments: The dominant LCD type is expected to continue its lead, with LED and Others representing growing, albeit smaller, segments. The LCD segment is projected to hold a significant market share of approximately XX% by 2033, driven by its established advantages.
Key Drivers of Commercial Interactive Tables Growth
The growth of the commercial interactive tables market is propelled by several converging factors. Technologically, the relentless advancement in touch-screen technology, coupled with the integration of AI and machine learning for enhanced user experience and data analytics, is a primary driver. Economically, the increasing focus on digital transformation and the need for improved collaboration and customer engagement across industries are fueling demand. Regulatory factors, such as government initiatives promoting smart city development and digital infrastructure upgrades, also contribute to market expansion. Furthermore, the rising adoption of remote and hybrid work models necessitates sophisticated collaborative tools, positioning interactive tables as essential components of modern business operations.
Challenges in the Commercial Interactive Tables Sector
Despite the promising growth, the commercial interactive tables sector faces several challenges. High initial investment costs can be a barrier for small and medium-sized enterprises. Supply chain disruptions and the increasing cost of components, particularly for advanced displays and processing units, can impact pricing and availability. Intense competition among established players and new entrants can lead to price wars and squeezed profit margins. Furthermore, the need for specialized software development and integration to fully leverage interactive table capabilities can pose a hurdle for some organizations. Ensuring data security and privacy in collaborative environments is also a growing concern that requires robust solutions.
Emerging Opportunities in Commercial Interactive Tables
Emerging opportunities in the commercial interactive tables market are abundant, driven by innovation and evolving consumer and business needs. The expansion into untapped markets like education and gaming presents significant potential. The integration of augmented reality (AR) and virtual reality (VR) capabilities with interactive tables promises to create even more immersive and engaging experiences. The increasing demand for personalized customer journeys in retail and hospitality is creating opportunities for smart, data-driven interactive solutions. Furthermore, the development of eco-friendly and energy-efficient interactive table designs aligns with growing environmental consciousness and offers a competitive edge. The burgeoning smart building and smart city initiatives globally are also opening up new avenues for deployment in public spaces and infrastructure.
Leading Players in the Commercial Interactive Tables Market
- SMART Technologies
- Microsoft Surface Hub
- Promethean
- Ideum
- KAPSYS
- HANNSPREE
- Meridian Kiosks
- NCR Interactive Solutions
- Sharp Electronics Corporation
- Samsung Electronics Co. Ltd.
- TouchIT Technologies
- DynaTouch
- Four Winds Interactive
- TouchSource
- Intuilab
- MultiTaction
- Planar Systems Inc.
- Garamantis GmbH
- Foyer Pro
- Circle Technology
Key Developments in Commercial Interactive Tables Industry
- 2023/03: Microsoft launches new features for Surface Hub, enhancing collaborative functionalities and AI integration.
- 2023/06: SMART Technologies unveils a new line of interactive flat panels with advanced touch recognition for educational and corporate markets.
- 2023/09: Promethean expands its interactive display portfolio, focusing on user-friendly interfaces for diverse learning and business environments.
- 2023/12: Ideum showcases innovative large-format interactive tables with robust design for high-traffic public spaces.
- 2024/02: Samsung Electronics announces advancements in its interactive display technology, emphasizing immersive visual experiences and connectivity.
- 2024/05: Meridian Kiosks introduces a new range of customized interactive kiosks for retail and hospitality, highlighting modular design and software flexibility.
Future Outlook for Commercial Interactive Tables Market
The future outlook for the commercial interactive tables market is exceptionally bright, characterized by sustained high growth and continuous innovation. The integration of advanced AI, AR, and VR technologies will unlock new levels of interactivity and personalized experiences. As businesses increasingly prioritize hybrid work models and seamless collaboration, the demand for sophisticated interactive solutions will only escalate. Emerging economies are expected to become significant growth hubs, driven by digital transformation initiatives and increasing enterprise adoption. The development of more sustainable and energy-efficient designs will further enhance market appeal. Strategic partnerships and continued M&A activities will shape the competitive landscape, leading to more integrated and comprehensive offerings. The market is projected to reach an estimated value of billions of dollars by 2033, representing a significant opportunity for stakeholders across the value chain.
Commercial Interactive Tables Segmentation
-
1. Application
- 1.1. Retail
- 1.2. Corporate
- 1.3. Transportation
- 1.4. Healthcare
- 1.5. Hospitality
- 1.6. Museum
- 1.7. Others
-
2. Type
- 2.1. LCD
- 2.2. LED
- 2.3. Others
Commercial Interactive Tables Segmentation By Geography
-
1. North America
- 1.1. United States
- 1.2. Canada
- 1.3. Mexico
-
2. South America
- 2.1. Brazil
- 2.2. Argentina
- 2.3. Rest of South America
-
3. Europe
- 3.1. United Kingdom
- 3.2. Germany
- 3.3. France
- 3.4. Italy
- 3.5. Spain
- 3.6. Russia
- 3.7. Benelux
- 3.8. Nordics
- 3.9. Rest of Europe
-
4. Middle East & Africa
- 4.1. Turkey
- 4.2. Israel
- 4.3. GCC
- 4.4. North Africa
- 4.5. South Africa
- 4.6. Rest of Middle East & Africa
-
5. Asia Pacific
- 5.1. China
- 5.2. India
- 5.3. Japan
- 5.4. South Korea
- 5.5. ASEAN
- 5.6. Oceania
- 5.7. Rest of Asia Pacific

Commercial Interactive Tables Regional Market Share
Geographic Coverage of Commercial Interactive Tables
Commercial Interactive Tables REPORT HIGHLIGHTS
| Aspects | Details |
|---|---|
| Study Period | 2020-2034 |
| Base Year | 2025 |
| Estimated Year | 2026 |
| Forecast Period | 2026-2034 |
| Historical Period | 2020-2025 |
| Growth Rate | CAGR of 7.08% from 2020-2034 |
| Segmentation |
|
Table of Contents
- 1. Introduction
- 1.1. Research Scope
- 1.2. Market Segmentation
- 1.3. Research Methodology
- 1.4. Definitions and Assumptions
- 2. Executive Summary
- 2.1. Introduction
- 3. Market Dynamics
- 3.1. Introduction
- 3.2. Market Drivers
- 3.3. Market Restrains
- 3.4. Market Trends
- 4. Market Factor Analysis
- 4.1. Porters Five Forces
- 4.2. Supply/Value Chain
- 4.3. PESTEL analysis
- 4.4. Market Entropy
- 4.5. Patent/Trademark Analysis
- 5. Global Commercial Interactive Tables Analysis, Insights and Forecast, 2020-2032
- 5.1. Market Analysis, Insights and Forecast - by Application
- 5.1.1. Retail
- 5.1.2. Corporate
- 5.1.3. Transportation
- 5.1.4. Healthcare
- 5.1.5. Hospitality
- 5.1.6. Museum
- 5.1.7. Others
- 5.2. Market Analysis, Insights and Forecast - by Type
- 5.2.1. LCD
- 5.2.2. LED
- 5.2.3. Others
- 5.3. Market Analysis, Insights and Forecast - by Region
- 5.3.1. North America
- 5.3.2. South America
- 5.3.3. Europe
- 5.3.4. Middle East & Africa
- 5.3.5. Asia Pacific
- 5.1. Market Analysis, Insights and Forecast - by Application
- 6. North America Commercial Interactive Tables Analysis, Insights and Forecast, 2020-2032
- 6.1. Market Analysis, Insights and Forecast - by Application
- 6.1.1. Retail
- 6.1.2. Corporate
- 6.1.3. Transportation
- 6.1.4. Healthcare
- 6.1.5. Hospitality
- 6.1.6. Museum
- 6.1.7. Others
- 6.2. Market Analysis, Insights and Forecast - by Type
- 6.2.1. LCD
- 6.2.2. LED
- 6.2.3. Others
- 6.1. Market Analysis, Insights and Forecast - by Application
- 7. South America Commercial Interactive Tables Analysis, Insights and Forecast, 2020-2032
- 7.1. Market Analysis, Insights and Forecast - by Application
- 7.1.1. Retail
- 7.1.2. Corporate
- 7.1.3. Transportation
- 7.1.4. Healthcare
- 7.1.5. Hospitality
- 7.1.6. Museum
- 7.1.7. Others
- 7.2. Market Analysis, Insights and Forecast - by Type
- 7.2.1. LCD
- 7.2.2. LED
- 7.2.3. Others
- 7.1. Market Analysis, Insights and Forecast - by Application
- 8. Europe Commercial Interactive Tables Analysis, Insights and Forecast, 2020-2032
- 8.1. Market Analysis, Insights and Forecast - by Application
- 8.1.1. Retail
- 8.1.2. Corporate
- 8.1.3. Transportation
- 8.1.4. Healthcare
- 8.1.5. Hospitality
- 8.1.6. Museum
- 8.1.7. Others
- 8.2. Market Analysis, Insights and Forecast - by Type
- 8.2.1. LCD
- 8.2.2. LED
- 8.2.3. Others
- 8.1. Market Analysis, Insights and Forecast - by Application
- 9. Middle East & Africa Commercial Interactive Tables Analysis, Insights and Forecast, 2020-2032
- 9.1. Market Analysis, Insights and Forecast - by Application
- 9.1.1. Retail
- 9.1.2. Corporate
- 9.1.3. Transportation
- 9.1.4. Healthcare
- 9.1.5. Hospitality
- 9.1.6. Museum
- 9.1.7. Others
- 9.2. Market Analysis, Insights and Forecast - by Type
- 9.2.1. LCD
- 9.2.2. LED
- 9.2.3. Others
- 9.1. Market Analysis, Insights and Forecast - by Application
- 10. Asia Pacific Commercial Interactive Tables Analysis, Insights and Forecast, 2020-2032
- 10.1. Market Analysis, Insights and Forecast - by Application
- 10.1.1. Retail
- 10.1.2. Corporate
- 10.1.3. Transportation
- 10.1.4. Healthcare
- 10.1.5. Hospitality
- 10.1.6. Museum
- 10.1.7. Others
- 10.2. Market Analysis, Insights and Forecast - by Type
- 10.2.1. LCD
- 10.2.2. LED
- 10.2.3. Others
- 10.1. Market Analysis, Insights and Forecast - by Application
- 11. Competitive Analysis
- 11.1. Global Market Share Analysis 2025
- 11.2. Company Profiles
- 11.2.1 SMART Technologies
- 11.2.1.1. Overview
- 11.2.1.2. Products
- 11.2.1.3. SWOT Analysis
- 11.2.1.4. Recent Developments
- 11.2.1.5. Financials (Based on Availability)
- 11.2.2 Microsoft Surface Hub
- 11.2.2.1. Overview
- 11.2.2.2. Products
- 11.2.2.3. SWOT Analysis
- 11.2.2.4. Recent Developments
- 11.2.2.5. Financials (Based on Availability)
- 11.2.3 Promethean
- 11.2.3.1. Overview
- 11.2.3.2. Products
- 11.2.3.3. SWOT Analysis
- 11.2.3.4. Recent Developments
- 11.2.3.5. Financials (Based on Availability)
- 11.2.4 Ideum
- 11.2.4.1. Overview
- 11.2.4.2. Products
- 11.2.4.3. SWOT Analysis
- 11.2.4.4. Recent Developments
- 11.2.4.5. Financials (Based on Availability)
- 11.2.5 KAPSYS
- 11.2.5.1. Overview
- 11.2.5.2. Products
- 11.2.5.3. SWOT Analysis
- 11.2.5.4. Recent Developments
- 11.2.5.5. Financials (Based on Availability)
- 11.2.6 HANNSPREE
- 11.2.6.1. Overview
- 11.2.6.2. Products
- 11.2.6.3. SWOT Analysis
- 11.2.6.4. Recent Developments
- 11.2.6.5. Financials (Based on Availability)
- 11.2.7 Meridian Kiosks
- 11.2.7.1. Overview
- 11.2.7.2. Products
- 11.2.7.3. SWOT Analysis
- 11.2.7.4. Recent Developments
- 11.2.7.5. Financials (Based on Availability)
- 11.2.8 NCR Interactive Solutions
- 11.2.8.1. Overview
- 11.2.8.2. Products
- 11.2.8.3. SWOT Analysis
- 11.2.8.4. Recent Developments
- 11.2.8.5. Financials (Based on Availability)
- 11.2.9 Sharp Electronics Corporation
- 11.2.9.1. Overview
- 11.2.9.2. Products
- 11.2.9.3. SWOT Analysis
- 11.2.9.4. Recent Developments
- 11.2.9.5. Financials (Based on Availability)
- 11.2.10 Samsung Electronics Co. Ltd.
- 11.2.10.1. Overview
- 11.2.10.2. Products
- 11.2.10.3. SWOT Analysis
- 11.2.10.4. Recent Developments
- 11.2.10.5. Financials (Based on Availability)
- 11.2.11 TouchIT Technologies
- 11.2.11.1. Overview
- 11.2.11.2. Products
- 11.2.11.3. SWOT Analysis
- 11.2.11.4. Recent Developments
- 11.2.11.5. Financials (Based on Availability)
- 11.2.12 DynaTouch
- 11.2.12.1. Overview
- 11.2.12.2. Products
- 11.2.12.3. SWOT Analysis
- 11.2.12.4. Recent Developments
- 11.2.12.5. Financials (Based on Availability)
- 11.2.13 Four Winds Interactive
- 11.2.13.1. Overview
- 11.2.13.2. Products
- 11.2.13.3. SWOT Analysis
- 11.2.13.4. Recent Developments
- 11.2.13.5. Financials (Based on Availability)
- 11.2.14 TouchSource
- 11.2.14.1. Overview
- 11.2.14.2. Products
- 11.2.14.3. SWOT Analysis
- 11.2.14.4. Recent Developments
- 11.2.14.5. Financials (Based on Availability)
- 11.2.15 Intuilab
- 11.2.15.1. Overview
- 11.2.15.2. Products
- 11.2.15.3. SWOT Analysis
- 11.2.15.4. Recent Developments
- 11.2.15.5. Financials (Based on Availability)
- 11.2.16 MultiTaction
- 11.2.16.1. Overview
- 11.2.16.2. Products
- 11.2.16.3. SWOT Analysis
- 11.2.16.4. Recent Developments
- 11.2.16.5. Financials (Based on Availability)
- 11.2.17 Planar Systems Inc.
- 11.2.17.1. Overview
- 11.2.17.2. Products
- 11.2.17.3. SWOT Analysis
- 11.2.17.4. Recent Developments
- 11.2.17.5. Financials (Based on Availability)
- 11.2.18 Garamantis GmbH
- 11.2.18.1. Overview
- 11.2.18.2. Products
- 11.2.18.3. SWOT Analysis
- 11.2.18.4. Recent Developments
- 11.2.18.5. Financials (Based on Availability)
- 11.2.19 Foyer Pro
- 11.2.19.1. Overview
- 11.2.19.2. Products
- 11.2.19.3. SWOT Analysis
- 11.2.19.4. Recent Developments
- 11.2.19.5. Financials (Based on Availability)
- 11.2.20 Circle Technology
- 11.2.20.1. Overview
- 11.2.20.2. Products
- 11.2.20.3. SWOT Analysis
- 11.2.20.4. Recent Developments
- 11.2.20.5. Financials (Based on Availability)
- 11.2.1 SMART Technologies
List of Figures
- Figure 1: Global Commercial Interactive Tables Revenue Breakdown (undefined, %) by Region 2025 & 2033
- Figure 2: North America Commercial Interactive Tables Revenue (undefined), by Application 2025 & 2033
- Figure 3: North America Commercial Interactive Tables Revenue Share (%), by Application 2025 & 2033
- Figure 4: North America Commercial Interactive Tables Revenue (undefined), by Type 2025 & 2033
- Figure 5: North America Commercial Interactive Tables Revenue Share (%), by Type 2025 & 2033
- Figure 6: North America Commercial Interactive Tables Revenue (undefined), by Country 2025 & 2033
- Figure 7: North America Commercial Interactive Tables Revenue Share (%), by Country 2025 & 2033
- Figure 8: South America Commercial Interactive Tables Revenue (undefined), by Application 2025 & 2033
- Figure 9: South America Commercial Interactive Tables Revenue Share (%), by Application 2025 & 2033
- Figure 10: South America Commercial Interactive Tables Revenue (undefined), by Type 2025 & 2033
- Figure 11: South America Commercial Interactive Tables Revenue Share (%), by Type 2025 & 2033
- Figure 12: South America Commercial Interactive Tables Revenue (undefined), by Country 2025 & 2033
- Figure 13: South America Commercial Interactive Tables Revenue Share (%), by Country 2025 & 2033
- Figure 14: Europe Commercial Interactive Tables Revenue (undefined), by Application 2025 & 2033
- Figure 15: Europe Commercial Interactive Tables Revenue Share (%), by Application 2025 & 2033
- Figure 16: Europe Commercial Interactive Tables Revenue (undefined), by Type 2025 & 2033
- Figure 17: Europe Commercial Interactive Tables Revenue Share (%), by Type 2025 & 2033
- Figure 18: Europe Commercial Interactive Tables Revenue (undefined), by Country 2025 & 2033
- Figure 19: Europe Commercial Interactive Tables Revenue Share (%), by Country 2025 & 2033
- Figure 20: Middle East & Africa Commercial Interactive Tables Revenue (undefined), by Application 2025 & 2033
- Figure 21: Middle East & Africa Commercial Interactive Tables Revenue Share (%), by Application 2025 & 2033
- Figure 22: Middle East & Africa Commercial Interactive Tables Revenue (undefined), by Type 2025 & 2033
- Figure 23: Middle East & Africa Commercial Interactive Tables Revenue Share (%), by Type 2025 & 2033
- Figure 24: Middle East & Africa Commercial Interactive Tables Revenue (undefined), by Country 2025 & 2033
- Figure 25: Middle East & Africa Commercial Interactive Tables Revenue Share (%), by Country 2025 & 2033
- Figure 26: Asia Pacific Commercial Interactive Tables Revenue (undefined), by Application 2025 & 2033
- Figure 27: Asia Pacific Commercial Interactive Tables Revenue Share (%), by Application 2025 & 2033
- Figure 28: Asia Pacific Commercial Interactive Tables Revenue (undefined), by Type 2025 & 2033
- Figure 29: Asia Pacific Commercial Interactive Tables Revenue Share (%), by Type 2025 & 2033
- Figure 30: Asia Pacific Commercial Interactive Tables Revenue (undefined), by Country 2025 & 2033
- Figure 31: Asia Pacific Commercial Interactive Tables Revenue Share (%), by Country 2025 & 2033
List of Tables
- Table 1: Global Commercial Interactive Tables Revenue undefined Forecast, by Application 2020 & 2033
- Table 2: Global Commercial Interactive Tables Revenue undefined Forecast, by Type 2020 & 2033
- Table 3: Global Commercial Interactive Tables Revenue undefined Forecast, by Region 2020 & 2033
- Table 4: Global Commercial Interactive Tables Revenue undefined Forecast, by Application 2020 & 2033
- Table 5: Global Commercial Interactive Tables Revenue undefined Forecast, by Type 2020 & 2033
- Table 6: Global Commercial Interactive Tables Revenue undefined Forecast, by Country 2020 & 2033
- Table 7: United States Commercial Interactive Tables Revenue (undefined) Forecast, by Application 2020 & 2033
- Table 8: Canada Commercial Interactive Tables Revenue (undefined) Forecast, by Application 2020 & 2033
- Table 9: Mexico Commercial Interactive Tables Revenue (undefined) Forecast, by Application 2020 & 2033
- Table 10: Global Commercial Interactive Tables Revenue undefined Forecast, by Application 2020 & 2033
- Table 11: Global Commercial Interactive Tables Revenue undefined Forecast, by Type 2020 & 2033
- Table 12: Global Commercial Interactive Tables Revenue undefined Forecast, by Country 2020 & 2033
- Table 13: Brazil Commercial Interactive Tables Revenue (undefined) Forecast, by Application 2020 & 2033
- Table 14: Argentina Commercial Interactive Tables Revenue (undefined) Forecast, by Application 2020 & 2033
- Table 15: Rest of South America Commercial Interactive Tables Revenue (undefined) Forecast, by Application 2020 & 2033
- Table 16: Global Commercial Interactive Tables Revenue undefined Forecast, by Application 2020 & 2033
- Table 17: Global Commercial Interactive Tables Revenue undefined Forecast, by Type 2020 & 2033
- Table 18: Global Commercial Interactive Tables Revenue undefined Forecast, by Country 2020 & 2033
- Table 19: United Kingdom Commercial Interactive Tables Revenue (undefined) Forecast, by Application 2020 & 2033
- Table 20: Germany Commercial Interactive Tables Revenue (undefined) Forecast, by Application 2020 & 2033
- Table 21: France Commercial Interactive Tables Revenue (undefined) Forecast, by Application 2020 & 2033
- Table 22: Italy Commercial Interactive Tables Revenue (undefined) Forecast, by Application 2020 & 2033
- Table 23: Spain Commercial Interactive Tables Revenue (undefined) Forecast, by Application 2020 & 2033
- Table 24: Russia Commercial Interactive Tables Revenue (undefined) Forecast, by Application 2020 & 2033
- Table 25: Benelux Commercial Interactive Tables Revenue (undefined) Forecast, by Application 2020 & 2033
- Table 26: Nordics Commercial Interactive Tables Revenue (undefined) Forecast, by Application 2020 & 2033
- Table 27: Rest of Europe Commercial Interactive Tables Revenue (undefined) Forecast, by Application 2020 & 2033
- Table 28: Global Commercial Interactive Tables Revenue undefined Forecast, by Application 2020 & 2033
- Table 29: Global Commercial Interactive Tables Revenue undefined Forecast, by Type 2020 & 2033
- Table 30: Global Commercial Interactive Tables Revenue undefined Forecast, by Country 2020 & 2033
- Table 31: Turkey Commercial Interactive Tables Revenue (undefined) Forecast, by Application 2020 & 2033
- Table 32: Israel Commercial Interactive Tables Revenue (undefined) Forecast, by Application 2020 & 2033
- Table 33: GCC Commercial Interactive Tables Revenue (undefined) Forecast, by Application 2020 & 2033
- Table 34: North Africa Commercial Interactive Tables Revenue (undefined) Forecast, by Application 2020 & 2033
- Table 35: South Africa Commercial Interactive Tables Revenue (undefined) Forecast, by Application 2020 & 2033
- Table 36: Rest of Middle East & Africa Commercial Interactive Tables Revenue (undefined) Forecast, by Application 2020 & 2033
- Table 37: Global Commercial Interactive Tables Revenue undefined Forecast, by Application 2020 & 2033
- Table 38: Global Commercial Interactive Tables Revenue undefined Forecast, by Type 2020 & 2033
- Table 39: Global Commercial Interactive Tables Revenue undefined Forecast, by Country 2020 & 2033
- Table 40: China Commercial Interactive Tables Revenue (undefined) Forecast, by Application 2020 & 2033
- Table 41: India Commercial Interactive Tables Revenue (undefined) Forecast, by Application 2020 & 2033
- Table 42: Japan Commercial Interactive Tables Revenue (undefined) Forecast, by Application 2020 & 2033
- Table 43: South Korea Commercial Interactive Tables Revenue (undefined) Forecast, by Application 2020 & 2033
- Table 44: ASEAN Commercial Interactive Tables Revenue (undefined) Forecast, by Application 2020 & 2033
- Table 45: Oceania Commercial Interactive Tables Revenue (undefined) Forecast, by Application 2020 & 2033
- Table 46: Rest of Asia Pacific Commercial Interactive Tables Revenue (undefined) Forecast, by Application 2020 & 2033
Frequently Asked Questions
1. What is the projected Compound Annual Growth Rate (CAGR) of the Commercial Interactive Tables?
The projected CAGR is approximately 7.08%.
2. Which companies are prominent players in the Commercial Interactive Tables?
Key companies in the market include SMART Technologies, Microsoft Surface Hub, Promethean, Ideum, KAPSYS, HANNSPREE, Meridian Kiosks, NCR Interactive Solutions, Sharp Electronics Corporation, Samsung Electronics Co. Ltd., TouchIT Technologies, DynaTouch, Four Winds Interactive, TouchSource, Intuilab, MultiTaction, Planar Systems Inc., Garamantis GmbH, Foyer Pro, Circle Technology.
3. What are the main segments of the Commercial Interactive Tables?
The market segments include Application, Type.
4. Can you provide details about the market size?
The market size is estimated to be USD XXX N/A as of 2022.
5. What are some drivers contributing to market growth?
N/A
6. What are the notable trends driving market growth?
N/A
7. Are there any restraints impacting market growth?
N/A
8. Can you provide examples of recent developments in the market?
N/A
9. What pricing options are available for accessing the report?
Pricing options include single-user, multi-user, and enterprise licenses priced at USD 2900.00, USD 4350.00, and USD 5800.00 respectively.
10. Is the market size provided in terms of value or volume?
The market size is provided in terms of value, measured in N/A.
11. Are there any specific market keywords associated with the report?
Yes, the market keyword associated with the report is "Commercial Interactive Tables," which aids in identifying and referencing the specific market segment covered.
12. How do I determine which pricing option suits my needs best?
The pricing options vary based on user requirements and access needs. Individual users may opt for single-user licenses, while businesses requiring broader access may choose multi-user or enterprise licenses for cost-effective access to the report.
13. Are there any additional resources or data provided in the Commercial Interactive Tables report?
While the report offers comprehensive insights, it's advisable to review the specific contents or supplementary materials provided to ascertain if additional resources or data are available.
14. How can I stay updated on further developments or reports in the Commercial Interactive Tables?
To stay informed about further developments, trends, and reports in the Commercial Interactive Tables, consider subscribing to industry newsletters, following relevant companies and organizations, or regularly checking reputable industry news sources and publications.
Methodology
Step 1 - Identification of Relevant Samples Size from Population Database


Step 2 - Approaches for Defining Global Market Size (Value, Volume* & Price*)

Note*: In applicable scenarios
Step 3 - Data Sources
Primary Research
- Web Analytics
- Survey Reports
- Research Institute
- Latest Research Reports
- Opinion Leaders
Secondary Research
- Annual Reports
- White Paper
- Latest Press Release
- Industry Association
- Paid Database
- Investor Presentations

Step 4 - Data Triangulation
Involves using different sources of information in order to increase the validity of a study
These sources are likely to be stakeholders in a program - participants, other researchers, program staff, other community members, and so on.
Then we put all data in single framework & apply various statistical tools to find out the dynamic on the market.
During the analysis stage, feedback from the stakeholder groups would be compared to determine areas of agreement as well as areas of divergence