

Key Insights
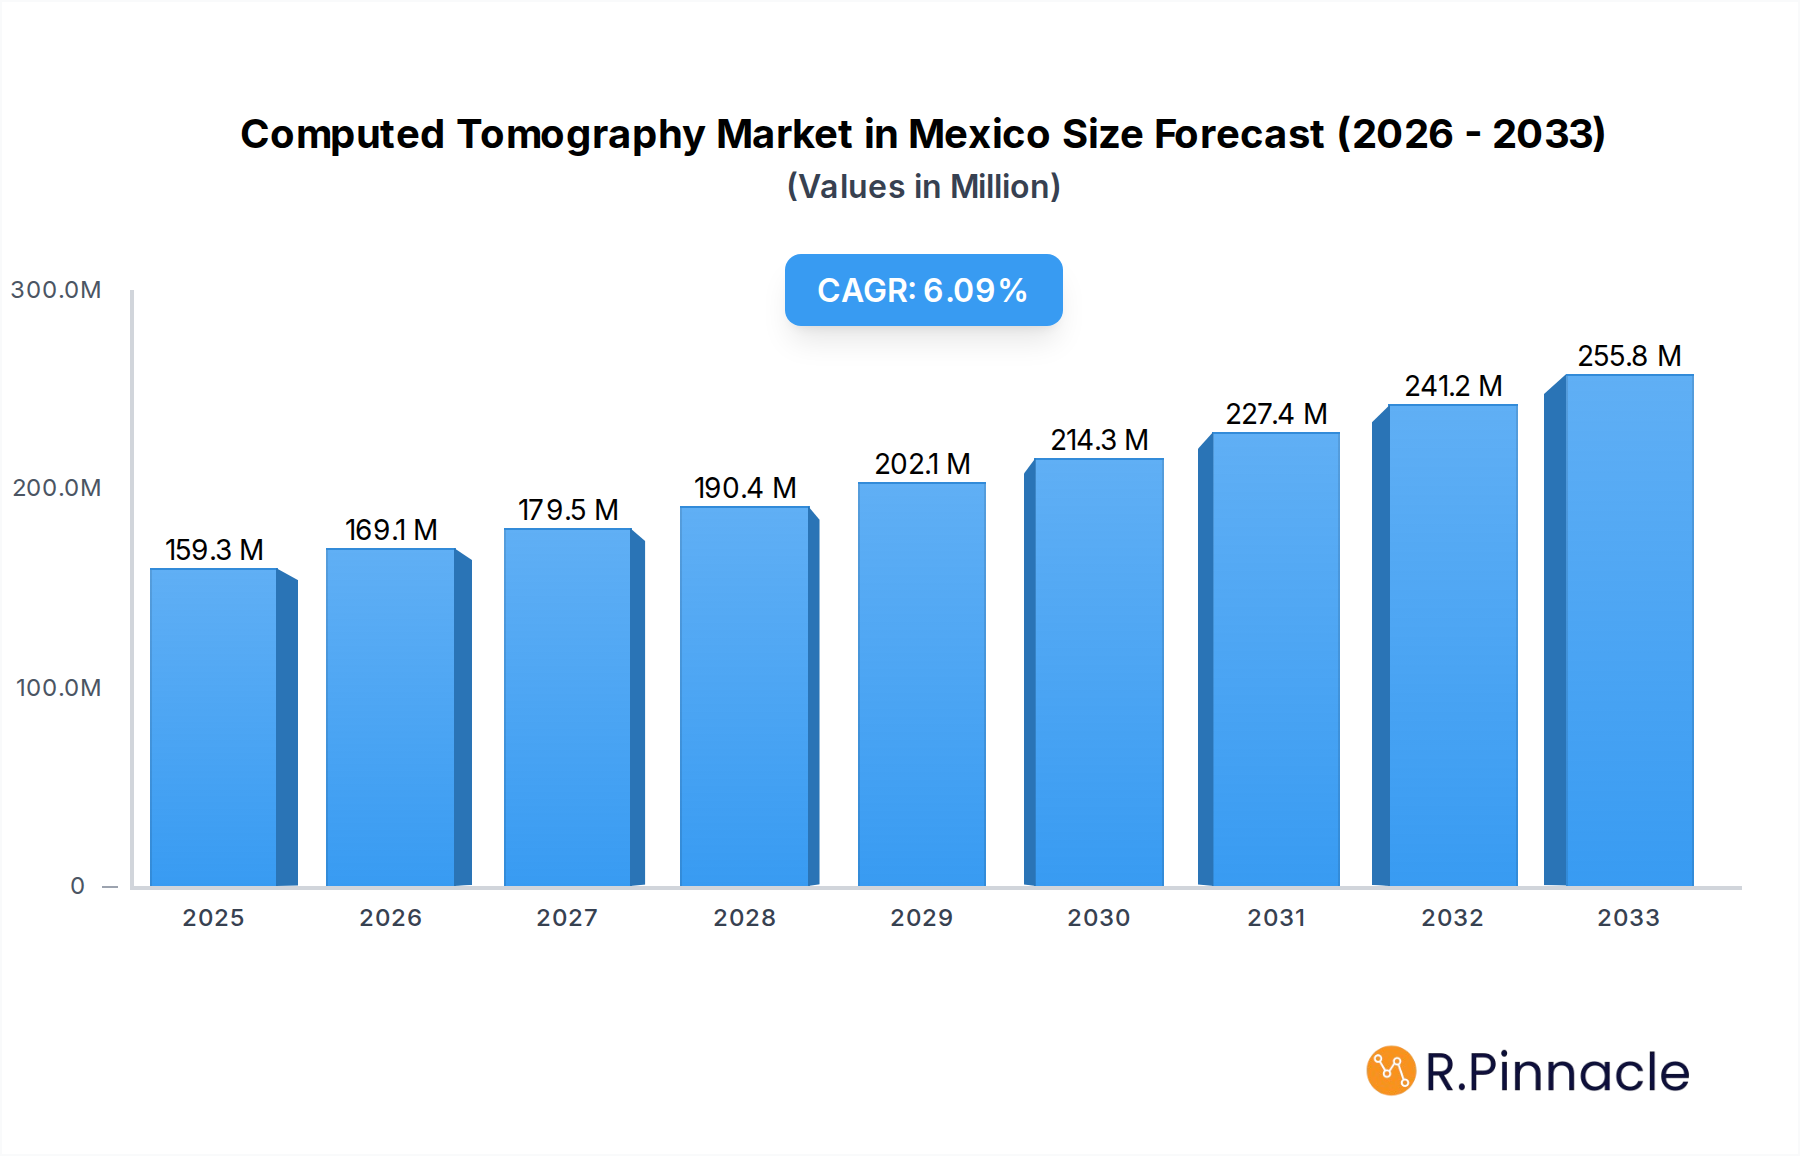
The Computed Tomography (CT) market in Mexico is poised for significant expansion, driven by an increasing demand for advanced diagnostic imaging solutions. With a current estimated market size of $159.35 million and a projected Compound Annual Growth Rate (CAGR) of 6.25%, the market is expected to reach substantial figures by 2033. This growth is fueled by the rising prevalence of chronic diseases, particularly cardiovascular and oncological conditions, which necessitate precise and early diagnosis through CT scans. Furthermore, investments in healthcare infrastructure and the growing adoption of cutting-edge CT technologies, such as dual-energy and photon-counting CT, are playing a crucial role in market expansion. The increasing focus on preventive healthcare and the expanding network of diagnostic centers across Mexico are also contributing to a more robust demand for CT equipment and services.

Computed Tomography Market in Mexico Market Size (In Million)
The Mexican CT market is segmented by slice count, application, and end-user. High-slice CT scanners, offering superior resolution and faster scan times, are expected to witness substantial adoption, particularly in specialized applications like oncology and neurology. The application segment is largely dominated by oncology, followed by neurology and cardiovascular imaging, reflecting the country's leading health concerns. Hospitals represent the largest end-user segment, owing to their comprehensive diagnostic capabilities and the high volume of patient throughput. While restraints such as high capital expenditure for advanced CT systems and the need for skilled radiographers exist, the continuous technological advancements, government initiatives promoting healthcare access, and the increasing purchasing power of the population are expected to propel the market forward. Key players like Siemens Healthineers AG, GE Healthcare, and Philips are actively engaged in expanding their presence and product portfolios within Mexico to cater to the evolving market demands.
Computed Tomography Market in Mexico Company Market Share
This in-depth report offers a definitive analysis of the Computed Tomography (CT) market in Mexico, providing critical insights for stakeholders seeking to capitalize on this rapidly evolving sector. Covering the historical period of 2019-2024, a robust base year of 2025, and an extensive forecast period from 2025 to 2033, this report delves into market structure, dynamics, dominant segments, product innovations, and future outlook. Leveraging high-ranking keywords such as "Mexico CT scan market," "Computed Tomography Mexico," "medical imaging Mexico," and "diagnostic imaging market," this report is optimized for search engines and designed to engage industry professionals, including healthcare providers, medical device manufacturers, investors, and regulatory bodies.
Computed Tomography Market in Mexico Market Structure & Innovation Trends
The Computed Tomography market in Mexico exhibits a moderately concentrated structure, with key global players like GE Healthcare, Siemens Healthineers AG, and Canon Medical Systems Corporation holding significant market shares. Innovation is driven by advancements in imaging technology, including AI-powered image reconstruction, reduced radiation doses, and multi-detector CT (MDCT) systems, crucial for improved diagnostic accuracy across various applications. The regulatory framework, primarily governed by the Mexican Ministry of Health (Secretaría de Salud), focuses on patient safety and device efficacy, influencing market entry and product approvals. Substitutes, such as MRI and ultrasound, offer alternative imaging modalities but often lack the speed and versatility of CT for emergency diagnostics and skeletal imaging. End-user demographics are shifting towards an aging population with a higher prevalence of chronic diseases, increasing the demand for diagnostic imaging. Mergers and acquisitions, while not extensively prevalent, are strategic opportunities for consolidating market presence and expanding product portfolios. The total market size is projected to reach an estimated $700 Million by 2025, with M&A deal values ranging from $10 Million to $50 Million for strategic acquisitions.
Computed Tomography Market in Mexico Market Dynamics & Trends
The Computed Tomography market in Mexico is poised for significant expansion, driven by a confluence of compelling growth drivers and transformative trends. The increasing prevalence of chronic diseases, including cardiovascular conditions and cancer, is a primary catalyst, necessitating advanced diagnostic tools like CT scanners for early detection and precise treatment planning. For instance, the demand for oncology CT scans is projected to grow at a Compound Annual Growth Rate (CAGR) of approximately 7.5% through the forecast period. Technological advancements are revolutionizing the CT landscape. The integration of Artificial Intelligence (AI) into CT scanners is enhancing image quality, reducing scan times, and improving diagnostic accuracy. Furthermore, the development of low-dose CT technologies addresses concerns regarding radiation exposure, making CT scans a safer and more accessible diagnostic option for a broader patient population.
Consumer preferences are increasingly leaning towards minimally invasive diagnostic procedures and faster turnaround times for results. CT scans, with their speed and comprehensive imaging capabilities, align perfectly with these expectations. The growing awareness among the Mexican population regarding the importance of early disease detection is also contributing to market growth.
Competitive dynamics are characterized by intense innovation and strategic partnerships. Leading global manufacturers are investing heavily in research and development to introduce next-generation CT systems with enhanced functionalities. The market penetration of advanced CT technologies, particularly in urban centers, is steadily increasing. However, the market also faces challenges related to the high cost of advanced CT equipment and the need for skilled personnel to operate and interpret scans, especially in rural areas. The overall market size is estimated to reach $1,200 Million by 2033, with an estimated CAGR of around 6.8% during the forecast period.
Dominant Regions & Segments in Computed Tomography Market in Mexico
The Computed Tomography market in Mexico is most prominently dominated by the Hospitals end-user segment. This dominance stems from several key factors:
- Infrastructure and Equipment Investment: Hospitals, particularly tertiary care facilities and large public health institutions, are the primary hubs for advanced medical equipment acquisition, including sophisticated CT scanners. They possess the financial capacity and patient volume to justify the substantial investment in high-slice CT systems.
- Comprehensive Diagnostic Services: Hospitals offer a full spectrum of diagnostic imaging services, making CT scans an integral part of their radiology departments. The ability to perform a wide range of CT procedures, from routine diagnostics to interventional radiology, solidifies their position.
- Patient Flow and Referral Networks: Hospitals receive a continuous influx of patients, both emergency and elective, necessitating rapid and accurate diagnostic tools. They also serve as referral centers for smaller clinics and diagnostic centers, further driving CT utilization.
- Specialized Applications: The need for CT scans in critical care, trauma, and complex surgical procedures is highest within hospital settings, directly contributing to their leading role in CT market penetration.
Within the Application segment, Oncology stands out as a major driver of CT market growth in Mexico.
- Cancer Burden: Mexico faces a significant and growing burden of various cancers, including breast, lung, and colorectal cancer. CT plays a crucial role in cancer diagnosis, staging, treatment planning, and monitoring treatment response.
- Early Detection Initiatives: Public and private initiatives aimed at early cancer detection significantly boost the demand for CT scans.
- Advanced Treatment Modalities: The widespread adoption of precision medicine and targeted therapies in oncology relies heavily on accurate CT imaging for treatment guidance and efficacy assessment.
The High Slice CT segment, representing advanced multi-detector CT (MDCT) scanners, also exhibits strong growth and dominance.
- Diagnostic Precision: High-slice CT scanners offer superior spatial resolution and faster scan times, enabling detailed visualization of anatomical structures and pathologies, which is critical for diagnosing complex conditions in neurology, cardiology, and oncology.
- Technological Adoption: Leading hospitals and diagnostic centers are prioritizing the adoption of the latest high-slice CT technology to offer state-of-the-art diagnostic services and remain competitive.
- Procedural Advancements: The development of advanced CT applications, such as CT angiography and CT colonography, further propels the demand for high-slice systems.
The Neurology and Cardiovascular applications are also significant contributors, driven by the rising incidence of stroke, neurodegenerative diseases, and cardiovascular diseases in the Mexican population. The market size for these segments is estimated to be in the hundreds of Millions, with a projected CAGR of approximately 7.0% for Oncology and 6.5% for Neurology and Cardiovascular applications.
Computed Tomography Market in Mexico Product Innovations
Product innovation in Mexico's Computed Tomography market centers on enhancing diagnostic capabilities and patient safety. Manufacturers are focusing on developing CT scanners with AI-powered image reconstruction algorithms that deliver superior image quality at lower radiation doses, appealing to the growing concern for patient safety. Innovations include spectral CT, which provides material decomposition information, aiding in precise tissue characterization for oncology and cardiovascular applications. Furthermore, the development of more compact and affordable CT systems is aimed at expanding access to advanced imaging in underserved regions and smaller diagnostic centers, thereby broadening market reach and improving diagnostic accessibility. Competitive advantages are being forged through enhanced workflow automation and integration with PACS (Picture Archiving and Communication Systems) for seamless data management.
Report Scope & Segmentation Analysis
This report meticulously segments the Computed Tomography market in Mexico across key parameters to provide granular insights. The Type segmentation includes Low Slice, Medium Slice, and High Slice CT scanners, with High Slice systems projected to lead due to increasing demand for advanced diagnostics. The Application segmentation covers Oncology, Neurology, Cardiovascular, Musculoskeletal, and Other Applications. Oncology and Neurology are expected to exhibit the highest growth rates, driven by disease prevalence. The End User segmentation encompasses Hospitals, Diagnostic Centers, and Other End Users. Hospitals are anticipated to remain the dominant end-user segment due to their comprehensive infrastructure and patient volume. Market sizes for each segment are projected to be in the hundreds of Millions, with specific growth rates detailed in the full report.
Key Drivers of Computed Tomography Market in Mexico Growth
The Computed Tomography market in Mexico is propelled by several key drivers. Increasing prevalence of chronic diseases such as cancer and cardiovascular conditions necessitates advanced diagnostic imaging. Technological advancements, including AI integration, low-dose CT, and improved image resolution, are enhancing diagnostic accuracy and patient safety. Growing healthcare expenditure by both government and private entities is enabling greater investment in medical infrastructure. Government initiatives and awareness campaigns promoting early disease detection are further stimulating demand. The expanding medical tourism sector in Mexico also contributes to the demand for high-quality diagnostic services.
Challenges in the Computed Tomography Market in Mexico Sector
Despite its growth potential, the Computed Tomography market in Mexico faces several challenges. The high cost of advanced CT equipment and maintenance presents a significant barrier, particularly for smaller healthcare facilities and in rural areas. Shortage of skilled radiologists and technicians capable of operating and interpreting complex CT scans can hinder efficient utilization. Regulatory hurdles and lengthy approval processes for new devices can slow down market entry. The presence of counterfeit or substandard medical equipment poses a threat to patient safety and market integrity. Limited healthcare infrastructure in remote regions restricts the widespread adoption of CT technology.
Emerging Opportunities in Computed Tomography Market in Mexico
The Computed Tomography market in Mexico is brimming with emerging opportunities. The development and adoption of portable and point-of-care CT scanners can significantly expand access to diagnostics in remote areas and emergency settings. The growing application of CT in preventive healthcare and screening programs offers new avenues for market penetration. Strategic partnerships between technology providers and healthcare institutions can accelerate the adoption of AI-driven diagnostic solutions. The increasing demand for specialized CT applications in fields like interventional radiology and radiation therapy planning presents further growth potential. Furthermore, the expansion of private healthcare facilities and insurance coverage is creating a more favorable environment for investment in advanced medical imaging.
Leading Players in the Computed Tomography Market in Mexico Market
- GE Healthcare
- Dentsply Sirona
- Siemens Healthineers AG
- Canon Medical Systems Corporation (Toshiba Corporation)
- Neusoft Medical Systems Co Ltd
- Carestream Health
- Vatech Inc
- Koninklijke Philips NV
- J Morita Corporation
- Planmeca Group (Planmed OY)
- Samsung Electronics Co Ltd (Samsung Medison)
Key Developments in Computed Tomography Market in Mexico Industry
- September 2020: Nanox and SPI Medical announced an exclusive distribution agreement for the deployment of 630 Nanox.ARC devices in Mexico, aiming to raise the level of healthcare for Mexicans.
- February 2020: A study published in the American Journal of Medicine by S. Scott Obenshain and Barry Ramo highlighted the essential role of CT scans in detecting calcium deposits, acting as markers for artery-clogging cholesterol plaques that can lead to heart attacks.
Future Outlook for Computed Tomography Market in Mexico Market
The future outlook for the Computed Tomography market in Mexico is exceptionally promising, with sustained growth projected through 2033. The increasing burden of non-communicable diseases will continue to drive demand for advanced diagnostic imaging. Key growth accelerators include the further integration of AI and machine learning for enhanced diagnostic capabilities, the development of more affordable and accessible CT technologies to penetrate underserved markets, and the growing emphasis on preventive medicine and early disease detection. Strategic collaborations between global CT manufacturers and local healthcare providers will be crucial for expanding market reach and ensuring the adoption of cutting-edge technologies. The market is expected to witness a shift towards more specialized CT applications and a greater focus on value-based healthcare delivery, further solidifying its upward trajectory.
Computed Tomography Market in Mexico Segmentation
-
1. Type
- 1.1. Low Slice
- 1.2. Medium Slice
- 1.3. High Slice
-
2. Application
- 2.1. Oncology
- 2.2. Neurology
- 2.3. Cardiovascular
- 2.4. Musculoskeletal
- 2.5. Other Applications
-
3. End User
- 3.1. Hospitals
- 3.2. Diagnostic Centers
- 3.3. Other End Users
Computed Tomography Market in Mexico Segmentation By Geography
-
1. North America
- 1.1. United States
- 1.2. Canada
- 1.3. Mexico
-
2. South America
- 2.1. Brazil
- 2.2. Argentina
- 2.3. Rest of South America
-
3. Europe
- 3.1. United Kingdom
- 3.2. Germany
- 3.3. France
- 3.4. Italy
- 3.5. Spain
- 3.6. Russia
- 3.7. Benelux
- 3.8. Nordics
- 3.9. Rest of Europe
-
4. Middle East & Africa
- 4.1. Turkey
- 4.2. Israel
- 4.3. GCC
- 4.4. North Africa
- 4.5. South Africa
- 4.6. Rest of Middle East & Africa
-
5. Asia Pacific
- 5.1. China
- 5.2. India
- 5.3. Japan
- 5.4. South Korea
- 5.5. ASEAN
- 5.6. Oceania
- 5.7. Rest of Asia Pacific
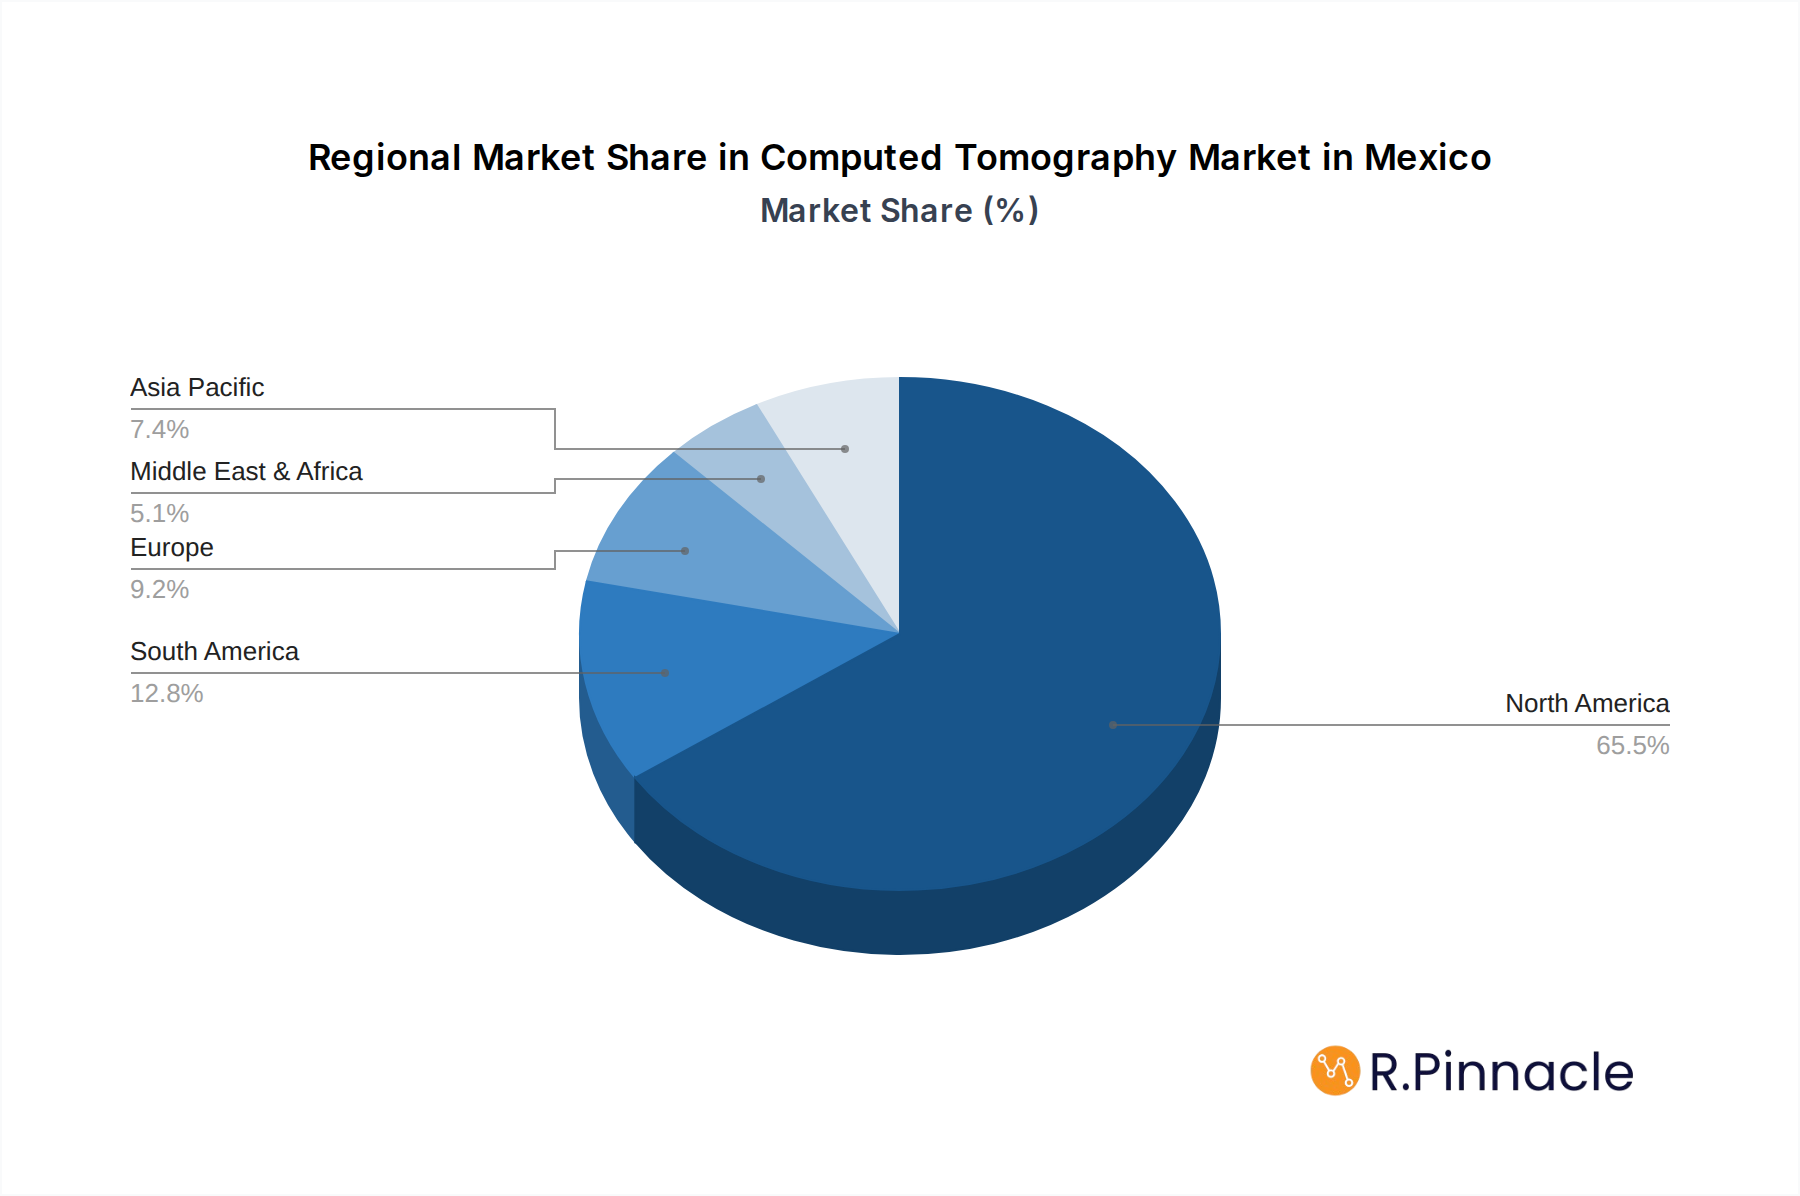
Computed Tomography Market in Mexico Regional Market Share
Geographic Coverage of Computed Tomography Market in Mexico
Computed Tomography Market in Mexico REPORT HIGHLIGHTS
| Aspects | Details |
|---|---|
| Study Period | 2020-2034 |
| Base Year | 2025 |
| Estimated Year | 2026 |
| Forecast Period | 2026-2034 |
| Historical Period | 2020-2025 |
| Growth Rate | CAGR of 6.25% from 2020-2034 |
| Segmentation |
|
Table of Contents
- 1. Introduction
- 1.1. Research Scope
- 1.2. Market Segmentation
- 1.3. Research Objective
- 1.4. Definitions and Assumptions
- 2. Executive Summary
- 2.1. Market Snapshot
- 3. Market Dynamics
- 3.1. Market Drivers
- 3.2. Market Restrains
- 3.3. Market Trends
- 3.4. Market Opportunities
- 4. Market Factor Analysis
- 4.1. Porters Five Forces
- 4.1.1. Bargaining Power of Suppliers
- 4.1.2. Bargaining Power of Buyers
- 4.1.3. Threat of New Entrants
- 4.1.4. Threat of Substitutes
- 4.1.5. Competitive Rivalry
- 4.2. PESTEL analysis
- 4.3. BCG Analysis
- 4.3.1. Stars (High Growth, High Market Share)
- 4.3.2. Cash Cows (Low Growth, High Market Share)
- 4.3.3. Question Mark (High Growth, Low Market Share)
- 4.3.4. Dogs (Low Growth, Low Market Share)
- 4.4. Ansoff Matrix Analysis
- 4.5. Supply Chain Analysis
- 4.6. Regulatory Landscape
- 4.7. Current Market Potential and Opportunity Assessment (TAM–SAM–SOM Framework)
- 4.8. PRI Analyst Note
- 4.1. Porters Five Forces
- 5. Market Analysis, Insights and Forecast 2021-2033
- 5.1. Market Analysis, Insights and Forecast - by Type
- 5.1.1. Low Slice
- 5.1.2. Medium Slice
- 5.1.3. High Slice
- 5.2. Market Analysis, Insights and Forecast - by Application
- 5.2.1. Oncology
- 5.2.2. Neurology
- 5.2.3. Cardiovascular
- 5.2.4. Musculoskeletal
- 5.2.5. Other Applications
- 5.3. Market Analysis, Insights and Forecast - by End User
- 5.3.1. Hospitals
- 5.3.2. Diagnostic Centers
- 5.3.3. Other End Users
- 5.4. Market Analysis, Insights and Forecast - by Region
- 5.4.1. North America
- 5.4.2. South America
- 5.4.3. Europe
- 5.4.4. Middle East & Africa
- 5.4.5. Asia Pacific
- 5.1. Market Analysis, Insights and Forecast - by Type
- 6. Global Computed Tomography Market in Mexico Analysis, Insights and Forecast, 2021-2033
- 6.1. Market Analysis, Insights and Forecast - by Type
- 6.1.1. Low Slice
- 6.1.2. Medium Slice
- 6.1.3. High Slice
- 6.2. Market Analysis, Insights and Forecast - by Application
- 6.2.1. Oncology
- 6.2.2. Neurology
- 6.2.3. Cardiovascular
- 6.2.4. Musculoskeletal
- 6.2.5. Other Applications
- 6.3. Market Analysis, Insights and Forecast - by End User
- 6.3.1. Hospitals
- 6.3.2. Diagnostic Centers
- 6.3.3. Other End Users
- 6.1. Market Analysis, Insights and Forecast - by Type
- 7. North America Computed Tomography Market in Mexico Analysis, Insights and Forecast, 2020-2032
- 7.1. Market Analysis, Insights and Forecast - by Type
- 7.1.1. Low Slice
- 7.1.2. Medium Slice
- 7.1.3. High Slice
- 7.2. Market Analysis, Insights and Forecast - by Application
- 7.2.1. Oncology
- 7.2.2. Neurology
- 7.2.3. Cardiovascular
- 7.2.4. Musculoskeletal
- 7.2.5. Other Applications
- 7.3. Market Analysis, Insights and Forecast - by End User
- 7.3.1. Hospitals
- 7.3.2. Diagnostic Centers
- 7.3.3. Other End Users
- 7.1. Market Analysis, Insights and Forecast - by Type
- 8. South America Computed Tomography Market in Mexico Analysis, Insights and Forecast, 2020-2032
- 8.1. Market Analysis, Insights and Forecast - by Type
- 8.1.1. Low Slice
- 8.1.2. Medium Slice
- 8.1.3. High Slice
- 8.2. Market Analysis, Insights and Forecast - by Application
- 8.2.1. Oncology
- 8.2.2. Neurology
- 8.2.3. Cardiovascular
- 8.2.4. Musculoskeletal
- 8.2.5. Other Applications
- 8.3. Market Analysis, Insights and Forecast - by End User
- 8.3.1. Hospitals
- 8.3.2. Diagnostic Centers
- 8.3.3. Other End Users
- 8.1. Market Analysis, Insights and Forecast - by Type
- 9. Europe Computed Tomography Market in Mexico Analysis, Insights and Forecast, 2020-2032
- 9.1. Market Analysis, Insights and Forecast - by Type
- 9.1.1. Low Slice
- 9.1.2. Medium Slice
- 9.1.3. High Slice
- 9.2. Market Analysis, Insights and Forecast - by Application
- 9.2.1. Oncology
- 9.2.2. Neurology
- 9.2.3. Cardiovascular
- 9.2.4. Musculoskeletal
- 9.2.5. Other Applications
- 9.3. Market Analysis, Insights and Forecast - by End User
- 9.3.1. Hospitals
- 9.3.2. Diagnostic Centers
- 9.3.3. Other End Users
- 9.1. Market Analysis, Insights and Forecast - by Type
- 10. Middle East & Africa Computed Tomography Market in Mexico Analysis, Insights and Forecast, 2020-2032
- 10.1. Market Analysis, Insights and Forecast - by Type
- 10.1.1. Low Slice
- 10.1.2. Medium Slice
- 10.1.3. High Slice
- 10.2. Market Analysis, Insights and Forecast - by Application
- 10.2.1. Oncology
- 10.2.2. Neurology
- 10.2.3. Cardiovascular
- 10.2.4. Musculoskeletal
- 10.2.5. Other Applications
- 10.3. Market Analysis, Insights and Forecast - by End User
- 10.3.1. Hospitals
- 10.3.2. Diagnostic Centers
- 10.3.3. Other End Users
- 10.1. Market Analysis, Insights and Forecast - by Type
- 11. Asia Pacific Computed Tomography Market in Mexico Analysis, Insights and Forecast, 2020-2032
- 11.1. Market Analysis, Insights and Forecast - by Type
- 11.1.1. Low Slice
- 11.1.2. Medium Slice
- 11.1.3. High Slice
- 11.2. Market Analysis, Insights and Forecast - by Application
- 11.2.1. Oncology
- 11.2.2. Neurology
- 11.2.3. Cardiovascular
- 11.2.4. Musculoskeletal
- 11.2.5. Other Applications
- 11.3. Market Analysis, Insights and Forecast - by End User
- 11.3.1. Hospitals
- 11.3.2. Diagnostic Centers
- 11.3.3. Other End Users
- 11.1. Market Analysis, Insights and Forecast - by Type
- 12. Competitive Analysis
- 12.1. Company Profiles
- 12.1.1 GE Healthcare
- 12.1.1.1. Company Overview
- 12.1.1.2. Products
- 12.1.1.3. Company Financials
- 12.1.1.4. SWOT Analysis
- 12.1.2 Dentsply Sirona
- 12.1.2.1. Company Overview
- 12.1.2.2. Products
- 12.1.2.3. Company Financials
- 12.1.2.4. SWOT Analysis
- 12.1.3 Siemens Healthineers AG
- 12.1.3.1. Company Overview
- 12.1.3.2. Products
- 12.1.3.3. Company Financials
- 12.1.3.4. SWOT Analysis
- 12.1.4 Canon Medical Systems Corporation (Toshiba Corporation)
- 12.1.4.1. Company Overview
- 12.1.4.2. Products
- 12.1.4.3. Company Financials
- 12.1.4.4. SWOT Analysis
- 12.1.5 Neusoft Medical Systems Co Ltd
- 12.1.5.1. Company Overview
- 12.1.5.2. Products
- 12.1.5.3. Company Financials
- 12.1.5.4. SWOT Analysis
- 12.1.6 Carestream Health
- 12.1.6.1. Company Overview
- 12.1.6.2. Products
- 12.1.6.3. Company Financials
- 12.1.6.4. SWOT Analysis
- 12.1.7 Vatech Inc
- 12.1.7.1. Company Overview
- 12.1.7.2. Products
- 12.1.7.3. Company Financials
- 12.1.7.4. SWOT Analysis
- 12.1.8 Koninklijke Philips NV
- 12.1.8.1. Company Overview
- 12.1.8.2. Products
- 12.1.8.3. Company Financials
- 12.1.8.4. SWOT Analysis
- 12.1.9 J Morita Corporation
- 12.1.9.1. Company Overview
- 12.1.9.2. Products
- 12.1.9.3. Company Financials
- 12.1.9.4. SWOT Analysis
- 12.1.10 Planmeca Group (Planmed OY)
- 12.1.10.1. Company Overview
- 12.1.10.2. Products
- 12.1.10.3. Company Financials
- 12.1.10.4. SWOT Analysis
- 12.1.11 Samsung Electronics Co Ltd (Samsung Medison)
- 12.1.11.1. Company Overview
- 12.1.11.2. Products
- 12.1.11.3. Company Financials
- 12.1.11.4. SWOT Analysis
- 12.1.1 GE Healthcare
- 12.2. Market Entropy
- 12.2.1 Company's Key Areas Served
- 12.2.2 Recent Developments
- 12.3. Company Market Share Analysis 2025
- 12.3.1 Top 5 Companies Market Share Analysis
- 12.3.2 Top 3 Companies Market Share Analysis
- 12.4. List of Potential Customers
- 13. Research Methodology
List of Figures
- Figure 1: Global Computed Tomography Market in Mexico Revenue Breakdown (Million, %) by Region 2025 & 2033
- Figure 2: North America Computed Tomography Market in Mexico Revenue (Million), by Type 2025 & 2033
- Figure 3: North America Computed Tomography Market in Mexico Revenue Share (%), by Type 2025 & 2033
- Figure 4: North America Computed Tomography Market in Mexico Revenue (Million), by Application 2025 & 2033
- Figure 5: North America Computed Tomography Market in Mexico Revenue Share (%), by Application 2025 & 2033
- Figure 6: North America Computed Tomography Market in Mexico Revenue (Million), by End User 2025 & 2033
- Figure 7: North America Computed Tomography Market in Mexico Revenue Share (%), by End User 2025 & 2033
- Figure 8: North America Computed Tomography Market in Mexico Revenue (Million), by Country 2025 & 2033
- Figure 9: North America Computed Tomography Market in Mexico Revenue Share (%), by Country 2025 & 2033
- Figure 10: South America Computed Tomography Market in Mexico Revenue (Million), by Type 2025 & 2033
- Figure 11: South America Computed Tomography Market in Mexico Revenue Share (%), by Type 2025 & 2033
- Figure 12: South America Computed Tomography Market in Mexico Revenue (Million), by Application 2025 & 2033
- Figure 13: South America Computed Tomography Market in Mexico Revenue Share (%), by Application 2025 & 2033
- Figure 14: South America Computed Tomography Market in Mexico Revenue (Million), by End User 2025 & 2033
- Figure 15: South America Computed Tomography Market in Mexico Revenue Share (%), by End User 2025 & 2033
- Figure 16: South America Computed Tomography Market in Mexico Revenue (Million), by Country 2025 & 2033
- Figure 17: South America Computed Tomography Market in Mexico Revenue Share (%), by Country 2025 & 2033
- Figure 18: Europe Computed Tomography Market in Mexico Revenue (Million), by Type 2025 & 2033
- Figure 19: Europe Computed Tomography Market in Mexico Revenue Share (%), by Type 2025 & 2033
- Figure 20: Europe Computed Tomography Market in Mexico Revenue (Million), by Application 2025 & 2033
- Figure 21: Europe Computed Tomography Market in Mexico Revenue Share (%), by Application 2025 & 2033
- Figure 22: Europe Computed Tomography Market in Mexico Revenue (Million), by End User 2025 & 2033
- Figure 23: Europe Computed Tomography Market in Mexico Revenue Share (%), by End User 2025 & 2033
- Figure 24: Europe Computed Tomography Market in Mexico Revenue (Million), by Country 2025 & 2033
- Figure 25: Europe Computed Tomography Market in Mexico Revenue Share (%), by Country 2025 & 2033
- Figure 26: Middle East & Africa Computed Tomography Market in Mexico Revenue (Million), by Type 2025 & 2033
- Figure 27: Middle East & Africa Computed Tomography Market in Mexico Revenue Share (%), by Type 2025 & 2033
- Figure 28: Middle East & Africa Computed Tomography Market in Mexico Revenue (Million), by Application 2025 & 2033
- Figure 29: Middle East & Africa Computed Tomography Market in Mexico Revenue Share (%), by Application 2025 & 2033
- Figure 30: Middle East & Africa Computed Tomography Market in Mexico Revenue (Million), by End User 2025 & 2033
- Figure 31: Middle East & Africa Computed Tomography Market in Mexico Revenue Share (%), by End User 2025 & 2033
- Figure 32: Middle East & Africa Computed Tomography Market in Mexico Revenue (Million), by Country 2025 & 2033
- Figure 33: Middle East & Africa Computed Tomography Market in Mexico Revenue Share (%), by Country 2025 & 2033
- Figure 34: Asia Pacific Computed Tomography Market in Mexico Revenue (Million), by Type 2025 & 2033
- Figure 35: Asia Pacific Computed Tomography Market in Mexico Revenue Share (%), by Type 2025 & 2033
- Figure 36: Asia Pacific Computed Tomography Market in Mexico Revenue (Million), by Application 2025 & 2033
- Figure 37: Asia Pacific Computed Tomography Market in Mexico Revenue Share (%), by Application 2025 & 2033
- Figure 38: Asia Pacific Computed Tomography Market in Mexico Revenue (Million), by End User 2025 & 2033
- Figure 39: Asia Pacific Computed Tomography Market in Mexico Revenue Share (%), by End User 2025 & 2033
- Figure 40: Asia Pacific Computed Tomography Market in Mexico Revenue (Million), by Country 2025 & 2033
- Figure 41: Asia Pacific Computed Tomography Market in Mexico Revenue Share (%), by Country 2025 & 2033
List of Tables
- Table 1: Global Computed Tomography Market in Mexico Revenue Million Forecast, by Type 2020 & 2033
- Table 2: Global Computed Tomography Market in Mexico Revenue Million Forecast, by Application 2020 & 2033
- Table 3: Global Computed Tomography Market in Mexico Revenue Million Forecast, by End User 2020 & 2033
- Table 4: Global Computed Tomography Market in Mexico Revenue Million Forecast, by Region 2020 & 2033
- Table 5: Global Computed Tomography Market in Mexico Revenue Million Forecast, by Type 2020 & 2033
- Table 6: Global Computed Tomography Market in Mexico Revenue Million Forecast, by Application 2020 & 2033
- Table 7: Global Computed Tomography Market in Mexico Revenue Million Forecast, by End User 2020 & 2033
- Table 8: Global Computed Tomography Market in Mexico Revenue Million Forecast, by Country 2020 & 2033
- Table 9: United States Computed Tomography Market in Mexico Revenue (Million) Forecast, by Application 2020 & 2033
- Table 10: Canada Computed Tomography Market in Mexico Revenue (Million) Forecast, by Application 2020 & 2033
- Table 11: Mexico Computed Tomography Market in Mexico Revenue (Million) Forecast, by Application 2020 & 2033
- Table 12: Global Computed Tomography Market in Mexico Revenue Million Forecast, by Type 2020 & 2033
- Table 13: Global Computed Tomography Market in Mexico Revenue Million Forecast, by Application 2020 & 2033
- Table 14: Global Computed Tomography Market in Mexico Revenue Million Forecast, by End User 2020 & 2033
- Table 15: Global Computed Tomography Market in Mexico Revenue Million Forecast, by Country 2020 & 2033
- Table 16: Brazil Computed Tomography Market in Mexico Revenue (Million) Forecast, by Application 2020 & 2033
- Table 17: Argentina Computed Tomography Market in Mexico Revenue (Million) Forecast, by Application 2020 & 2033
- Table 18: Rest of South America Computed Tomography Market in Mexico Revenue (Million) Forecast, by Application 2020 & 2033
- Table 19: Global Computed Tomography Market in Mexico Revenue Million Forecast, by Type 2020 & 2033
- Table 20: Global Computed Tomography Market in Mexico Revenue Million Forecast, by Application 2020 & 2033
- Table 21: Global Computed Tomography Market in Mexico Revenue Million Forecast, by End User 2020 & 2033
- Table 22: Global Computed Tomography Market in Mexico Revenue Million Forecast, by Country 2020 & 2033
- Table 23: United Kingdom Computed Tomography Market in Mexico Revenue (Million) Forecast, by Application 2020 & 2033
- Table 24: Germany Computed Tomography Market in Mexico Revenue (Million) Forecast, by Application 2020 & 2033
- Table 25: France Computed Tomography Market in Mexico Revenue (Million) Forecast, by Application 2020 & 2033
- Table 26: Italy Computed Tomography Market in Mexico Revenue (Million) Forecast, by Application 2020 & 2033
- Table 27: Spain Computed Tomography Market in Mexico Revenue (Million) Forecast, by Application 2020 & 2033
- Table 28: Russia Computed Tomography Market in Mexico Revenue (Million) Forecast, by Application 2020 & 2033
- Table 29: Benelux Computed Tomography Market in Mexico Revenue (Million) Forecast, by Application 2020 & 2033
- Table 30: Nordics Computed Tomography Market in Mexico Revenue (Million) Forecast, by Application 2020 & 2033
- Table 31: Rest of Europe Computed Tomography Market in Mexico Revenue (Million) Forecast, by Application 2020 & 2033
- Table 32: Global Computed Tomography Market in Mexico Revenue Million Forecast, by Type 2020 & 2033
- Table 33: Global Computed Tomography Market in Mexico Revenue Million Forecast, by Application 2020 & 2033
- Table 34: Global Computed Tomography Market in Mexico Revenue Million Forecast, by End User 2020 & 2033
- Table 35: Global Computed Tomography Market in Mexico Revenue Million Forecast, by Country 2020 & 2033
- Table 36: Turkey Computed Tomography Market in Mexico Revenue (Million) Forecast, by Application 2020 & 2033
- Table 37: Israel Computed Tomography Market in Mexico Revenue (Million) Forecast, by Application 2020 & 2033
- Table 38: GCC Computed Tomography Market in Mexico Revenue (Million) Forecast, by Application 2020 & 2033
- Table 39: North Africa Computed Tomography Market in Mexico Revenue (Million) Forecast, by Application 2020 & 2033
- Table 40: South Africa Computed Tomography Market in Mexico Revenue (Million) Forecast, by Application 2020 & 2033
- Table 41: Rest of Middle East & Africa Computed Tomography Market in Mexico Revenue (Million) Forecast, by Application 2020 & 2033
- Table 42: Global Computed Tomography Market in Mexico Revenue Million Forecast, by Type 2020 & 2033
- Table 43: Global Computed Tomography Market in Mexico Revenue Million Forecast, by Application 2020 & 2033
- Table 44: Global Computed Tomography Market in Mexico Revenue Million Forecast, by End User 2020 & 2033
- Table 45: Global Computed Tomography Market in Mexico Revenue Million Forecast, by Country 2020 & 2033
- Table 46: China Computed Tomography Market in Mexico Revenue (Million) Forecast, by Application 2020 & 2033
- Table 47: India Computed Tomography Market in Mexico Revenue (Million) Forecast, by Application 2020 & 2033
- Table 48: Japan Computed Tomography Market in Mexico Revenue (Million) Forecast, by Application 2020 & 2033
- Table 49: South Korea Computed Tomography Market in Mexico Revenue (Million) Forecast, by Application 2020 & 2033
- Table 50: ASEAN Computed Tomography Market in Mexico Revenue (Million) Forecast, by Application 2020 & 2033
- Table 51: Oceania Computed Tomography Market in Mexico Revenue (Million) Forecast, by Application 2020 & 2033
- Table 52: Rest of Asia Pacific Computed Tomography Market in Mexico Revenue (Million) Forecast, by Application 2020 & 2033
Frequently Asked Questions
1. What is the projected Compound Annual Growth Rate (CAGR) of the Computed Tomography Market in Mexico?
The projected CAGR is approximately 6.25%.
2. Which companies are prominent players in the Computed Tomography Market in Mexico?
Key companies in the market include GE Healthcare, Dentsply Sirona, Siemens Healthineers AG, Canon Medical Systems Corporation (Toshiba Corporation), Neusoft Medical Systems Co Ltd, Carestream Health, Vatech Inc, Koninklijke Philips NV, J Morita Corporation, Planmeca Group (Planmed OY), Samsung Electronics Co Ltd (Samsung Medison).
3. What are the main segments of the Computed Tomography Market in Mexico?
The market segments include Type, Application, End User.
4. Can you provide details about the market size?
The market size is estimated to be USD 159.35 Million as of 2022.
5. What are some drivers contributing to market growth?
Increasing Prevalence of Chronic Diseases; Rising Geriatric Population; Increasing Technological Advancements.
6. What are the notable trends driving market growth?
Oncology Segment is Expected to Hold a Significant Market Share Over the Forecast Period.
7. Are there any restraints impacting market growth?
Lack Of Proper Reimbursement And Stringent Regulatory Approval Procedures; High Cost of Equipment.
8. Can you provide examples of recent developments in the market?
In September 2020, To raise the level of healthcare for Mexicans, Nanox and SPI Medical announced an exclusive distribution agreement for the deployment of 630 Nanox.ARC devices in Mexico.
9. What pricing options are available for accessing the report?
Pricing options include single-user, multi-user, and enterprise licenses priced at USD 3800, USD 4500, and USD 5800 respectively.
10. Is the market size provided in terms of value or volume?
The market size is provided in terms of value, measured in Million.
11. Are there any specific market keywords associated with the report?
Yes, the market keyword associated with the report is "Computed Tomography Market in Mexico," which aids in identifying and referencing the specific market segment covered.
12. How do I determine which pricing option suits my needs best?
The pricing options vary based on user requirements and access needs. Individual users may opt for single-user licenses, while businesses requiring broader access may choose multi-user or enterprise licenses for cost-effective access to the report.
13. Are there any additional resources or data provided in the Computed Tomography Market in Mexico report?
While the report offers comprehensive insights, it's advisable to review the specific contents or supplementary materials provided to ascertain if additional resources or data are available.
14. How can I stay updated on further developments or reports in the Computed Tomography Market in Mexico?
To stay informed about further developments, trends, and reports in the Computed Tomography Market in Mexico, consider subscribing to industry newsletters, following relevant companies and organizations, or regularly checking reputable industry news sources and publications.
Methodology
Step 1 - Identification of Relevant Samples Size from Population Database


Step 2 - Approaches for Defining Global Market Size (Value, Volume* & Price*)

Note*: In applicable scenarios
Step 3 - Data Sources
Primary Research
- Web Analytics
- Survey Reports
- Research Institute
- Latest Research Reports
- Opinion Leaders
Secondary Research
- Annual Reports
- White Paper
- Latest Press Release
- Industry Association
- Paid Database
- Investor Presentations

Step 4 - Data Triangulation
Involves using different sources of information in order to increase the validity of a study
These sources are likely to be stakeholders in a program - participants, other researchers, program staff, other community members, and so on.
Then we put all data in single framework & apply various statistical tools to find out the dynamic on the market.
During the analysis stage, feedback from the stakeholder groups would be compared to determine areas of agreement as well as areas of divergence