

Key Insights
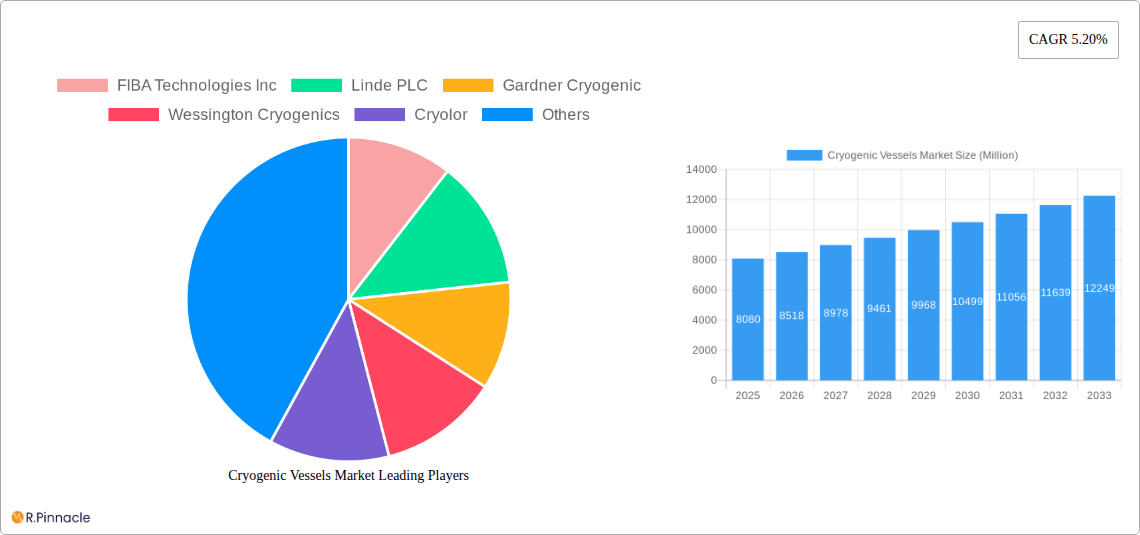
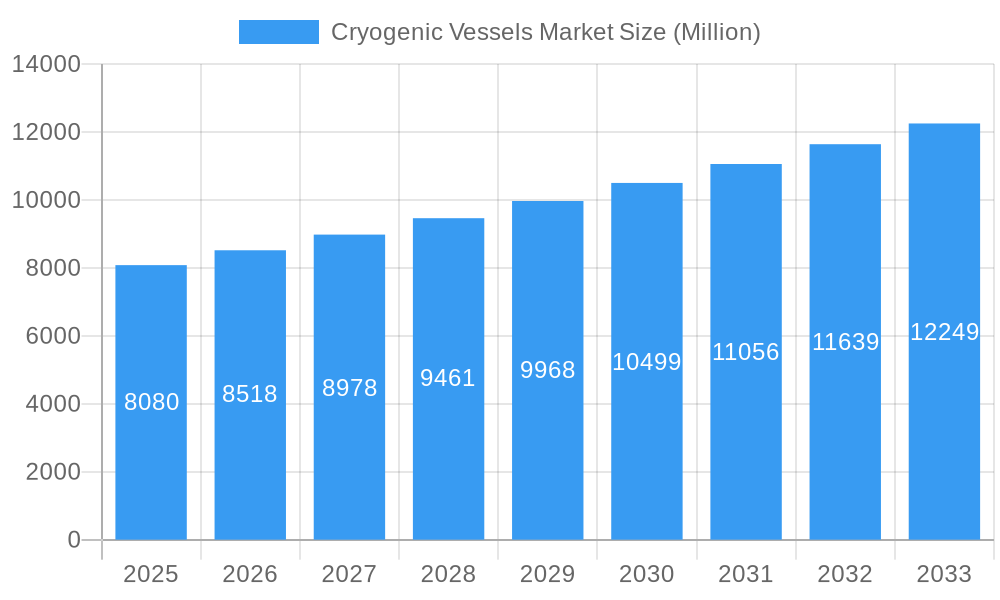
The cryogenic vessels market, valued at $8.08 billion in 2025, is projected to experience robust growth, driven by increasing demand across diverse sectors. The market's 5.20% CAGR from 2025 to 2033 indicates significant expansion opportunities. Key drivers include the burgeoning energy sector's reliance on liquefied natural gas (LNG) for transportation and storage, advancements in medical cryopreservation techniques expanding the healthcare application, and the growing use of cryogenic liquids in food processing and preservation. Technological innovations focused on improving vessel efficiency, safety, and material strength are further fueling market expansion. The segment encompassing LNG storage and transport is expected to dominate, given the rising global energy demand and the strategic importance of LNG as a cleaner energy source. However, high initial investment costs associated with cryogenic vessel manufacturing and maintenance could act as a restraint. Furthermore, stringent safety regulations and the need for specialized handling procedures pose challenges to market growth. The geographic distribution showcases a strong presence in North America and Europe, with the Asia-Pacific region exhibiting considerable growth potential due to rapid industrialization and infrastructure development.
Cryogenic Vessels Market Market Size (In Billion)
Competition within the cryogenic vessels market is intense, with major players like Linde PLC, Chart Industries Inc., and Air Water Inc. vying for market share. These companies are investing heavily in research and development to enhance their product offerings and expand into new markets. The market is further characterized by a diverse range of vessel types catering to various applications, including storage tanks, transport tankers, and specialized containers. Future growth will hinge on technological advancements in material science, improved insulation technologies leading to greater efficiency, and the development of sustainable and environmentally friendly cryogenic vessel solutions. The growing focus on reducing carbon emissions will also significantly influence the demand for cryogenic vessels designed for sustainable LNG transportation and storage.
Cryogenic Vessels Market Company Market Share
Cryogenic Vessels Market: A Comprehensive Report (2019-2033)
This in-depth report provides a comprehensive analysis of the Cryogenic Vessels Market, offering invaluable insights for industry professionals, investors, and strategic decision-makers. Covering the period from 2019 to 2033, with 2025 as the base year, this report meticulously examines market dynamics, segmentation, leading players, and future growth prospects. The report leverages extensive market research and data analysis to deliver actionable intelligence, empowering informed business strategies.
Cryogenic Vessels Market Structure & Innovation Trends
The Cryogenic Vessels market is characterized by a moderately consolidated structure, with key players holding significant market share. Market share data for 2024 indicates that the top five companies—Linde PLC, Chart Industries Inc, Air Water Inc, INOX India Ltd, and FIBA Technologies Inc—account for approximately xx% of the global market. Innovation is driven by the increasing demand for efficient and cost-effective cryogenic storage and transport solutions, particularly in the energy and healthcare sectors. Stringent regulatory frameworks concerning safety and environmental impact are shaping market trends, while advancements in materials science (e.g., high-strength lightweight alloys) and design are driving product differentiation. Substitutes, such as specialized pressure vessels, are limited due to the unique requirements of cryogenic applications. M&A activity has been relatively modest in recent years, with deal values averaging xx Million annually. A significant portion of M&A activity has focused on enhancing supply chain capabilities and expanding geographical reach.
- Market Concentration: Moderately consolidated, with top 5 players holding xx% market share (2024).
- Innovation Drivers: Demand for efficient solutions, advancements in materials science and design.
- Regulatory Framework: Stringent safety and environmental regulations.
- Product Substitutes: Limited due to unique cryogenic application requirements.
- M&A Activity: Moderate, focused on supply chain and geographical expansion, with average deal values of xx Million annually.
Cryogenic Vessels Market Dynamics & Trends
The Cryogenic Vessels market is experiencing robust growth, driven by the expanding applications of cryogenics across various industries. The market's Compound Annual Growth Rate (CAGR) during the forecast period (2025-2033) is estimated to be xx%. This growth is fueled by several factors, including the increasing demand for LNG for energy generation, the rising adoption of cryogenic technologies in healthcare (e.g., cryopreservation), and the growing use of liquid nitrogen in the food and beverage industry. Technological disruptions, such as the development of advanced insulation materials and improved transportation systems, are contributing to increased efficiency and reduced costs. Consumer preferences are shifting towards environmentally friendly and sustainable solutions, prompting manufacturers to develop greener cryogenic vessels. Competitive dynamics are intense, with companies focusing on innovation, cost optimization, and strategic partnerships to gain market share. Market penetration in emerging economies remains relatively low but is expected to increase significantly due to growing industrialization and infrastructure development.
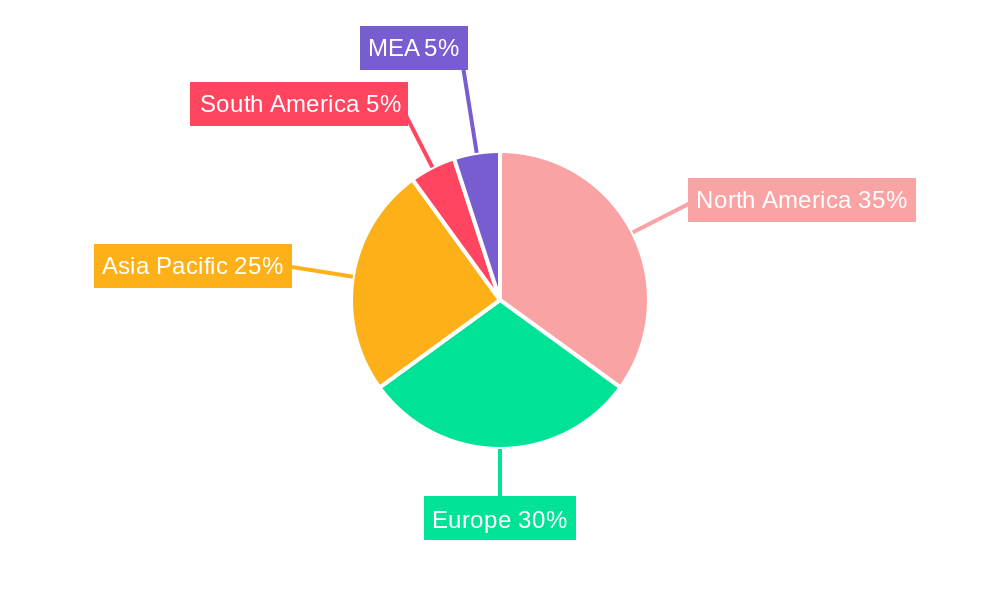
Dominant Regions & Segments in Cryogenic Vessels Market
The North American region currently holds the largest market share in the cryogenic vessels market, driven by strong demand from the energy and healthcare sectors. However, the Asia-Pacific region is projected to experience the highest growth rate over the forecast period, fueled by rapid industrialization and substantial investments in infrastructure development.
Key Drivers by Segment:
- Cryogenic Liquid:
- LNG: Growing demand for natural gas as a cleaner energy source.
- Liquid Nitrogen: Widespread applications in the food and beverage industry, healthcare, and manufacturing.
- Liquid Oxygen: Crucial for healthcare, metal processing, and industrial applications.
- Liquid Hydrogen: Emerging applications in the energy sector (fuel cells, rocketry).
- Other Cryogenic Liquids: Growing demand in specialized industrial applications.
- Raw Material:
- Steel: Cost-effective and widely used, but facing competition from newer materials.
- Nickel Alloy: Offers superior cryogenic properties but is more expensive.
- Aluminum Alloy: Lightweight and corrosion-resistant, suitable for specific applications.
- Other Raw Materials: Includes composites and other advanced materials.
- Application:
- Storage: The largest segment, driven by the need for safe and efficient cryogenic storage.
- Transport: Growing demand for efficient and reliable cryogenic transportation.
- End-User Industry:
- Energy Generation: LNG and liquid hydrogen are key drivers.
- Metal Processing: Liquid oxygen is essential for many metal processing operations.
- Healthcare: Growing adoption of cryopreservation and other cryogenic medical applications.
- Food and Beverages: Liquid nitrogen is extensively used for freezing and preservation.
- Other End-User Industries: Includes research, aerospace, and others.
Cryogenic Vessels Market Product Innovations
Recent innovations focus on improving the efficiency, safety, and sustainability of cryogenic vessels. This includes the development of advanced insulation materials to minimize boil-off, the use of lightweight and high-strength materials to reduce transportation costs, and the incorporation of advanced monitoring and control systems to enhance safety. The development of linerless carbon fiber tanks for liquid hydrogen storage highlights the trend towards lightweight and high-performance materials. These innovations aim to cater to diverse market needs and competitive pressures.
Report Scope & Segmentation Analysis
This report segments the Cryogenic Vessels Market based on cryogenic liquid type (LNG, liquid nitrogen, liquid oxygen, liquid hydrogen, and others), raw material (steel, nickel alloy, aluminum alloy, and others), application (storage and transport), and end-user industry (energy generation, metal processing, healthcare, food and beverages, and others). Growth projections vary significantly across segments, reflecting the diverse growth drivers and market dynamics within each. Competitive intensity also varies, with some segments experiencing more competition than others. Market sizes are provided for each segment for the historical period (2019-2024), the base year (2025), and the forecast period (2025-2033).
Key Drivers of Cryogenic Vessels Market Growth
The cryogenic vessels market is experiencing significant growth due to a confluence of factors:
- Rising demand for LNG: The increasing use of natural gas as a cleaner energy source is driving demand for LNG storage and transport solutions.
- Technological advancements: Improvements in insulation materials, vessel design, and monitoring systems are leading to more efficient and cost-effective solutions.
- Growth in healthcare applications: Cryopreservation and other cryogenic medical procedures are becoming increasingly prevalent.
- Expansion of the food and beverage industry: The use of liquid nitrogen in food processing and preservation is on the rise.
Challenges in the Cryogenic Vessels Market Sector
The cryogenic vessels market, while experiencing robust growth, is not without its hurdles. Manufacturers and suppliers must navigate a complex landscape characterized by:
- Stringent safety regulations: Adherence to rigorous international and regional safety standards for the storage and transportation of cryogenic liquids is paramount. This necessitates significant investment in design, materials, testing, and quality control, which can increase production costs and lead times.
- Fluctuations in raw material prices: The market is susceptible to volatility in the cost of essential raw materials such as high-grade stainless steel, nickel alloys, and other specialized components. These price swings can directly impact manufacturing margins and influence the final pricing of cryogenic vessels.
- Intense competition and evolving technological demands: The cryogenic vessels market is a dynamic and competitive arena. Established global players and agile emerging companies are constantly innovating to capture market share. This necessitates continuous investment in research and development to meet increasingly sophisticated demands for efficiency, safety, and specialized applications.
- Supply chain complexities: The global nature of the supply chain for specialized materials and components can present challenges related to lead times, logistics, and geopolitical factors, potentially impacting production schedules and delivery timelines.
Emerging Opportunities in Cryogenic Vessels Market
Despite the challenges, the cryogenic vessels market is ripe with promising opportunities driven by technological advancements and global trends:
- Growth in emerging economies: Rapid industrialization, increasing healthcare infrastructure, and the burgeoning demand for industrial gases in developing economies in Asia Pacific, Latin America, and Africa are creating substantial growth avenues for cryogenic vessel manufacturers.
- Advancements in hydrogen technology and the energy transition: The global push towards decarbonization and the burgeoning role of hydrogen as a clean energy carrier are significant catalysts. The increasing demand for efficient and safe hydrogen storage and transportation solutions, both for industrial applications and burgeoning mobility sectors (e.g., fuel cell vehicles), presents a massive opportunity.
- Development of sustainable and advanced materials: There is a growing emphasis on developing cryogenic vessels made from advanced, lightweight, and sustainable materials. Innovations in composite materials and improved insulation technologies are leading to more energy-efficient and environmentally friendly solutions.
- Expansion of the LNG and industrial gas sectors: The continued growth in the Liquefied Natural Gas (LNG) industry for power generation and transportation, alongside the consistent demand for industrial gases in sectors like healthcare, manufacturing, and food processing, will continue to drive the need for cryogenic storage and transport solutions.
- Innovations in vessel design and functionality: The development of smaller, more portable, and highly specialized cryogenic vessels for niche applications, such as in laboratories or for specific medical treatments, also presents an expanding market segment.
Leading Players in the Cryogenic Vessels Market
The cryogenic vessels market is populated by a mix of global leaders and specialized manufacturers, each contributing to the industry's innovation and supply chain. Key players include:
- FIBA Technologies Inc
- Linde PLC
- Gardner Cryogenic
- Wessington Cryogenics
- Cryolor
- Air Water Inc
- Cryofab Inc
- INOX India Ltd
- Chart Industries Inc
- ISISAN A S
Key Developments in Cryogenic Vessels Market Industry
The cryogenic vessels market is characterized by continuous innovation and strategic expansions. Recent key developments highlight the industry's forward momentum:
- March 2023: INOXCVA, a prominent player, significantly bolstered its production capabilities by inaugurating a new, state-of-the-art manufacturing facility in India, poised to meet escalating global demand.
- April 2023: The National Composites Centre (NCC) in the UK launched an ambitious program to evaluate and test advanced composite cryogenic storage tanks. This initiative specifically targets linerless carbon fiber tanks for liquid hydrogen, aiming to enhance storage efficiency and safety for this crucial energy carrier.
- Ongoing Research and Development: Numerous companies are investing in R&D to develop lighter, more durable, and cost-effective cryogenic vessels using advanced materials and innovative insulation techniques. This includes advancements in vacuum insulation technology and the exploration of new alloy compositions for enhanced performance and safety.
- Strategic Partnerships and Acquisitions: The market has seen strategic alliances and acquisitions aimed at consolidating market presence, expanding product portfolios, and enhancing technological expertise, particularly in areas like hydrogen storage and specialized gas handling.
Future Outlook for Cryogenic Vessels Market
The Cryogenic Vessels market is poised for continued growth, driven by technological advancements, increasing demand from various end-user industries, and expansion into new markets. Strategic opportunities lie in developing innovative, sustainable, and cost-effective solutions that meet the evolving needs of the market. The focus on lightweight materials, improved insulation, and advanced monitoring systems will be key for future success. The Asia-Pacific region is expected to be a major growth driver in the coming years.
Cryogenic Vessels Market Segmentation
-
1. Application
- 1.1. Storage
- 1.2. Transport
-
2. End-User Industry
- 2.1. Energy Generation
- 2.2. Metal Processing
- 2.3. Healthcare
- 2.4. Food and Beverages
- 2.5. Other End-User Industries
-
3. Cryogenic Liquid
- 3.1. LNG
- 3.2. Liquid Nitrogen
- 3.3. Liquid Oxygen
- 3.4. Liquid Hydrogen
- 3.5. Other Cryogenic Liquids
-
4. Raw Material
- 4.1. Steel
- 4.2. Nickel Alloy
- 4.3. Aluminum Alloy
- 4.4. Other Raw Materials
Cryogenic Vessels Market Segmentation By Geography
-
1. North America
- 1.1. United States
- 1.2. Canada
- 1.3. Rest of North America
-
2. Europe
- 2.1. Germany
- 2.2. France
- 2.3. United Kingdom
- 2.4. Russia
- 2.5. Rest of Europe
-
3. Asia Pacific
- 3.1. China
- 3.2. India
- 3.3. Australia
- 3.4. Japan
- 3.5. Malaysia
- 3.6. Rest of Asia Pacific
-
4. Middle East and Africa
- 4.1. Saudi Arabia
- 4.2. UAE
- 4.3. Nigeria
- 4.4. South Africa
- 4.5. Rest of Middle East and Africa
-
5. South America
- 5.1. Brazil
- 5.2. Argentina
- 5.3. Chile
- 5.4. Rest of South America
Cryogenic Vessels Market Regional Market Share
Geographic Coverage of Cryogenic Vessels Market
Cryogenic Vessels Market REPORT HIGHLIGHTS
| Aspects | Details |
|---|---|
| Study Period | 2020-2034 |
| Base Year | 2025 |
| Estimated Year | 2026 |
| Forecast Period | 2026-2034 |
| Historical Period | 2020-2025 |
| Growth Rate | CAGR of 5.20% from 2020-2034 |
| Segmentation |
|
Table of Contents
- 1. Introduction
- 1.1. Research Scope
- 1.2. Market Segmentation
- 1.3. Research Objective
- 1.4. Definitions and Assumptions
- 2. Executive Summary
- 2.1. Market Snapshot
- 3. Market Dynamics
- 3.1. Market Drivers
- 3.2. Market Restrains
- 3.3. Market Trends
- 3.4. Market Opportunities
- 4. Market Factor Analysis
- 4.1. Porters Five Forces
- 4.1.1. Bargaining Power of Suppliers
- 4.1.2. Bargaining Power of Buyers
- 4.1.3. Threat of New Entrants
- 4.1.4. Threat of Substitutes
- 4.1.5. Competitive Rivalry
- 4.2. PESTEL analysis
- 4.3. BCG Analysis
- 4.3.1. Stars (High Growth, High Market Share)
- 4.3.2. Cash Cows (Low Growth, High Market Share)
- 4.3.3. Question Mark (High Growth, Low Market Share)
- 4.3.4. Dogs (Low Growth, Low Market Share)
- 4.4. Ansoff Matrix Analysis
- 4.5. Supply Chain Analysis
- 4.6. Regulatory Landscape
- 4.7. Current Market Potential and Opportunity Assessment (TAM–SAM–SOM Framework)
- 4.8. PRI Analyst Note
- 4.1. Porters Five Forces
- 5. Market Analysis, Insights and Forecast 2021-2033
- 5.1. Market Analysis, Insights and Forecast - by Application
- 5.1.1. Storage
- 5.1.2. Transport
- 5.2. Market Analysis, Insights and Forecast - by End-User Industry
- 5.2.1. Energy Generation
- 5.2.2. Metal Processing
- 5.2.3. Healthcare
- 5.2.4. Food and Beverages
- 5.2.5. Other End-User Industries
- 5.3. Market Analysis, Insights and Forecast - by Cryogenic Liquid
- 5.3.1. LNG
- 5.3.2. Liquid Nitrogen
- 5.3.3. Liquid Oxygen
- 5.3.4. Liquid Hydrogen
- 5.3.5. Other Cryogenic Liquids
- 5.4. Market Analysis, Insights and Forecast - by Raw Material
- 5.4.1. Steel
- 5.4.2. Nickel Alloy
- 5.4.3. Aluminum Alloy
- 5.4.4. Other Raw Materials
- 5.5. Market Analysis, Insights and Forecast - by Region
- 5.5.1. North America
- 5.5.2. Europe
- 5.5.3. Asia Pacific
- 5.5.4. Middle East and Africa
- 5.5.5. South America
- 5.1. Market Analysis, Insights and Forecast - by Application
- 6. Global Cryogenic Vessels Market Analysis, Insights and Forecast, 2021-2033
- 6.1. Market Analysis, Insights and Forecast - by Application
- 6.1.1. Storage
- 6.1.2. Transport
- 6.2. Market Analysis, Insights and Forecast - by End-User Industry
- 6.2.1. Energy Generation
- 6.2.2. Metal Processing
- 6.2.3. Healthcare
- 6.2.4. Food and Beverages
- 6.2.5. Other End-User Industries
- 6.3. Market Analysis, Insights and Forecast - by Cryogenic Liquid
- 6.3.1. LNG
- 6.3.2. Liquid Nitrogen
- 6.3.3. Liquid Oxygen
- 6.3.4. Liquid Hydrogen
- 6.3.5. Other Cryogenic Liquids
- 6.4. Market Analysis, Insights and Forecast - by Raw Material
- 6.4.1. Steel
- 6.4.2. Nickel Alloy
- 6.4.3. Aluminum Alloy
- 6.4.4. Other Raw Materials
- 6.1. Market Analysis, Insights and Forecast - by Application
- 7. North America Cryogenic Vessels Market Analysis, Insights and Forecast, 2020-2032
- 7.1. Market Analysis, Insights and Forecast - by Application
- 7.1.1. Storage
- 7.1.2. Transport
- 7.2. Market Analysis, Insights and Forecast - by End-User Industry
- 7.2.1. Energy Generation
- 7.2.2. Metal Processing
- 7.2.3. Healthcare
- 7.2.4. Food and Beverages
- 7.2.5. Other End-User Industries
- 7.3. Market Analysis, Insights and Forecast - by Cryogenic Liquid
- 7.3.1. LNG
- 7.3.2. Liquid Nitrogen
- 7.3.3. Liquid Oxygen
- 7.3.4. Liquid Hydrogen
- 7.3.5. Other Cryogenic Liquids
- 7.4. Market Analysis, Insights and Forecast - by Raw Material
- 7.4.1. Steel
- 7.4.2. Nickel Alloy
- 7.4.3. Aluminum Alloy
- 7.4.4. Other Raw Materials
- 7.1. Market Analysis, Insights and Forecast - by Application
- 8. Europe Cryogenic Vessels Market Analysis, Insights and Forecast, 2020-2032
- 8.1. Market Analysis, Insights and Forecast - by Application
- 8.1.1. Storage
- 8.1.2. Transport
- 8.2. Market Analysis, Insights and Forecast - by End-User Industry
- 8.2.1. Energy Generation
- 8.2.2. Metal Processing
- 8.2.3. Healthcare
- 8.2.4. Food and Beverages
- 8.2.5. Other End-User Industries
- 8.3. Market Analysis, Insights and Forecast - by Cryogenic Liquid
- 8.3.1. LNG
- 8.3.2. Liquid Nitrogen
- 8.3.3. Liquid Oxygen
- 8.3.4. Liquid Hydrogen
- 8.3.5. Other Cryogenic Liquids
- 8.4. Market Analysis, Insights and Forecast - by Raw Material
- 8.4.1. Steel
- 8.4.2. Nickel Alloy
- 8.4.3. Aluminum Alloy
- 8.4.4. Other Raw Materials
- 8.1. Market Analysis, Insights and Forecast - by Application
- 9. Asia Pacific Cryogenic Vessels Market Analysis, Insights and Forecast, 2020-2032
- 9.1. Market Analysis, Insights and Forecast - by Application
- 9.1.1. Storage
- 9.1.2. Transport
- 9.2. Market Analysis, Insights and Forecast - by End-User Industry
- 9.2.1. Energy Generation
- 9.2.2. Metal Processing
- 9.2.3. Healthcare
- 9.2.4. Food and Beverages
- 9.2.5. Other End-User Industries
- 9.3. Market Analysis, Insights and Forecast - by Cryogenic Liquid
- 9.3.1. LNG
- 9.3.2. Liquid Nitrogen
- 9.3.3. Liquid Oxygen
- 9.3.4. Liquid Hydrogen
- 9.3.5. Other Cryogenic Liquids
- 9.4. Market Analysis, Insights and Forecast - by Raw Material
- 9.4.1. Steel
- 9.4.2. Nickel Alloy
- 9.4.3. Aluminum Alloy
- 9.4.4. Other Raw Materials
- 9.1. Market Analysis, Insights and Forecast - by Application
- 10. Middle East and Africa Cryogenic Vessels Market Analysis, Insights and Forecast, 2020-2032
- 10.1. Market Analysis, Insights and Forecast - by Application
- 10.1.1. Storage
- 10.1.2. Transport
- 10.2. Market Analysis, Insights and Forecast - by End-User Industry
- 10.2.1. Energy Generation
- 10.2.2. Metal Processing
- 10.2.3. Healthcare
- 10.2.4. Food and Beverages
- 10.2.5. Other End-User Industries
- 10.3. Market Analysis, Insights and Forecast - by Cryogenic Liquid
- 10.3.1. LNG
- 10.3.2. Liquid Nitrogen
- 10.3.3. Liquid Oxygen
- 10.3.4. Liquid Hydrogen
- 10.3.5. Other Cryogenic Liquids
- 10.4. Market Analysis, Insights and Forecast - by Raw Material
- 10.4.1. Steel
- 10.4.2. Nickel Alloy
- 10.4.3. Aluminum Alloy
- 10.4.4. Other Raw Materials
- 10.1. Market Analysis, Insights and Forecast - by Application
- 11. South America Cryogenic Vessels Market Analysis, Insights and Forecast, 2020-2032
- 11.1. Market Analysis, Insights and Forecast - by Application
- 11.1.1. Storage
- 11.1.2. Transport
- 11.2. Market Analysis, Insights and Forecast - by End-User Industry
- 11.2.1. Energy Generation
- 11.2.2. Metal Processing
- 11.2.3. Healthcare
- 11.2.4. Food and Beverages
- 11.2.5. Other End-User Industries
- 11.3. Market Analysis, Insights and Forecast - by Cryogenic Liquid
- 11.3.1. LNG
- 11.3.2. Liquid Nitrogen
- 11.3.3. Liquid Oxygen
- 11.3.4. Liquid Hydrogen
- 11.3.5. Other Cryogenic Liquids
- 11.4. Market Analysis, Insights and Forecast - by Raw Material
- 11.4.1. Steel
- 11.4.2. Nickel Alloy
- 11.4.3. Aluminum Alloy
- 11.4.4. Other Raw Materials
- 11.1. Market Analysis, Insights and Forecast - by Application
- 12. Competitive Analysis
- 12.1. Company Profiles
- 12.1.1 FIBA Technologies Inc
- 12.1.1.1. Company Overview
- 12.1.1.2. Products
- 12.1.1.3. Company Financials
- 12.1.1.4. SWOT Analysis
- 12.1.2 Linde PLC
- 12.1.2.1. Company Overview
- 12.1.2.2. Products
- 12.1.2.3. Company Financials
- 12.1.2.4. SWOT Analysis
- 12.1.3 Gardner Cryogenic
- 12.1.3.1. Company Overview
- 12.1.3.2. Products
- 12.1.3.3. Company Financials
- 12.1.3.4. SWOT Analysis
- 12.1.4 Wessington Cryogenics
- 12.1.4.1. Company Overview
- 12.1.4.2. Products
- 12.1.4.3. Company Financials
- 12.1.4.4. SWOT Analysis
- 12.1.5 Cryolor
- 12.1.5.1. Company Overview
- 12.1.5.2. Products
- 12.1.5.3. Company Financials
- 12.1.5.4. SWOT Analysis
- 12.1.6 Air Water Inc
- 12.1.6.1. Company Overview
- 12.1.6.2. Products
- 12.1.6.3. Company Financials
- 12.1.6.4. SWOT Analysis
- 12.1.7 Cryofab Inc
- 12.1.7.1. Company Overview
- 12.1.7.2. Products
- 12.1.7.3. Company Financials
- 12.1.7.4. SWOT Analysis
- 12.1.8 INOX India Ltd
- 12.1.8.1. Company Overview
- 12.1.8.2. Products
- 12.1.8.3. Company Financials
- 12.1.8.4. SWOT Analysis
- 12.1.9 Chart Industries Inc
- 12.1.9.1. Company Overview
- 12.1.9.2. Products
- 12.1.9.3. Company Financials
- 12.1.9.4. SWOT Analysis
- 12.1.10 ISISAN A S
- 12.1.10.1. Company Overview
- 12.1.10.2. Products
- 12.1.10.3. Company Financials
- 12.1.10.4. SWOT Analysis
- 12.1.1 FIBA Technologies Inc
- 12.2. Market Entropy
- 12.2.1 Company's Key Areas Served
- 12.2.2 Recent Developments
- 12.3. Company Market Share Analysis 2025
- 12.3.1 Top 5 Companies Market Share Analysis
- 12.3.2 Top 3 Companies Market Share Analysis
- 12.4. List of Potential Customers
- 13. Research Methodology
List of Figures
- Figure 1: Global Cryogenic Vessels Market Revenue Breakdown (Million, %) by Region 2025 & 2033
- Figure 2: Global Cryogenic Vessels Market Volume Breakdown (K Unit, %) by Region 2025 & 2033
- Figure 3: North America Cryogenic Vessels Market Revenue (Million), by Application 2025 & 2033
- Figure 4: North America Cryogenic Vessels Market Volume (K Unit), by Application 2025 & 2033
- Figure 5: North America Cryogenic Vessels Market Revenue Share (%), by Application 2025 & 2033
- Figure 6: North America Cryogenic Vessels Market Volume Share (%), by Application 2025 & 2033
- Figure 7: North America Cryogenic Vessels Market Revenue (Million), by End-User Industry 2025 & 2033
- Figure 8: North America Cryogenic Vessels Market Volume (K Unit), by End-User Industry 2025 & 2033
- Figure 9: North America Cryogenic Vessels Market Revenue Share (%), by End-User Industry 2025 & 2033
- Figure 10: North America Cryogenic Vessels Market Volume Share (%), by End-User Industry 2025 & 2033
- Figure 11: North America Cryogenic Vessels Market Revenue (Million), by Cryogenic Liquid 2025 & 2033
- Figure 12: North America Cryogenic Vessels Market Volume (K Unit), by Cryogenic Liquid 2025 & 2033
- Figure 13: North America Cryogenic Vessels Market Revenue Share (%), by Cryogenic Liquid 2025 & 2033
- Figure 14: North America Cryogenic Vessels Market Volume Share (%), by Cryogenic Liquid 2025 & 2033
- Figure 15: North America Cryogenic Vessels Market Revenue (Million), by Raw Material 2025 & 2033
- Figure 16: North America Cryogenic Vessels Market Volume (K Unit), by Raw Material 2025 & 2033
- Figure 17: North America Cryogenic Vessels Market Revenue Share (%), by Raw Material 2025 & 2033
- Figure 18: North America Cryogenic Vessels Market Volume Share (%), by Raw Material 2025 & 2033
- Figure 19: North America Cryogenic Vessels Market Revenue (Million), by Country 2025 & 2033
- Figure 20: North America Cryogenic Vessels Market Volume (K Unit), by Country 2025 & 2033
- Figure 21: North America Cryogenic Vessels Market Revenue Share (%), by Country 2025 & 2033
- Figure 22: North America Cryogenic Vessels Market Volume Share (%), by Country 2025 & 2033
- Figure 23: Europe Cryogenic Vessels Market Revenue (Million), by Application 2025 & 2033
- Figure 24: Europe Cryogenic Vessels Market Volume (K Unit), by Application 2025 & 2033
- Figure 25: Europe Cryogenic Vessels Market Revenue Share (%), by Application 2025 & 2033
- Figure 26: Europe Cryogenic Vessels Market Volume Share (%), by Application 2025 & 2033
- Figure 27: Europe Cryogenic Vessels Market Revenue (Million), by End-User Industry 2025 & 2033
- Figure 28: Europe Cryogenic Vessels Market Volume (K Unit), by End-User Industry 2025 & 2033
- Figure 29: Europe Cryogenic Vessels Market Revenue Share (%), by End-User Industry 2025 & 2033
- Figure 30: Europe Cryogenic Vessels Market Volume Share (%), by End-User Industry 2025 & 2033
- Figure 31: Europe Cryogenic Vessels Market Revenue (Million), by Cryogenic Liquid 2025 & 2033
- Figure 32: Europe Cryogenic Vessels Market Volume (K Unit), by Cryogenic Liquid 2025 & 2033
- Figure 33: Europe Cryogenic Vessels Market Revenue Share (%), by Cryogenic Liquid 2025 & 2033
- Figure 34: Europe Cryogenic Vessels Market Volume Share (%), by Cryogenic Liquid 2025 & 2033
- Figure 35: Europe Cryogenic Vessels Market Revenue (Million), by Raw Material 2025 & 2033
- Figure 36: Europe Cryogenic Vessels Market Volume (K Unit), by Raw Material 2025 & 2033
- Figure 37: Europe Cryogenic Vessels Market Revenue Share (%), by Raw Material 2025 & 2033
- Figure 38: Europe Cryogenic Vessels Market Volume Share (%), by Raw Material 2025 & 2033
- Figure 39: Europe Cryogenic Vessels Market Revenue (Million), by Country 2025 & 2033
- Figure 40: Europe Cryogenic Vessels Market Volume (K Unit), by Country 2025 & 2033
- Figure 41: Europe Cryogenic Vessels Market Revenue Share (%), by Country 2025 & 2033
- Figure 42: Europe Cryogenic Vessels Market Volume Share (%), by Country 2025 & 2033
- Figure 43: Asia Pacific Cryogenic Vessels Market Revenue (Million), by Application 2025 & 2033
- Figure 44: Asia Pacific Cryogenic Vessels Market Volume (K Unit), by Application 2025 & 2033
- Figure 45: Asia Pacific Cryogenic Vessels Market Revenue Share (%), by Application 2025 & 2033
- Figure 46: Asia Pacific Cryogenic Vessels Market Volume Share (%), by Application 2025 & 2033
- Figure 47: Asia Pacific Cryogenic Vessels Market Revenue (Million), by End-User Industry 2025 & 2033
- Figure 48: Asia Pacific Cryogenic Vessels Market Volume (K Unit), by End-User Industry 2025 & 2033
- Figure 49: Asia Pacific Cryogenic Vessels Market Revenue Share (%), by End-User Industry 2025 & 2033
- Figure 50: Asia Pacific Cryogenic Vessels Market Volume Share (%), by End-User Industry 2025 & 2033
- Figure 51: Asia Pacific Cryogenic Vessels Market Revenue (Million), by Cryogenic Liquid 2025 & 2033
- Figure 52: Asia Pacific Cryogenic Vessels Market Volume (K Unit), by Cryogenic Liquid 2025 & 2033
- Figure 53: Asia Pacific Cryogenic Vessels Market Revenue Share (%), by Cryogenic Liquid 2025 & 2033
- Figure 54: Asia Pacific Cryogenic Vessels Market Volume Share (%), by Cryogenic Liquid 2025 & 2033
- Figure 55: Asia Pacific Cryogenic Vessels Market Revenue (Million), by Raw Material 2025 & 2033
- Figure 56: Asia Pacific Cryogenic Vessels Market Volume (K Unit), by Raw Material 2025 & 2033
- Figure 57: Asia Pacific Cryogenic Vessels Market Revenue Share (%), by Raw Material 2025 & 2033
- Figure 58: Asia Pacific Cryogenic Vessels Market Volume Share (%), by Raw Material 2025 & 2033
- Figure 59: Asia Pacific Cryogenic Vessels Market Revenue (Million), by Country 2025 & 2033
- Figure 60: Asia Pacific Cryogenic Vessels Market Volume (K Unit), by Country 2025 & 2033
- Figure 61: Asia Pacific Cryogenic Vessels Market Revenue Share (%), by Country 2025 & 2033
- Figure 62: Asia Pacific Cryogenic Vessels Market Volume Share (%), by Country 2025 & 2033
- Figure 63: Middle East and Africa Cryogenic Vessels Market Revenue (Million), by Application 2025 & 2033
- Figure 64: Middle East and Africa Cryogenic Vessels Market Volume (K Unit), by Application 2025 & 2033
- Figure 65: Middle East and Africa Cryogenic Vessels Market Revenue Share (%), by Application 2025 & 2033
- Figure 66: Middle East and Africa Cryogenic Vessels Market Volume Share (%), by Application 2025 & 2033
- Figure 67: Middle East and Africa Cryogenic Vessels Market Revenue (Million), by End-User Industry 2025 & 2033
- Figure 68: Middle East and Africa Cryogenic Vessels Market Volume (K Unit), by End-User Industry 2025 & 2033
- Figure 69: Middle East and Africa Cryogenic Vessels Market Revenue Share (%), by End-User Industry 2025 & 2033
- Figure 70: Middle East and Africa Cryogenic Vessels Market Volume Share (%), by End-User Industry 2025 & 2033
- Figure 71: Middle East and Africa Cryogenic Vessels Market Revenue (Million), by Cryogenic Liquid 2025 & 2033
- Figure 72: Middle East and Africa Cryogenic Vessels Market Volume (K Unit), by Cryogenic Liquid 2025 & 2033
- Figure 73: Middle East and Africa Cryogenic Vessels Market Revenue Share (%), by Cryogenic Liquid 2025 & 2033
- Figure 74: Middle East and Africa Cryogenic Vessels Market Volume Share (%), by Cryogenic Liquid 2025 & 2033
- Figure 75: Middle East and Africa Cryogenic Vessels Market Revenue (Million), by Raw Material 2025 & 2033
- Figure 76: Middle East and Africa Cryogenic Vessels Market Volume (K Unit), by Raw Material 2025 & 2033
- Figure 77: Middle East and Africa Cryogenic Vessels Market Revenue Share (%), by Raw Material 2025 & 2033
- Figure 78: Middle East and Africa Cryogenic Vessels Market Volume Share (%), by Raw Material 2025 & 2033
- Figure 79: Middle East and Africa Cryogenic Vessels Market Revenue (Million), by Country 2025 & 2033
- Figure 80: Middle East and Africa Cryogenic Vessels Market Volume (K Unit), by Country 2025 & 2033
- Figure 81: Middle East and Africa Cryogenic Vessels Market Revenue Share (%), by Country 2025 & 2033
- Figure 82: Middle East and Africa Cryogenic Vessels Market Volume Share (%), by Country 2025 & 2033
- Figure 83: South America Cryogenic Vessels Market Revenue (Million), by Application 2025 & 2033
- Figure 84: South America Cryogenic Vessels Market Volume (K Unit), by Application 2025 & 2033
- Figure 85: South America Cryogenic Vessels Market Revenue Share (%), by Application 2025 & 2033
- Figure 86: South America Cryogenic Vessels Market Volume Share (%), by Application 2025 & 2033
- Figure 87: South America Cryogenic Vessels Market Revenue (Million), by End-User Industry 2025 & 2033
- Figure 88: South America Cryogenic Vessels Market Volume (K Unit), by End-User Industry 2025 & 2033
- Figure 89: South America Cryogenic Vessels Market Revenue Share (%), by End-User Industry 2025 & 2033
- Figure 90: South America Cryogenic Vessels Market Volume Share (%), by End-User Industry 2025 & 2033
- Figure 91: South America Cryogenic Vessels Market Revenue (Million), by Cryogenic Liquid 2025 & 2033
- Figure 92: South America Cryogenic Vessels Market Volume (K Unit), by Cryogenic Liquid 2025 & 2033
- Figure 93: South America Cryogenic Vessels Market Revenue Share (%), by Cryogenic Liquid 2025 & 2033
- Figure 94: South America Cryogenic Vessels Market Volume Share (%), by Cryogenic Liquid 2025 & 2033
- Figure 95: South America Cryogenic Vessels Market Revenue (Million), by Raw Material 2025 & 2033
- Figure 96: South America Cryogenic Vessels Market Volume (K Unit), by Raw Material 2025 & 2033
- Figure 97: South America Cryogenic Vessels Market Revenue Share (%), by Raw Material 2025 & 2033
- Figure 98: South America Cryogenic Vessels Market Volume Share (%), by Raw Material 2025 & 2033
- Figure 99: South America Cryogenic Vessels Market Revenue (Million), by Country 2025 & 2033
- Figure 100: South America Cryogenic Vessels Market Volume (K Unit), by Country 2025 & 2033
- Figure 101: South America Cryogenic Vessels Market Revenue Share (%), by Country 2025 & 2033
- Figure 102: South America Cryogenic Vessels Market Volume Share (%), by Country 2025 & 2033
List of Tables
- Table 1: Global Cryogenic Vessels Market Revenue Million Forecast, by Application 2020 & 2033
- Table 2: Global Cryogenic Vessels Market Volume K Unit Forecast, by Application 2020 & 2033
- Table 3: Global Cryogenic Vessels Market Revenue Million Forecast, by End-User Industry 2020 & 2033
- Table 4: Global Cryogenic Vessels Market Volume K Unit Forecast, by End-User Industry 2020 & 2033
- Table 5: Global Cryogenic Vessels Market Revenue Million Forecast, by Cryogenic Liquid 2020 & 2033
- Table 6: Global Cryogenic Vessels Market Volume K Unit Forecast, by Cryogenic Liquid 2020 & 2033
- Table 7: Global Cryogenic Vessels Market Revenue Million Forecast, by Raw Material 2020 & 2033
- Table 8: Global Cryogenic Vessels Market Volume K Unit Forecast, by Raw Material 2020 & 2033
- Table 9: Global Cryogenic Vessels Market Revenue Million Forecast, by Region 2020 & 2033
- Table 10: Global Cryogenic Vessels Market Volume K Unit Forecast, by Region 2020 & 2033
- Table 11: Global Cryogenic Vessels Market Revenue Million Forecast, by Application 2020 & 2033
- Table 12: Global Cryogenic Vessels Market Volume K Unit Forecast, by Application 2020 & 2033
- Table 13: Global Cryogenic Vessels Market Revenue Million Forecast, by End-User Industry 2020 & 2033
- Table 14: Global Cryogenic Vessels Market Volume K Unit Forecast, by End-User Industry 2020 & 2033
- Table 15: Global Cryogenic Vessels Market Revenue Million Forecast, by Cryogenic Liquid 2020 & 2033
- Table 16: Global Cryogenic Vessels Market Volume K Unit Forecast, by Cryogenic Liquid 2020 & 2033
- Table 17: Global Cryogenic Vessels Market Revenue Million Forecast, by Raw Material 2020 & 2033
- Table 18: Global Cryogenic Vessels Market Volume K Unit Forecast, by Raw Material 2020 & 2033
- Table 19: Global Cryogenic Vessels Market Revenue Million Forecast, by Country 2020 & 2033
- Table 20: Global Cryogenic Vessels Market Volume K Unit Forecast, by Country 2020 & 2033
- Table 21: United States Cryogenic Vessels Market Revenue (Million) Forecast, by Application 2020 & 2033
- Table 22: United States Cryogenic Vessels Market Volume (K Unit) Forecast, by Application 2020 & 2033
- Table 23: Canada Cryogenic Vessels Market Revenue (Million) Forecast, by Application 2020 & 2033
- Table 24: Canada Cryogenic Vessels Market Volume (K Unit) Forecast, by Application 2020 & 2033
- Table 25: Rest of North America Cryogenic Vessels Market Revenue (Million) Forecast, by Application 2020 & 2033
- Table 26: Rest of North America Cryogenic Vessels Market Volume (K Unit) Forecast, by Application 2020 & 2033
- Table 27: Global Cryogenic Vessels Market Revenue Million Forecast, by Application 2020 & 2033
- Table 28: Global Cryogenic Vessels Market Volume K Unit Forecast, by Application 2020 & 2033
- Table 29: Global Cryogenic Vessels Market Revenue Million Forecast, by End-User Industry 2020 & 2033
- Table 30: Global Cryogenic Vessels Market Volume K Unit Forecast, by End-User Industry 2020 & 2033
- Table 31: Global Cryogenic Vessels Market Revenue Million Forecast, by Cryogenic Liquid 2020 & 2033
- Table 32: Global Cryogenic Vessels Market Volume K Unit Forecast, by Cryogenic Liquid 2020 & 2033
- Table 33: Global Cryogenic Vessels Market Revenue Million Forecast, by Raw Material 2020 & 2033
- Table 34: Global Cryogenic Vessels Market Volume K Unit Forecast, by Raw Material 2020 & 2033
- Table 35: Global Cryogenic Vessels Market Revenue Million Forecast, by Country 2020 & 2033
- Table 36: Global Cryogenic Vessels Market Volume K Unit Forecast, by Country 2020 & 2033
- Table 37: Germany Cryogenic Vessels Market Revenue (Million) Forecast, by Application 2020 & 2033
- Table 38: Germany Cryogenic Vessels Market Volume (K Unit) Forecast, by Application 2020 & 2033
- Table 39: France Cryogenic Vessels Market Revenue (Million) Forecast, by Application 2020 & 2033
- Table 40: France Cryogenic Vessels Market Volume (K Unit) Forecast, by Application 2020 & 2033
- Table 41: United Kingdom Cryogenic Vessels Market Revenue (Million) Forecast, by Application 2020 & 2033
- Table 42: United Kingdom Cryogenic Vessels Market Volume (K Unit) Forecast, by Application 2020 & 2033
- Table 43: Russia Cryogenic Vessels Market Revenue (Million) Forecast, by Application 2020 & 2033
- Table 44: Russia Cryogenic Vessels Market Volume (K Unit) Forecast, by Application 2020 & 2033
- Table 45: Rest of Europe Cryogenic Vessels Market Revenue (Million) Forecast, by Application 2020 & 2033
- Table 46: Rest of Europe Cryogenic Vessels Market Volume (K Unit) Forecast, by Application 2020 & 2033
- Table 47: Global Cryogenic Vessels Market Revenue Million Forecast, by Application 2020 & 2033
- Table 48: Global Cryogenic Vessels Market Volume K Unit Forecast, by Application 2020 & 2033
- Table 49: Global Cryogenic Vessels Market Revenue Million Forecast, by End-User Industry 2020 & 2033
- Table 50: Global Cryogenic Vessels Market Volume K Unit Forecast, by End-User Industry 2020 & 2033
- Table 51: Global Cryogenic Vessels Market Revenue Million Forecast, by Cryogenic Liquid 2020 & 2033
- Table 52: Global Cryogenic Vessels Market Volume K Unit Forecast, by Cryogenic Liquid 2020 & 2033
- Table 53: Global Cryogenic Vessels Market Revenue Million Forecast, by Raw Material 2020 & 2033
- Table 54: Global Cryogenic Vessels Market Volume K Unit Forecast, by Raw Material 2020 & 2033
- Table 55: Global Cryogenic Vessels Market Revenue Million Forecast, by Country 2020 & 2033
- Table 56: Global Cryogenic Vessels Market Volume K Unit Forecast, by Country 2020 & 2033
- Table 57: China Cryogenic Vessels Market Revenue (Million) Forecast, by Application 2020 & 2033
- Table 58: China Cryogenic Vessels Market Volume (K Unit) Forecast, by Application 2020 & 2033
- Table 59: India Cryogenic Vessels Market Revenue (Million) Forecast, by Application 2020 & 2033
- Table 60: India Cryogenic Vessels Market Volume (K Unit) Forecast, by Application 2020 & 2033
- Table 61: Australia Cryogenic Vessels Market Revenue (Million) Forecast, by Application 2020 & 2033
- Table 62: Australia Cryogenic Vessels Market Volume (K Unit) Forecast, by Application 2020 & 2033
- Table 63: Japan Cryogenic Vessels Market Revenue (Million) Forecast, by Application 2020 & 2033
- Table 64: Japan Cryogenic Vessels Market Volume (K Unit) Forecast, by Application 2020 & 2033
- Table 65: Malaysia Cryogenic Vessels Market Revenue (Million) Forecast, by Application 2020 & 2033
- Table 66: Malaysia Cryogenic Vessels Market Volume (K Unit) Forecast, by Application 2020 & 2033
- Table 67: Rest of Asia Pacific Cryogenic Vessels Market Revenue (Million) Forecast, by Application 2020 & 2033
- Table 68: Rest of Asia Pacific Cryogenic Vessels Market Volume (K Unit) Forecast, by Application 2020 & 2033
- Table 69: Global Cryogenic Vessels Market Revenue Million Forecast, by Application 2020 & 2033
- Table 70: Global Cryogenic Vessels Market Volume K Unit Forecast, by Application 2020 & 2033
- Table 71: Global Cryogenic Vessels Market Revenue Million Forecast, by End-User Industry 2020 & 2033
- Table 72: Global Cryogenic Vessels Market Volume K Unit Forecast, by End-User Industry 2020 & 2033
- Table 73: Global Cryogenic Vessels Market Revenue Million Forecast, by Cryogenic Liquid 2020 & 2033
- Table 74: Global Cryogenic Vessels Market Volume K Unit Forecast, by Cryogenic Liquid 2020 & 2033
- Table 75: Global Cryogenic Vessels Market Revenue Million Forecast, by Raw Material 2020 & 2033
- Table 76: Global Cryogenic Vessels Market Volume K Unit Forecast, by Raw Material 2020 & 2033
- Table 77: Global Cryogenic Vessels Market Revenue Million Forecast, by Country 2020 & 2033
- Table 78: Global Cryogenic Vessels Market Volume K Unit Forecast, by Country 2020 & 2033
- Table 79: Saudi Arabia Cryogenic Vessels Market Revenue (Million) Forecast, by Application 2020 & 2033
- Table 80: Saudi Arabia Cryogenic Vessels Market Volume (K Unit) Forecast, by Application 2020 & 2033
- Table 81: UAE Cryogenic Vessels Market Revenue (Million) Forecast, by Application 2020 & 2033
- Table 82: UAE Cryogenic Vessels Market Volume (K Unit) Forecast, by Application 2020 & 2033
- Table 83: Nigeria Cryogenic Vessels Market Revenue (Million) Forecast, by Application 2020 & 2033
- Table 84: Nigeria Cryogenic Vessels Market Volume (K Unit) Forecast, by Application 2020 & 2033
- Table 85: South Africa Cryogenic Vessels Market Revenue (Million) Forecast, by Application 2020 & 2033
- Table 86: South Africa Cryogenic Vessels Market Volume (K Unit) Forecast, by Application 2020 & 2033
- Table 87: Rest of Middle East and Africa Cryogenic Vessels Market Revenue (Million) Forecast, by Application 2020 & 2033
- Table 88: Rest of Middle East and Africa Cryogenic Vessels Market Volume (K Unit) Forecast, by Application 2020 & 2033
- Table 89: Global Cryogenic Vessels Market Revenue Million Forecast, by Application 2020 & 2033
- Table 90: Global Cryogenic Vessels Market Volume K Unit Forecast, by Application 2020 & 2033
- Table 91: Global Cryogenic Vessels Market Revenue Million Forecast, by End-User Industry 2020 & 2033
- Table 92: Global Cryogenic Vessels Market Volume K Unit Forecast, by End-User Industry 2020 & 2033
- Table 93: Global Cryogenic Vessels Market Revenue Million Forecast, by Cryogenic Liquid 2020 & 2033
- Table 94: Global Cryogenic Vessels Market Volume K Unit Forecast, by Cryogenic Liquid 2020 & 2033
- Table 95: Global Cryogenic Vessels Market Revenue Million Forecast, by Raw Material 2020 & 2033
- Table 96: Global Cryogenic Vessels Market Volume K Unit Forecast, by Raw Material 2020 & 2033
- Table 97: Global Cryogenic Vessels Market Revenue Million Forecast, by Country 2020 & 2033
- Table 98: Global Cryogenic Vessels Market Volume K Unit Forecast, by Country 2020 & 2033
- Table 99: Brazil Cryogenic Vessels Market Revenue (Million) Forecast, by Application 2020 & 2033
- Table 100: Brazil Cryogenic Vessels Market Volume (K Unit) Forecast, by Application 2020 & 2033
- Table 101: Argentina Cryogenic Vessels Market Revenue (Million) Forecast, by Application 2020 & 2033
- Table 102: Argentina Cryogenic Vessels Market Volume (K Unit) Forecast, by Application 2020 & 2033
- Table 103: Chile Cryogenic Vessels Market Revenue (Million) Forecast, by Application 2020 & 2033
- Table 104: Chile Cryogenic Vessels Market Volume (K Unit) Forecast, by Application 2020 & 2033
- Table 105: Rest of South America Cryogenic Vessels Market Revenue (Million) Forecast, by Application 2020 & 2033
- Table 106: Rest of South America Cryogenic Vessels Market Volume (K Unit) Forecast, by Application 2020 & 2033
Frequently Asked Questions
1. What is the projected Compound Annual Growth Rate (CAGR) of the Cryogenic Vessels Market?
The projected CAGR is approximately 5.20%.
2. Which companies are prominent players in the Cryogenic Vessels Market?
Key companies in the market include FIBA Technologies Inc, Linde PLC, Gardner Cryogenic, Wessington Cryogenics, Cryolor, Air Water Inc, Cryofab Inc, INOX India Ltd, Chart Industries Inc, ISISAN A S.
3. What are the main segments of the Cryogenic Vessels Market?
The market segments include Application, End-User Industry, Cryogenic Liquid, Raw Material.
4. Can you provide details about the market size?
The market size is estimated to be USD 8.08 Million as of 2022.
5. What are some drivers contributing to market growth?
4.; Increasing Demand for Liquefied Natural Gas (LNG).
6. What are the notable trends driving market growth?
Metal Processing Industry To Dominate The Market.
7. Are there any restraints impacting market growth?
4.; High Operational and Maintenance Costs.
8. Can you provide examples of recent developments in the market?
April 2023: The National Composites Centre (NCC), located in Bristol, U.K., unveiled a program dedicated to testing composite cryogenic storage tanks within the United Kingdom. This initiative aims to validate and expedite the capabilities to design, manufacture, and test such tanks. The program is projected to evaluate a linerless carbon fiber tank that stores liquid hydrogen (LH2).
9. What pricing options are available for accessing the report?
Pricing options include single-user, multi-user, and enterprise licenses priced at USD 4750, USD 5250, and USD 8750 respectively.
10. Is the market size provided in terms of value or volume?
The market size is provided in terms of value, measured in Million and volume, measured in K Unit.
11. Are there any specific market keywords associated with the report?
Yes, the market keyword associated with the report is "Cryogenic Vessels Market," which aids in identifying and referencing the specific market segment covered.
12. How do I determine which pricing option suits my needs best?
The pricing options vary based on user requirements and access needs. Individual users may opt for single-user licenses, while businesses requiring broader access may choose multi-user or enterprise licenses for cost-effective access to the report.
13. Are there any additional resources or data provided in the Cryogenic Vessels Market report?
While the report offers comprehensive insights, it's advisable to review the specific contents or supplementary materials provided to ascertain if additional resources or data are available.
14. How can I stay updated on further developments or reports in the Cryogenic Vessels Market?
To stay informed about further developments, trends, and reports in the Cryogenic Vessels Market, consider subscribing to industry newsletters, following relevant companies and organizations, or regularly checking reputable industry news sources and publications.
Methodology
Step 1 - Identification of Relevant Samples Size from Population Database


Step 2 - Approaches for Defining Global Market Size (Value, Volume* & Price*)

Note*: In applicable scenarios
Step 3 - Data Sources
Primary Research
- Web Analytics
- Survey Reports
- Research Institute
- Latest Research Reports
- Opinion Leaders
Secondary Research
- Annual Reports
- White Paper
- Latest Press Release
- Industry Association
- Paid Database
- Investor Presentations

Step 4 - Data Triangulation
Involves using different sources of information in order to increase the validity of a study
These sources are likely to be stakeholders in a program - participants, other researchers, program staff, other community members, and so on.
Then we put all data in single framework & apply various statistical tools to find out the dynamic on the market.
During the analysis stage, feedback from the stakeholder groups would be compared to determine areas of agreement as well as areas of divergence