

Key Insights
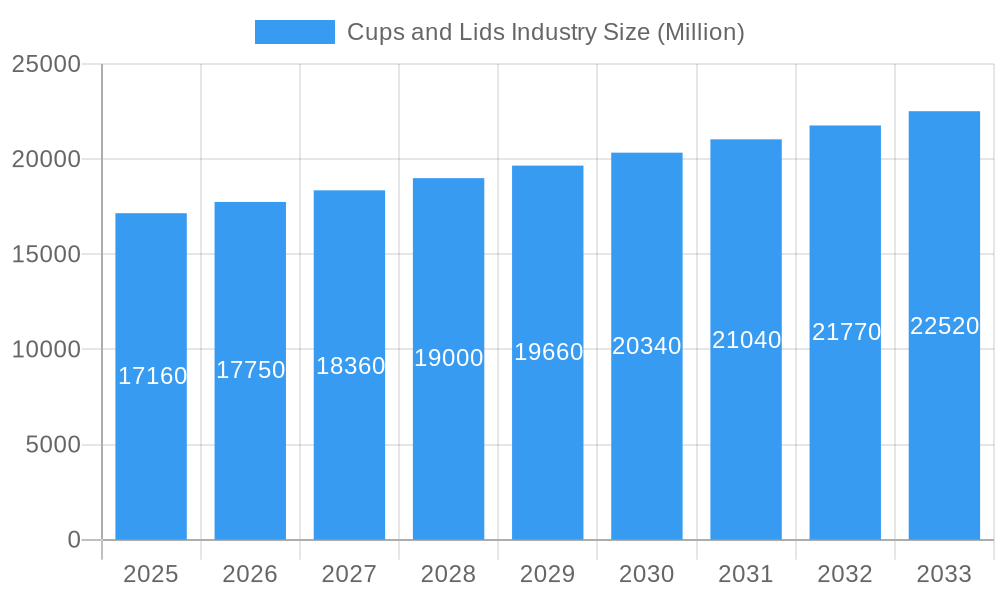
The global cups and lids market, valued at $17.16 billion in 2025, is projected to experience steady growth, driven by a compound annual growth rate (CAGR) of 3.40% from 2025 to 2033. This growth is fueled by several key factors. The burgeoning food and beverage industry, particularly the rise of quick-service restaurants and on-the-go consumption, significantly contributes to demand for disposable cups and lids. Expanding e-commerce and food delivery services further amplify this demand, requiring convenient and readily available packaging solutions. Consumer preference for eco-friendly and sustainable alternatives, such as biodegradable and compostable cups and lids made from materials like paper and bamboo, is also driving market segmentation and innovation. However, fluctuating raw material prices and increasing environmental concerns related to plastic waste pose significant challenges. Market segmentation reveals that plastic cups currently hold the largest market share, but the paper and other sustainable material segments are experiencing the most rapid growth, indicating a shift towards environmentally conscious choices. The dominance of North America and Europe is expected to continue, but significant growth opportunities are emerging in rapidly developing economies across Asia and Latin America. Competitive dynamics within the market are shaped by established players like Solo Cup and Huhtamaki, as well as emerging companies focusing on sustainable solutions.
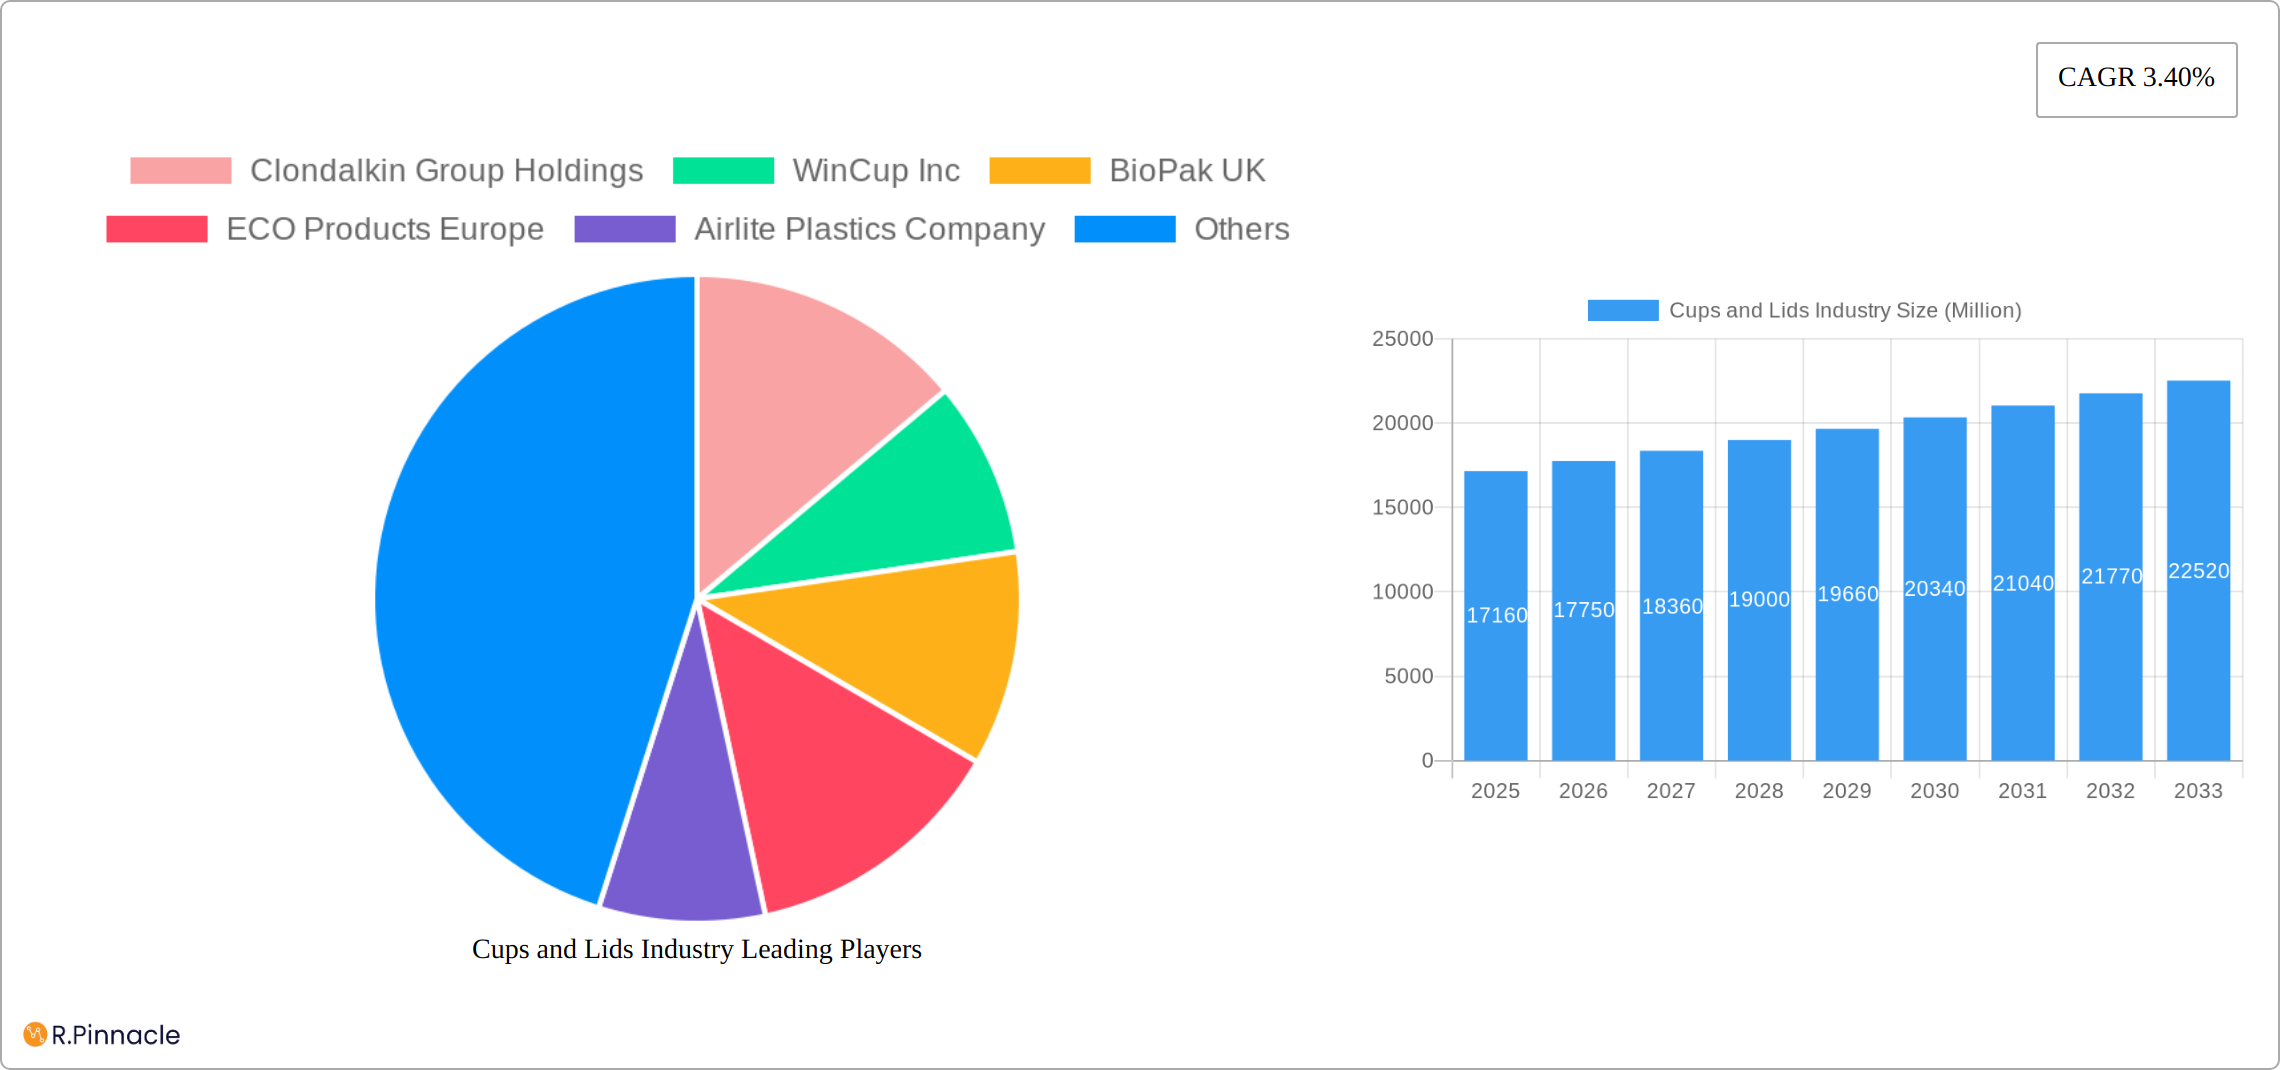
Cups and Lids Industry Market Size (In Billion)
The forecast for 2026 to 2033 anticipates a continuation of this growth trajectory, with specific segments like paper cups and sustainable materials exhibiting accelerated growth rates. Geographic expansion will play a crucial role in market expansion, with a focus on emerging markets in Asia and Latin America exhibiting significant potential for growth. Market players are responding to the growing demand for sustainability by investing in research and development of eco-friendly materials and production processes. This includes the introduction of plant-based plastics, recyclable materials, and innovative designs that minimize material usage without compromising functionality or consumer experience. Regulatory pressures to reduce plastic waste are also likely to accelerate the adoption of sustainable packaging solutions, further shaping market dynamics in the coming years.
Cups and Lids Industry Company Market Share
Cups and Lids Industry Market Report: 2019-2033
This comprehensive report provides a detailed analysis of the Cups and Lids industry, offering valuable insights for industry professionals, investors, and strategic decision-makers. With a focus on market dynamics, innovation trends, and future growth potential, this report covers the period from 2019 to 2033, using 2025 as the base year. The report projects a market size of xx Million by 2033, presenting a compelling overview of this dynamic sector.
Cups and Lids Industry Market Structure & Innovation Trends
The global cups and lids market is characterized by a moderately concentrated structure, with key players holding significant market share. Major companies such as Clondalkin Group Holdings, WinCup Inc, and Huhtamaki Oyj dominate the landscape, though numerous smaller regional players also contribute significantly. The market share of the top 5 companies is estimated at xx%.
Mergers and acquisitions (M&A) activity has been a significant driver of market consolidation, with deal values exceeding xx Million in the last five years. Innovation is fueled by increasing demand for sustainable and eco-friendly products, leading to the development of biodegradable and compostable materials. Stringent regulatory frameworks regarding plastic waste are shaping industry practices, pushing companies to invest in sustainable alternatives. The presence of substitute materials, such as bamboo and bagasse, adds another layer of complexity to the competitive landscape. The end-user demographics are diverse, encompassing food and beverage businesses, food service providers, and retail outlets.
- Market Concentration: Top 5 players hold xx% market share (estimated).
- M&A Activity: Deal values exceeding xx Million (2019-2024).
- Innovation Drivers: Sustainability, regulatory pressures, consumer demand.
- Substitute Materials: Bamboo, bagasse, etc., influencing market dynamics.
Cups and Lids Industry Market Dynamics & Trends
The cups and lids market exhibits robust growth, driven by several factors. The rising demand for convenience in food and beverage consumption fuels consistent growth across various end-use sectors. Technological advancements, particularly in material science and manufacturing processes, lead to more efficient and sustainable solutions. Changing consumer preferences, such as a preference for eco-friendly packaging, significantly impact market trends. The competitive landscape is marked by fierce competition, with companies constantly striving to enhance product offerings, optimize manufacturing processes, and explore new market opportunities. The Compound Annual Growth Rate (CAGR) for the period 2025-2033 is projected at xx%, reflecting robust growth prospects. Market penetration for sustainable cups and lids is steadily increasing, anticipated to reach xx% by 2033.
Dominant Regions & Segments in Cups and Lids Industry
The global cups and lids industry is a dynamic sector, with North America currently holding a dominant position due to its mature food service landscape and high consumer spending on convenience. However, the Asia-Pacific region is projected to experience the most rapid expansion throughout the forecast period. This surge is attributed to a burgeoning food and beverage sector, escalating disposable incomes, and an increasing adoption of modern retail and dining habits.
By Material:
- Plastic: While remaining the largest segment by volume, the plastic segment is facing increasing scrutiny and regulatory pressure due to environmental concerns surrounding single-use plastics. Innovations in recycled and recyclable plastics are becoming crucial for its sustained growth.
- Paper: This segment is witnessing substantial growth, driven by a strong consumer preference for sustainable and eco-friendly packaging alternatives. Advances in barrier coatings and printing technologies are enhancing its functionality and appeal.
- Foam: The market share of foam cups and lids is experiencing a decline due to stringent environmental regulations and a growing public awareness of their environmental impact.
- Other Materials: This category, encompassing biodegradable, compostable, and plant-based materials, represents a high-growth area. Consumer demand for truly sustainable options is fueling innovation and market penetration for these alternatives.
By Product:
- Drinking Cups: This remains the largest and most fundamental segment, driven by the consistent and high demand for both hot and cold beverages across various settings, particularly for on-the-go consumption.
- Packaging Cups: This segment is experiencing robust growth, intrinsically linked to the phenomenal expansion of food delivery and takeaway services. These cups are designed for durability and often include specialized features for food preservation.
- Lids: The market for lids is inextricably linked to the performance of the cups segment. Innovations in lid design focus on spill resistance, secure closures, and enhanced user experience, often mirroring the material trends seen in cups.
By End-User Vertical:
- Food and Beverage: This is the primary and largest end-use sector, encompassing a vast array of products that require efficient and safe packaging. The demand for both single-serving and bulk packaging solutions is significant.
- Foodservices: This segment is a major contributor to market growth, heavily influenced by the expansion of fast-food chains, casual dining restaurants, coffee shops, and catering services that rely heavily on disposable and convenient packaging.
- Retail: The retail sector is a growing consumer of cups and lids, particularly for pre-packaged food and beverage items sold in supermarkets and convenience stores. This includes items like yogurt cups, deli containers, and ready-to-drink beverage packaging.
Key growth drivers underpinning these dominant regions and segments include a strong global economic outlook, the continuous expansion of food service networks, and an increasing prevalence of supportive government policies that encourage the adoption of sustainable and innovative packaging solutions.
Cups and Lids Industry Product Innovations
Recent innovations in the cups and lids industry primarily focus on sustainability and recyclability. The development of thin-walled rPET cups using injection molding technology is a notable example, offering a more eco-friendly alternative to traditional plastic cups. Furthermore, advancements in molded fiber technology, coupled with water and oil barriers, aim to enhance the recyclability of fiber-based packaging. These improvements address consumer and regulatory demands for environmentally conscious options, offering competitive advantages to manufacturers who adopt these innovations.
Report Scope & Segmentation Analysis
This report segments the market by material (plastic, paper, foam, other), product type (drinking cups, packaging cups, lids), and end-user vertical (food and beverage, food services, retail, others). Each segment’s growth projections, market sizes, and competitive dynamics are thoroughly analyzed, providing a comprehensive understanding of the market landscape. The report also details historic data from 2019-2024, base year data for 2025, and forecast data until 2033.
Key Drivers of Cups and Lids Industry Growth
The cups and lids industry is propelled by a confluence of powerful market forces. A significant driver is the sustained rise in disposable incomes, particularly within emerging economies, which directly translates to an increased demand for convenient and portable food and beverage packaging solutions. The rapid and ongoing expansion of the global foodservice sector, coupled with the escalating popularity of takeaway and delivery services facilitated by digital platforms, further amplifies market growth. Moreover, continuous technological advancements are playing a pivotal role. Innovations in materials science are leading to the development of lighter, more durable, and importantly, more sustainable packaging options. Simultaneously, advancements in manufacturing techniques are enhancing production efficiency and cost-effectiveness, thereby fostering market expansion and enabling greater product variety.
Challenges in the Cups and Lids Industry Sector
Despite its growth trajectory, the cups and lids industry navigates several significant challenges. Volatility in raw material prices, such as for plastics and paper pulp, can substantially impact manufacturing costs and, consequently, profitability. The escalating global concern over plastic waste and the implementation of stringent environmental regulations, including bans on certain single-use plastics, pose a considerable hurdle, necessitating substantial investment in research and development for sustainable alternatives. The industry is also characterized by intense competition, with numerous established players and agile smaller regional manufacturers vying for market share, which often puts pressure on profit margins and demands continuous innovation. Furthermore, supply chain disruptions, ranging from the sourcing of raw materials to logistical complexities, can significantly affect production capabilities, lead times, and overall product availability, impacting the reliability of supply to end-users.
Emerging Opportunities in Cups and Lids Industry
The cups and lids industry is ripe with emerging opportunities, largely driven by evolving consumer preferences and a growing global consciousness towards environmental sustainability. The escalating demand for eco-friendly, compostable, and biodegradable packaging presents a substantial and rapidly growing market segment. Innovations in plant-based materials, recycled content, and advanced bioplastics offer lucrative avenues for companies to cater to environmentally aware consumers. The trend towards personalization and customization in branding and packaging also opens up opportunities for differentiation and premium pricing strategies. As businesses seek to enhance their brand visibility and customer engagement, custom-designed cups and lids are becoming increasingly sought after. Furthermore, expanding into new and untapped geographical markets, particularly in developing economies with rapidly growing foodservice sectors and a burgeoning middle class, offers significant untapped growth potential for innovative and sustainable packaging solutions.
Leading Players in the Cups and Lids Industry Market
- Clondalkin Group Holdings
- WinCup Inc
- BioPak UK
- ECO Products Europe
- Airlite Plastics Company
- Brendos Ltd
- Dart Container
- Paper Cup Company
- Solo Cup Operating Corporation
- Mondi Group
- Georgia-Pacific LLC
- Greiner Holding AG
- Greiner AG
- Graphic Packaging International LLC
- Berry Global
- Printpack Inc
- Reynolds Consumer Products
- Huhtamaki Oyj
- Michael Procos SA
Key Developments in Cups and Lids Industry
- April 2023: Greiner Packaging, Engel, and Brink jointly developed a thin-walled rPET cup using injection molding, reducing CO2e emissions.
- April 2022: PulPac and HSMG collaborated on water and oil barriers for PulPac Dry Molded fiber technology, improving the recyclability of molded fiber packaging.
Future Outlook for Cups and Lids Industry Market
The future outlook for the cups and lids industry remains exceptionally positive, with sustained growth anticipated. The pivotal role of sustainability will continue to shape the market's trajectory, driving innovation in eco-friendly materials and production processes. Companies that proactively invest in and champion biodegradable, compostable, and recyclable packaging solutions are poised for significant success. Strategic partnerships and collaborations will become increasingly crucial for accelerating research and development, expanding market reach, and navigating complex regulatory landscapes. The industry will likely witness a greater emphasis on circular economy principles, with a focus on reducing waste and maximizing resource utilization. Ultimately, companies that demonstrate agility in adapting to evolving consumer demands, embrace robust sustainable practices, and foster innovation are most likely to thrive and lead the market in the coming years.
Cups and Lids Industry Segmentation
-
1. Material
- 1.1. Plastic
- 1.2. Paper
- 1.3. Foam
- 1.4. Other Materials
-
2. Product
- 2.1. Drinking Cups
- 2.2. Packagin
- 2.3. Lids
-
3. End-User Vertical
- 3.1. Food and Beverage
- 3.2. Foodservices
- 3.3. Retail and Other End User Verticals
Cups and Lids Industry Segmentation By Geography
-
1. North America
- 1.1. United States
- 1.2. Canada
-
2. Europe
- 2.1. United kingdom
- 2.2. France
- 2.3. Germany
-
3. Asia
- 3.1. China
- 3.2. Japan
- 3.3. India
- 3.4. Australia and New Zealand
-
4. Latin America
- 4.1. Brazil
- 4.2. Mexico
-
5. Middle East and Africa
- 5.1. United Arab Emirates
- 5.2. South Africa
- 5.3. Saudi Arabia
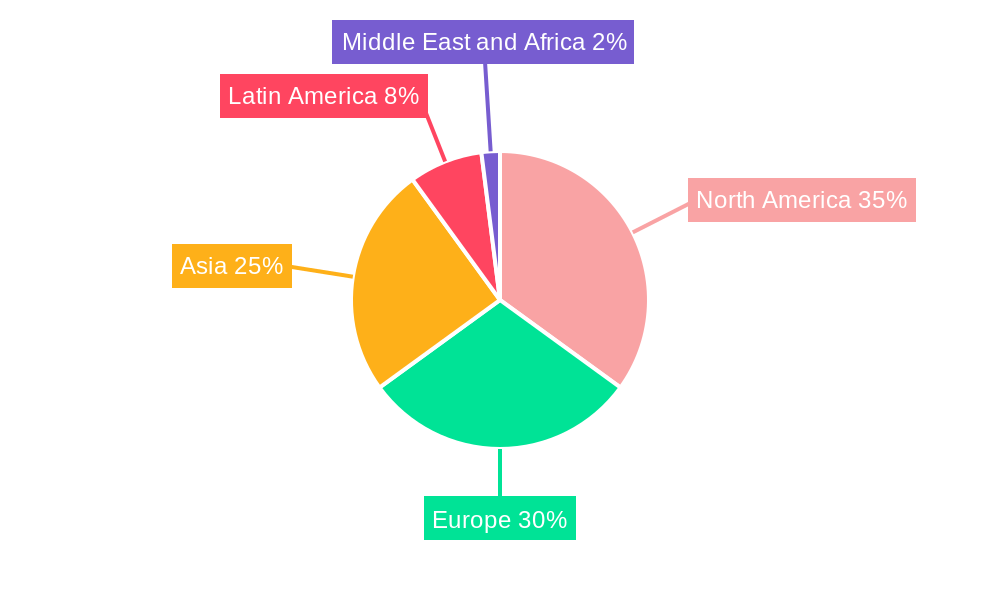
Cups and Lids Industry Regional Market Share
Geographic Coverage of Cups and Lids Industry
Cups and Lids Industry REPORT HIGHLIGHTS
| Aspects | Details |
|---|---|
| Study Period | 2020-2034 |
| Base Year | 2025 |
| Estimated Year | 2026 |
| Forecast Period | 2026-2034 |
| Historical Period | 2020-2025 |
| Growth Rate | CAGR of 3.40% from 2020-2034 |
| Segmentation |
|
Table of Contents
- 1. Introduction
- 1.1. Research Scope
- 1.2. Market Segmentation
- 1.3. Research Objective
- 1.4. Definitions and Assumptions
- 2. Executive Summary
- 2.1. Market Snapshot
- 3. Market Dynamics
- 3.1. Market Drivers
- 3.2. Market Restrains
- 3.3. Market Trends
- 3.4. Market Opportunities
- 4. Market Factor Analysis
- 4.1. Porters Five Forces
- 4.1.1. Bargaining Power of Suppliers
- 4.1.2. Bargaining Power of Buyers
- 4.1.3. Threat of New Entrants
- 4.1.4. Threat of Substitutes
- 4.1.5. Competitive Rivalry
- 4.2. PESTEL analysis
- 4.3. BCG Analysis
- 4.3.1. Stars (High Growth, High Market Share)
- 4.3.2. Cash Cows (Low Growth, High Market Share)
- 4.3.3. Question Mark (High Growth, Low Market Share)
- 4.3.4. Dogs (Low Growth, Low Market Share)
- 4.4. Ansoff Matrix Analysis
- 4.5. Supply Chain Analysis
- 4.6. Regulatory Landscape
- 4.7. Current Market Potential and Opportunity Assessment (TAM–SAM–SOM Framework)
- 4.8. PRI Analyst Note
- 4.1. Porters Five Forces
- 5. Market Analysis, Insights and Forecast 2021-2033
- 5.1. Market Analysis, Insights and Forecast - by Material
- 5.1.1. Plastic
- 5.1.2. Paper
- 5.1.3. Foam
- 5.1.4. Other Materials
- 5.2. Market Analysis, Insights and Forecast - by Product
- 5.2.1. Drinking Cups
- 5.2.2. Packagin
- 5.2.3. Lids
- 5.3. Market Analysis, Insights and Forecast - by End-User Vertical
- 5.3.1. Food and Beverage
- 5.3.2. Foodservices
- 5.3.3. Retail and Other End User Verticals
- 5.4. Market Analysis, Insights and Forecast - by Region
- 5.4.1. North America
- 5.4.2. Europe
- 5.4.3. Asia
- 5.4.4. Latin America
- 5.4.5. Middle East and Africa
- 5.1. Market Analysis, Insights and Forecast - by Material
- 6. Global Cups and Lids Industry Analysis, Insights and Forecast, 2021-2033
- 6.1. Market Analysis, Insights and Forecast - by Material
- 6.1.1. Plastic
- 6.1.2. Paper
- 6.1.3. Foam
- 6.1.4. Other Materials
- 6.2. Market Analysis, Insights and Forecast - by Product
- 6.2.1. Drinking Cups
- 6.2.2. Packagin
- 6.2.3. Lids
- 6.3. Market Analysis, Insights and Forecast - by End-User Vertical
- 6.3.1. Food and Beverage
- 6.3.2. Foodservices
- 6.3.3. Retail and Other End User Verticals
- 6.1. Market Analysis, Insights and Forecast - by Material
- 7. North America Cups and Lids Industry Analysis, Insights and Forecast, 2020-2032
- 7.1. Market Analysis, Insights and Forecast - by Material
- 7.1.1. Plastic
- 7.1.2. Paper
- 7.1.3. Foam
- 7.1.4. Other Materials
- 7.2. Market Analysis, Insights and Forecast - by Product
- 7.2.1. Drinking Cups
- 7.2.2. Packagin
- 7.2.3. Lids
- 7.3. Market Analysis, Insights and Forecast - by End-User Vertical
- 7.3.1. Food and Beverage
- 7.3.2. Foodservices
- 7.3.3. Retail and Other End User Verticals
- 7.1. Market Analysis, Insights and Forecast - by Material
- 8. Europe Cups and Lids Industry Analysis, Insights and Forecast, 2020-2032
- 8.1. Market Analysis, Insights and Forecast - by Material
- 8.1.1. Plastic
- 8.1.2. Paper
- 8.1.3. Foam
- 8.1.4. Other Materials
- 8.2. Market Analysis, Insights and Forecast - by Product
- 8.2.1. Drinking Cups
- 8.2.2. Packagin
- 8.2.3. Lids
- 8.3. Market Analysis, Insights and Forecast - by End-User Vertical
- 8.3.1. Food and Beverage
- 8.3.2. Foodservices
- 8.3.3. Retail and Other End User Verticals
- 8.1. Market Analysis, Insights and Forecast - by Material
- 9. Asia Cups and Lids Industry Analysis, Insights and Forecast, 2020-2032
- 9.1. Market Analysis, Insights and Forecast - by Material
- 9.1.1. Plastic
- 9.1.2. Paper
- 9.1.3. Foam
- 9.1.4. Other Materials
- 9.2. Market Analysis, Insights and Forecast - by Product
- 9.2.1. Drinking Cups
- 9.2.2. Packagin
- 9.2.3. Lids
- 9.3. Market Analysis, Insights and Forecast - by End-User Vertical
- 9.3.1. Food and Beverage
- 9.3.2. Foodservices
- 9.3.3. Retail and Other End User Verticals
- 9.1. Market Analysis, Insights and Forecast - by Material
- 10. Latin America Cups and Lids Industry Analysis, Insights and Forecast, 2020-2032
- 10.1. Market Analysis, Insights and Forecast - by Material
- 10.1.1. Plastic
- 10.1.2. Paper
- 10.1.3. Foam
- 10.1.4. Other Materials
- 10.2. Market Analysis, Insights and Forecast - by Product
- 10.2.1. Drinking Cups
- 10.2.2. Packagin
- 10.2.3. Lids
- 10.3. Market Analysis, Insights and Forecast - by End-User Vertical
- 10.3.1. Food and Beverage
- 10.3.2. Foodservices
- 10.3.3. Retail and Other End User Verticals
- 10.1. Market Analysis, Insights and Forecast - by Material
- 11. Middle East and Africa Cups and Lids Industry Analysis, Insights and Forecast, 2020-2032
- 11.1. Market Analysis, Insights and Forecast - by Material
- 11.1.1. Plastic
- 11.1.2. Paper
- 11.1.3. Foam
- 11.1.4. Other Materials
- 11.2. Market Analysis, Insights and Forecast - by Product
- 11.2.1. Drinking Cups
- 11.2.2. Packagin
- 11.2.3. Lids
- 11.3. Market Analysis, Insights and Forecast - by End-User Vertical
- 11.3.1. Food and Beverage
- 11.3.2. Foodservices
- 11.3.3. Retail and Other End User Verticals
- 11.1. Market Analysis, Insights and Forecast - by Material
- 12. Competitive Analysis
- 12.1. Company Profiles
- 12.1.1 Clondalkin Group Holdings
- 12.1.1.1. Company Overview
- 12.1.1.2. Products
- 12.1.1.3. Company Financials
- 12.1.1.4. SWOT Analysis
- 12.1.2 WinCup Inc
- 12.1.2.1. Company Overview
- 12.1.2.2. Products
- 12.1.2.3. Company Financials
- 12.1.2.4. SWOT Analysis
- 12.1.3 BioPak UK
- 12.1.3.1. Company Overview
- 12.1.3.2. Products
- 12.1.3.3. Company Financials
- 12.1.3.4. SWOT Analysis
- 12.1.4 ECO Products Europe
- 12.1.4.1. Company Overview
- 12.1.4.2. Products
- 12.1.4.3. Company Financials
- 12.1.4.4. SWOT Analysis
- 12.1.5 Airlite Plastics Company
- 12.1.5.1. Company Overview
- 12.1.5.2. Products
- 12.1.5.3. Company Financials
- 12.1.5.4. SWOT Analysis
- 12.1.6 Brendos Ltd
- 12.1.6.1. Company Overview
- 12.1.6.2. Products
- 12.1.6.3. Company Financials
- 12.1.6.4. SWOT Analysis
- 12.1.7 Dart Containe
- 12.1.7.1. Company Overview
- 12.1.7.2. Products
- 12.1.7.3. Company Financials
- 12.1.7.4. SWOT Analysis
- 12.1.8 Paper Cup Company
- 12.1.8.1. Company Overview
- 12.1.8.2. Products
- 12.1.8.3. Company Financials
- 12.1.8.4. SWOT Analysis
- 12.1.9 Solo Cup Operating Corporation
- 12.1.9.1. Company Overview
- 12.1.9.2. Products
- 12.1.9.3. Company Financials
- 12.1.9.4. SWOT Analysis
- 12.1.10 Mondi Group
- 12.1.10.1. Company Overview
- 12.1.10.2. Products
- 12.1.10.3. Company Financials
- 12.1.10.4. SWOT Analysis
- 12.1.11 Georgia-Pacific LLC
- 12.1.11.1. Company Overview
- 12.1.11.2. Products
- 12.1.11.3. Company Financials
- 12.1.11.4. SWOT Analysis
- 12.1.12 Greiner Holding AG
- 12.1.12.1. Company Overview
- 12.1.12.2. Products
- 12.1.12.3. Company Financials
- 12.1.12.4. SWOT Analysis
- 12.1.13 Greiner AG
- 12.1.13.1. Company Overview
- 12.1.13.2. Products
- 12.1.13.3. Company Financials
- 12.1.13.4. SWOT Analysis
- 12.1.14 Graphic Packaging International LLC
- 12.1.14.1. Company Overview
- 12.1.14.2. Products
- 12.1.14.3. Company Financials
- 12.1.14.4. SWOT Analysis
- 12.1.15 Berry Global
- 12.1.15.1. Company Overview
- 12.1.15.2. Products
- 12.1.15.3. Company Financials
- 12.1.15.4. SWOT Analysis
- 12.1.16 Printpack Inc
- 12.1.16.1. Company Overview
- 12.1.16.2. Products
- 12.1.16.3. Company Financials
- 12.1.16.4. SWOT Analysis
- 12.1.17 Reynolds Consumer Products
- 12.1.17.1. Company Overview
- 12.1.17.2. Products
- 12.1.17.3. Company Financials
- 12.1.17.4. SWOT Analysis
- 12.1.18 Huhtamaki Oyj
- 12.1.18.1. Company Overview
- 12.1.18.2. Products
- 12.1.18.3. Company Financials
- 12.1.18.4. SWOT Analysis
- 12.1.19 Michael Procos SA
- 12.1.19.1. Company Overview
- 12.1.19.2. Products
- 12.1.19.3. Company Financials
- 12.1.19.4. SWOT Analysis
- 12.1.1 Clondalkin Group Holdings
- 12.2. Market Entropy
- 12.2.1 Company's Key Areas Served
- 12.2.2 Recent Developments
- 12.3. Company Market Share Analysis 2025
- 12.3.1 Top 5 Companies Market Share Analysis
- 12.3.2 Top 3 Companies Market Share Analysis
- 12.4. List of Potential Customers
- 13. Research Methodology
List of Figures
- Figure 1: Global Cups and Lids Industry Revenue Breakdown (Million, %) by Region 2025 & 2033
- Figure 2: North America Cups and Lids Industry Revenue (Million), by Material 2025 & 2033
- Figure 3: North America Cups and Lids Industry Revenue Share (%), by Material 2025 & 2033
- Figure 4: North America Cups and Lids Industry Revenue (Million), by Product 2025 & 2033
- Figure 5: North America Cups and Lids Industry Revenue Share (%), by Product 2025 & 2033
- Figure 6: North America Cups and Lids Industry Revenue (Million), by End-User Vertical 2025 & 2033
- Figure 7: North America Cups and Lids Industry Revenue Share (%), by End-User Vertical 2025 & 2033
- Figure 8: North America Cups and Lids Industry Revenue (Million), by Country 2025 & 2033
- Figure 9: North America Cups and Lids Industry Revenue Share (%), by Country 2025 & 2033
- Figure 10: Europe Cups and Lids Industry Revenue (Million), by Material 2025 & 2033
- Figure 11: Europe Cups and Lids Industry Revenue Share (%), by Material 2025 & 2033
- Figure 12: Europe Cups and Lids Industry Revenue (Million), by Product 2025 & 2033
- Figure 13: Europe Cups and Lids Industry Revenue Share (%), by Product 2025 & 2033
- Figure 14: Europe Cups and Lids Industry Revenue (Million), by End-User Vertical 2025 & 2033
- Figure 15: Europe Cups and Lids Industry Revenue Share (%), by End-User Vertical 2025 & 2033
- Figure 16: Europe Cups and Lids Industry Revenue (Million), by Country 2025 & 2033
- Figure 17: Europe Cups and Lids Industry Revenue Share (%), by Country 2025 & 2033
- Figure 18: Asia Cups and Lids Industry Revenue (Million), by Material 2025 & 2033
- Figure 19: Asia Cups and Lids Industry Revenue Share (%), by Material 2025 & 2033
- Figure 20: Asia Cups and Lids Industry Revenue (Million), by Product 2025 & 2033
- Figure 21: Asia Cups and Lids Industry Revenue Share (%), by Product 2025 & 2033
- Figure 22: Asia Cups and Lids Industry Revenue (Million), by End-User Vertical 2025 & 2033
- Figure 23: Asia Cups and Lids Industry Revenue Share (%), by End-User Vertical 2025 & 2033
- Figure 24: Asia Cups and Lids Industry Revenue (Million), by Country 2025 & 2033
- Figure 25: Asia Cups and Lids Industry Revenue Share (%), by Country 2025 & 2033
- Figure 26: Latin America Cups and Lids Industry Revenue (Million), by Material 2025 & 2033
- Figure 27: Latin America Cups and Lids Industry Revenue Share (%), by Material 2025 & 2033
- Figure 28: Latin America Cups and Lids Industry Revenue (Million), by Product 2025 & 2033
- Figure 29: Latin America Cups and Lids Industry Revenue Share (%), by Product 2025 & 2033
- Figure 30: Latin America Cups and Lids Industry Revenue (Million), by End-User Vertical 2025 & 2033
- Figure 31: Latin America Cups and Lids Industry Revenue Share (%), by End-User Vertical 2025 & 2033
- Figure 32: Latin America Cups and Lids Industry Revenue (Million), by Country 2025 & 2033
- Figure 33: Latin America Cups and Lids Industry Revenue Share (%), by Country 2025 & 2033
- Figure 34: Middle East and Africa Cups and Lids Industry Revenue (Million), by Material 2025 & 2033
- Figure 35: Middle East and Africa Cups and Lids Industry Revenue Share (%), by Material 2025 & 2033
- Figure 36: Middle East and Africa Cups and Lids Industry Revenue (Million), by Product 2025 & 2033
- Figure 37: Middle East and Africa Cups and Lids Industry Revenue Share (%), by Product 2025 & 2033
- Figure 38: Middle East and Africa Cups and Lids Industry Revenue (Million), by End-User Vertical 2025 & 2033
- Figure 39: Middle East and Africa Cups and Lids Industry Revenue Share (%), by End-User Vertical 2025 & 2033
- Figure 40: Middle East and Africa Cups and Lids Industry Revenue (Million), by Country 2025 & 2033
- Figure 41: Middle East and Africa Cups and Lids Industry Revenue Share (%), by Country 2025 & 2033
List of Tables
- Table 1: Global Cups and Lids Industry Revenue Million Forecast, by Material 2020 & 2033
- Table 2: Global Cups and Lids Industry Revenue Million Forecast, by Product 2020 & 2033
- Table 3: Global Cups and Lids Industry Revenue Million Forecast, by End-User Vertical 2020 & 2033
- Table 4: Global Cups and Lids Industry Revenue Million Forecast, by Region 2020 & 2033
- Table 5: Global Cups and Lids Industry Revenue Million Forecast, by Material 2020 & 2033
- Table 6: Global Cups and Lids Industry Revenue Million Forecast, by Product 2020 & 2033
- Table 7: Global Cups and Lids Industry Revenue Million Forecast, by End-User Vertical 2020 & 2033
- Table 8: Global Cups and Lids Industry Revenue Million Forecast, by Country 2020 & 2033
- Table 9: United States Cups and Lids Industry Revenue (Million) Forecast, by Application 2020 & 2033
- Table 10: Canada Cups and Lids Industry Revenue (Million) Forecast, by Application 2020 & 2033
- Table 11: Global Cups and Lids Industry Revenue Million Forecast, by Material 2020 & 2033
- Table 12: Global Cups and Lids Industry Revenue Million Forecast, by Product 2020 & 2033
- Table 13: Global Cups and Lids Industry Revenue Million Forecast, by End-User Vertical 2020 & 2033
- Table 14: Global Cups and Lids Industry Revenue Million Forecast, by Country 2020 & 2033
- Table 15: United kingdom Cups and Lids Industry Revenue (Million) Forecast, by Application 2020 & 2033
- Table 16: France Cups and Lids Industry Revenue (Million) Forecast, by Application 2020 & 2033
- Table 17: Germany Cups and Lids Industry Revenue (Million) Forecast, by Application 2020 & 2033
- Table 18: Global Cups and Lids Industry Revenue Million Forecast, by Material 2020 & 2033
- Table 19: Global Cups and Lids Industry Revenue Million Forecast, by Product 2020 & 2033
- Table 20: Global Cups and Lids Industry Revenue Million Forecast, by End-User Vertical 2020 & 2033
- Table 21: Global Cups and Lids Industry Revenue Million Forecast, by Country 2020 & 2033
- Table 22: China Cups and Lids Industry Revenue (Million) Forecast, by Application 2020 & 2033
- Table 23: Japan Cups and Lids Industry Revenue (Million) Forecast, by Application 2020 & 2033
- Table 24: India Cups and Lids Industry Revenue (Million) Forecast, by Application 2020 & 2033
- Table 25: Australia and New Zealand Cups and Lids Industry Revenue (Million) Forecast, by Application 2020 & 2033
- Table 26: Global Cups and Lids Industry Revenue Million Forecast, by Material 2020 & 2033
- Table 27: Global Cups and Lids Industry Revenue Million Forecast, by Product 2020 & 2033
- Table 28: Global Cups and Lids Industry Revenue Million Forecast, by End-User Vertical 2020 & 2033
- Table 29: Global Cups and Lids Industry Revenue Million Forecast, by Country 2020 & 2033
- Table 30: Brazil Cups and Lids Industry Revenue (Million) Forecast, by Application 2020 & 2033
- Table 31: Mexico Cups and Lids Industry Revenue (Million) Forecast, by Application 2020 & 2033
- Table 32: Global Cups and Lids Industry Revenue Million Forecast, by Material 2020 & 2033
- Table 33: Global Cups and Lids Industry Revenue Million Forecast, by Product 2020 & 2033
- Table 34: Global Cups and Lids Industry Revenue Million Forecast, by End-User Vertical 2020 & 2033
- Table 35: Global Cups and Lids Industry Revenue Million Forecast, by Country 2020 & 2033
- Table 36: United Arab Emirates Cups and Lids Industry Revenue (Million) Forecast, by Application 2020 & 2033
- Table 37: South Africa Cups and Lids Industry Revenue (Million) Forecast, by Application 2020 & 2033
- Table 38: Saudi Arabia Cups and Lids Industry Revenue (Million) Forecast, by Application 2020 & 2033
Frequently Asked Questions
1. What is the projected Compound Annual Growth Rate (CAGR) of the Cups and Lids Industry?
The projected CAGR is approximately 3.40%.
2. Which companies are prominent players in the Cups and Lids Industry?
Key companies in the market include Clondalkin Group Holdings, WinCup Inc, BioPak UK, ECO Products Europe, Airlite Plastics Company, Brendos Ltd, Dart Containe, Paper Cup Company, Solo Cup Operating Corporation, Mondi Group, Georgia-Pacific LLC, Greiner Holding AG, Greiner AG, Graphic Packaging International LLC, Berry Global, Printpack Inc, Reynolds Consumer Products, Huhtamaki Oyj, Michael Procos SA.
3. What are the main segments of the Cups and Lids Industry?
The market segments include Material, Product, End-User Vertical.
4. Can you provide details about the market size?
The market size is estimated to be USD 17.16 Million as of 2022.
5. What are some drivers contributing to market growth?
Food and Beverage Segment to Witness Significant Growth; Growing Number of QSR Aids to Market Growth.
6. What are the notable trends driving market growth?
Food and Beverage Segment to Witness Significant Growth.
7. Are there any restraints impacting market growth?
Various Regulations Pertaining to Plastic Usage.
8. Can you provide examples of recent developments in the market?
April 2023 - Greiner Packaging, Engel, and Brink have jointly developed a thin-walled cup of rPET that can be produced using injection molding technology and claims to reduce CO2 equivalent CO2e emissions.
9. What pricing options are available for accessing the report?
Pricing options include single-user, multi-user, and enterprise licenses priced at USD 4750, USD 5250, and USD 8750 respectively.
10. Is the market size provided in terms of value or volume?
The market size is provided in terms of value, measured in Million.
11. Are there any specific market keywords associated with the report?
Yes, the market keyword associated with the report is "Cups and Lids Industry," which aids in identifying and referencing the specific market segment covered.
12. How do I determine which pricing option suits my needs best?
The pricing options vary based on user requirements and access needs. Individual users may opt for single-user licenses, while businesses requiring broader access may choose multi-user or enterprise licenses for cost-effective access to the report.
13. Are there any additional resources or data provided in the Cups and Lids Industry report?
While the report offers comprehensive insights, it's advisable to review the specific contents or supplementary materials provided to ascertain if additional resources or data are available.
14. How can I stay updated on further developments or reports in the Cups and Lids Industry?
To stay informed about further developments, trends, and reports in the Cups and Lids Industry, consider subscribing to industry newsletters, following relevant companies and organizations, or regularly checking reputable industry news sources and publications.
Methodology
Step 1 - Identification of Relevant Samples Size from Population Database


Step 2 - Approaches for Defining Global Market Size (Value, Volume* & Price*)

Note*: In applicable scenarios
Step 3 - Data Sources
Primary Research
- Web Analytics
- Survey Reports
- Research Institute
- Latest Research Reports
- Opinion Leaders
Secondary Research
- Annual Reports
- White Paper
- Latest Press Release
- Industry Association
- Paid Database
- Investor Presentations

Step 4 - Data Triangulation
Involves using different sources of information in order to increase the validity of a study
These sources are likely to be stakeholders in a program - participants, other researchers, program staff, other community members, and so on.
Then we put all data in single framework & apply various statistical tools to find out the dynamic on the market.
During the analysis stage, feedback from the stakeholder groups would be compared to determine areas of agreement as well as areas of divergence