
Key Insights
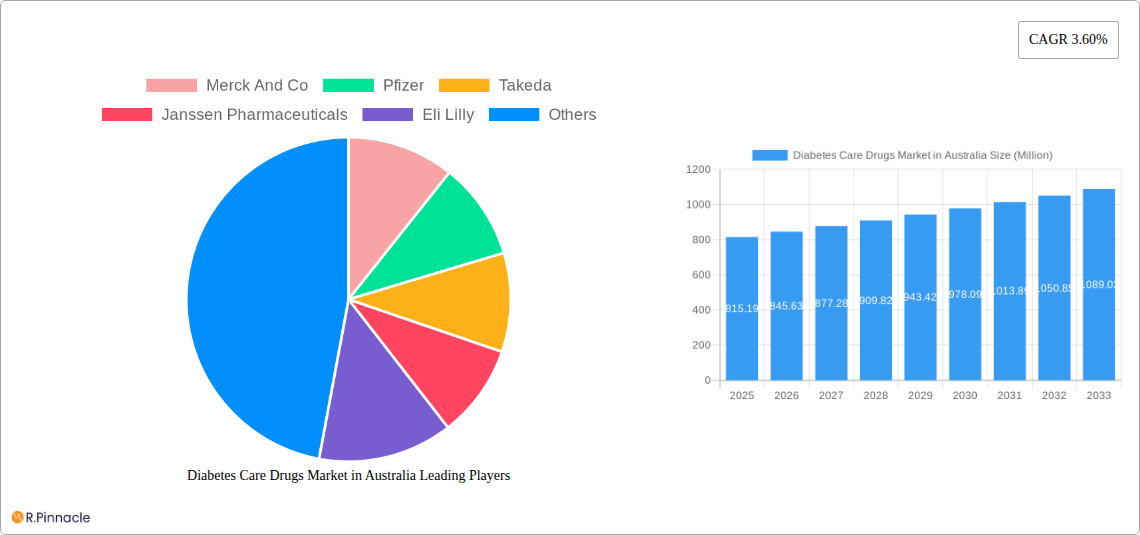
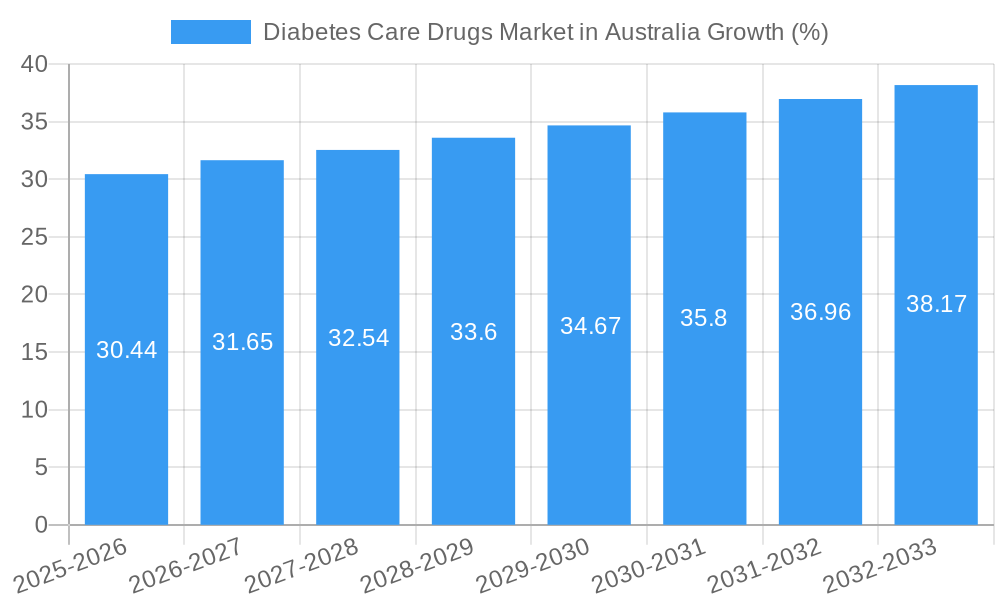
The Australian diabetes care drugs market, valued at $815.19 million in 2025, is projected to experience steady growth, driven by rising prevalence of diabetes and an aging population. A Compound Annual Growth Rate (CAGR) of 3.60% from 2025 to 2033 indicates a significant market expansion over the forecast period. Key growth drivers include increasing awareness of diabetes management, improved access to advanced therapies like GLP-1 receptor agonists and SGLT-2 inhibitors, and the introduction of innovative insulin formulations. The market is segmented by drug class, reflecting diverse treatment approaches. Insulin-based therapies, including basal/long-acting insulins, bolus/fast-acting insulins, and insulin combinations, represent a substantial portion of the market due to their efficacy in managing blood glucose levels. Oral anti-diabetic drugs, such as biguanides, sulfonylureas, meglitinides, and DPP-4 inhibitors, cater to a broader patient population, contributing significantly to the overall market size. However, the market faces some restraints, including potential side effects associated with certain drug classes, high treatment costs limiting accessibility for some patients, and the need for continuous patient education and adherence to treatment plans. The competitive landscape is characterized by leading pharmaceutical companies like Novo Nordisk, Sanofi, Eli Lilly, and AstraZeneca, constantly striving to improve existing therapies and develop innovative solutions to meet evolving patient needs. Further market penetration could be driven by government initiatives aimed at improving diabetes management and patient outcomes.
The success of individual drug segments will be determined by factors such as efficacy, safety profiles, pricing strategies, and market acceptance. The market's growth will likely be influenced by advancements in drug delivery systems, personalized medicine approaches, and ongoing research into novel therapeutic options for diabetes management. Strategic partnerships between pharmaceutical companies and healthcare providers could play a crucial role in improving patient access and adherence, thus driving further expansion of the Australian diabetes care drugs market. Competitive dynamics will intensify, with companies focusing on research and development, strategic acquisitions, and robust marketing campaigns to capture market share.
Diabetes Care Drugs Market in Australia: A Comprehensive Report (2019-2033)
This comprehensive report provides an in-depth analysis of the Diabetes Care Drugs market in Australia, covering the period 2019-2033. It offers actionable insights for industry professionals, investors, and stakeholders seeking to understand the market's dynamics, growth potential, and competitive landscape. The report leverages extensive data analysis and market research to present a detailed overview of market segmentation, leading players, and future trends. The Australian diabetes care drug market, valued at xx Million in 2025, is projected to witness significant growth, reaching xx Million by 2033, exhibiting a CAGR of xx% during the forecast period (2025-2033).
Diabetes Care Drugs Market in Australia Market Structure & Innovation Trends
The Australian diabetes care drugs market is characterized by a moderately concentrated landscape, with several multinational pharmaceutical companies holding significant market share. Key players like Merck And Co, Pfizer, Takeda, Janssen Pharmaceuticals, Eli Lilly, Novartis, AstraZeneca, Bristol Myers Squibb, Novo Nordisk, Boehringer Ingelheim, Sanofi, and Astellas drive innovation and competition.
- Market Concentration: The top 5 players account for approximately xx% of the market share in 2025.
- Innovation Drivers: The market is driven by the need for improved efficacy, safety, and convenience of diabetes treatments, leading to continuous R&D in novel drug delivery systems and drug combinations.
- Regulatory Frameworks: The Therapeutic Goods Administration (TGA) plays a crucial role in regulating the market, influencing drug approvals and pricing.
- Product Substitutes: Competition arises from both branded and generic drugs, as well as alternative therapies.
- End-User Demographics: The aging population and increasing prevalence of diabetes are key growth drivers.
- M&A Activities: Consolidation through mergers and acquisitions is expected to continue, with potential deal values ranging from xx Million to xx Million in the coming years.
Diabetes Care Drugs Market in Australia Market Dynamics & Trends
The Australian diabetes care drugs market is experiencing robust growth driven by several factors. The rising prevalence of type 1 and type 2 diabetes, coupled with an aging population, is a significant contributor to market expansion. Technological advancements in drug delivery systems, such as insulin pens and pumps, are improving patient compliance and treatment outcomes. Furthermore, the increasing awareness of diabetes management and the availability of government initiatives to increase access to affordable medications are positively impacting market growth. However, price controls and generic competition pose challenges to market expansion. The market is also witnessing a shift towards newer classes of drugs, such as GLP-1 receptor agonists and SGLT-2 inhibitors, which offer superior glycemic control and cardiovascular benefits. Competitive intensity remains high, with companies focusing on R&D, brand building, and strategic partnerships to maintain market share. The market penetration of newer therapies is steadily increasing, fueled by their clinical advantages.
Dominant Regions & Segments in Diabetes Care Drugs Market in Australia
The Australian diabetes care drugs market shows relatively even distribution across its major regions, with no single region exhibiting overwhelming dominance. However, population density and healthcare infrastructure influence regional variations in market size. Segment-wise analysis reveals significant variations in growth trajectories:
- Oral Anti-diabetic drugs: Metformin remains the dominant oral anti-diabetic drug, contributing significantly to market share. The market for newer oral agents, such as DPP-4 inhibitors (e.g., Suglat) and SGLT-2 inhibitors (e.g., Suglat), is growing rapidly due to their superior efficacy and safety profiles.
- Insulins: The insulin segment is a major contributor, dominated by basal or long-acting insulins, with fast-acting insulins (e.g., Apidra) holding a substantial portion. Biosimilar insulins (e.g., Insuman) are gaining traction due to their cost-effectiveness.
- Non-Insulin Injectable drugs: GLP-1 receptor agonists (e.g., Lyxumia) and Amylin Analogues (e.g., Lyxumia) are showing strong growth, driven by their efficacy in weight management and cardiovascular risk reduction.
Key Drivers: Government initiatives like the Pharmaceutical Benefits Scheme (PBS) are crucial in ensuring access to affordable medications. Improved healthcare infrastructure and increasing physician awareness about newer treatment options also contribute significantly.
Diabetes Care Drugs Market in Australia Product Innovations
The Australian diabetes care drugs market is characterized by ongoing innovation, with companies focused on developing new drugs with enhanced efficacy and safety profiles, improved delivery systems (e.g., pre-filled pens, insulin pumps), and combination therapies to improve patient convenience and treatment adherence. Technological advancements are leading to the development of smart insulin delivery systems with connected apps for remote monitoring and improved diabetes management. The market is seeing increasing focus on patient-centric products that address lifestyle needs and preferences.
Report Scope & Segmentation Analysis
This report segments the Australian diabetes care drugs market based on drug class (Oral Anti-diabetic drugs - Biguanides, Sulfonylureas, Meglitinides, Oral Combinations; Insulins - Basal/Long Acting, Bolus/Fast Acting, Biosimilar Insulins; Non-Insulin Injectable drugs - GLP-1 receptor agonists, Alpha-Glucosidase Inhibitors, SGLT-2 inhibitors; Combination drugs). Each segment's market size, growth projections, and competitive landscape are analyzed. The market is further segmented by distribution channel (hospital pharmacies, retail pharmacies, online pharmacies) and by end-user (type 1 diabetes patients, type 2 diabetes patients).
Key Drivers of Diabetes Care Drugs Market in Australia Growth
Several factors are driving the growth of the Australian diabetes care drugs market. The rising prevalence of diabetes, fueled by lifestyle changes and an aging population, is a key driver. Government initiatives like the PBS are expanding access to medications. Furthermore, continuous innovation in drug development, leading to more effective and convenient therapies, is boosting market growth.
Challenges in the Diabetes Care Drugs Market in Australia Sector
The Australian diabetes care drugs market faces challenges, including stringent regulatory requirements for drug approvals, rising healthcare costs, and intense competition from generic drug manufacturers. Price controls imposed by the government can impact the profitability of branded drugs. Supply chain disruptions can affect the availability of medications.
Emerging Opportunities in Diabetes Care Drugs Market in Australia
The market presents significant opportunities for growth. The increasing adoption of innovative therapies like GLP-1 receptor agonists and SGLT-2 inhibitors creates a strong growth opportunity. The development of advanced drug delivery systems, such as smart insulin pens and continuous glucose monitoring (CGM) devices, is generating further market potential. Expanding the reach of diabetes education and management programs will further drive market growth.
Leading Players in the Diabetes Care Drugs Market in Australia Market
- Merck And Co
- Pfizer
- Takeda
- Janssen Pharmaceuticals
- Eli Lilly
- Novartis
- AstraZeneca
- Bristol Myers Squibb
- Novo Nordisk
- Boehringer Ingelheim
- Sanofi
- Astellas
Key Developments in Diabetes Care Drugs Market in Australia Industry
- May 2022: The TGA, in collaboration with Novo Nordisk and key health organizations, prioritized Ozempic prescriptions for type 2 diabetes patients.
- March 2023: The Albanese Government extended access to Fiasp insulin and Fiasp FlexTouch via the PBS for an additional six months.
Future Outlook for Diabetes Care Drugs Market in Australia Market
The future outlook for the Australian diabetes care drugs market is positive, driven by sustained growth in diabetes prevalence, continuous product innovation, and ongoing government support for expanding access to affordable medications. The market is expected to witness further consolidation through mergers and acquisitions, along with increased competition from both established and emerging players. Strategic partnerships and focused R&D efforts will be crucial for companies to maintain market share and capitalize on future growth opportunities.
Diabetes Care Drugs Market in Australia Segmentation
-
1. Product type
- 1.1. Oral anti-diabetic drugs
- 1.2. insulins
- 1.3. non-insulin injectables
- 1.4. combination drugs
-
2. Distribution channel
- 2.1. Hospitals
- 2.2. pharmacies
- 2.3. clinics
-
3. End-user
- 3.1. Type 1 diabetes patients
- 3.2. type 2 diabetes patients
Diabetes Care Drugs Market in Australia Segmentation By Geography
-
1. North America
- 1.1. United States
- 1.2. Canada
- 1.3. Mexico
-
2. South America
- 2.1. Brazil
- 2.2. Argentina
- 2.3. Rest of South America
-
3. Europe
- 3.1. United Kingdom
- 3.2. Germany
- 3.3. France
- 3.4. Italy
- 3.5. Spain
- 3.6. Russia
- 3.7. Benelux
- 3.8. Nordics
- 3.9. Rest of Europe
-
4. Middle East & Africa
- 4.1. Turkey
- 4.2. Israel
- 4.3. GCC
- 4.4. North Africa
- 4.5. South Africa
- 4.6. Rest of Middle East & Africa
-
5. Asia Pacific
- 5.1. China
- 5.2. India
- 5.3. Japan
- 5.4. South Korea
- 5.5. ASEAN
- 5.6. Oceania
- 5.7. Rest of Asia Pacific
Diabetes Care Drugs Market in Australia REPORT HIGHLIGHTS
| Aspects | Details |
|---|---|
| Study Period | 2019-2033 |
| Base Year | 2024 |
| Estimated Year | 2025 |
| Forecast Period | 2025-2033 |
| Historical Period | 2019-2024 |
| Growth Rate | CAGR of 3.60% from 2019-2033 |
| Segmentation |
|
Table of Contents
- 1. Introduction
- 1.1. Research Scope
- 1.2. Market Segmentation
- 1.3. Research Methodology
- 1.4. Definitions and Assumptions
- 2. Executive Summary
- 2.1. Introduction
- 3. Market Dynamics
- 3.1. Introduction
- 3.2. Market Drivers
- 3.2.1. Increasing Geriatric Population and Changing Dietary Habits; High Prevalence of Irritable bowel syndrome with constipation (IBS-C) and Opioid-induced constipation (OIC) and Chronic Constipation; Development of Latest Drugs and Treatment Procedures
- 3.3. Market Restrains
- 3.3.1. Increasing Dependence on Majority of Over-the-Counter (OTC) Drugs; Lack of Awareness and Reluctance Among Patients due to Adverse Effects of Opioid-Induced Constipation (OIC) Drugs
- 3.4. Market Trends
- 3.4.1. Oral-Anti Diabetes Drugs is Having the Highest Market Share in the Current Year.
- 4. Market Factor Analysis
- 4.1. Porters Five Forces
- 4.2. Supply/Value Chain
- 4.3. PESTEL analysis
- 4.4. Market Entropy
- 4.5. Patent/Trademark Analysis
- 5. Diabetes Care Drugs Market in Australia Analysis, Insights and Forecast, 2019-2031
- 5.1. Market Analysis, Insights and Forecast - by Product type
- 5.1.1. Oral anti-diabetic drugs
- 5.1.2. insulins
- 5.1.3. non-insulin injectables
- 5.1.4. combination drugs
- 5.2. Market Analysis, Insights and Forecast - by Distribution channel
- 5.2.1. Hospitals
- 5.2.2. pharmacies
- 5.2.3. clinics
- 5.3. Market Analysis, Insights and Forecast - by End-user
- 5.3.1. Type 1 diabetes patients
- 5.3.2. type 2 diabetes patients
- 5.4. Market Analysis, Insights and Forecast - by Region
- 5.4.1. North America
- 5.4.2. South America
- 5.4.3. Europe
- 5.4.4. Middle East & Africa
- 5.4.5. Asia Pacific
- 5.1. Market Analysis, Insights and Forecast - by Product type
- 6. North America Diabetes Care Drugs Market in Australia Analysis, Insights and Forecast, 2019-2031
- 6.1. Market Analysis, Insights and Forecast - by Product type
- 6.1.1. Oral anti-diabetic drugs
- 6.1.2. insulins
- 6.1.3. non-insulin injectables
- 6.1.4. combination drugs
- 6.2. Market Analysis, Insights and Forecast - by Distribution channel
- 6.2.1. Hospitals
- 6.2.2. pharmacies
- 6.2.3. clinics
- 6.3. Market Analysis, Insights and Forecast - by End-user
- 6.3.1. Type 1 diabetes patients
- 6.3.2. type 2 diabetes patients
- 6.1. Market Analysis, Insights and Forecast - by Product type
- 7. South America Diabetes Care Drugs Market in Australia Analysis, Insights and Forecast, 2019-2031
- 7.1. Market Analysis, Insights and Forecast - by Product type
- 7.1.1. Oral anti-diabetic drugs
- 7.1.2. insulins
- 7.1.3. non-insulin injectables
- 7.1.4. combination drugs
- 7.2. Market Analysis, Insights and Forecast - by Distribution channel
- 7.2.1. Hospitals
- 7.2.2. pharmacies
- 7.2.3. clinics
- 7.3. Market Analysis, Insights and Forecast - by End-user
- 7.3.1. Type 1 diabetes patients
- 7.3.2. type 2 diabetes patients
- 7.1. Market Analysis, Insights and Forecast - by Product type
- 8. Europe Diabetes Care Drugs Market in Australia Analysis, Insights and Forecast, 2019-2031
- 8.1. Market Analysis, Insights and Forecast - by Product type
- 8.1.1. Oral anti-diabetic drugs
- 8.1.2. insulins
- 8.1.3. non-insulin injectables
- 8.1.4. combination drugs
- 8.2. Market Analysis, Insights and Forecast - by Distribution channel
- 8.2.1. Hospitals
- 8.2.2. pharmacies
- 8.2.3. clinics
- 8.3. Market Analysis, Insights and Forecast - by End-user
- 8.3.1. Type 1 diabetes patients
- 8.3.2. type 2 diabetes patients
- 8.1. Market Analysis, Insights and Forecast - by Product type
- 9. Middle East & Africa Diabetes Care Drugs Market in Australia Analysis, Insights and Forecast, 2019-2031
- 9.1. Market Analysis, Insights and Forecast - by Product type
- 9.1.1. Oral anti-diabetic drugs
- 9.1.2. insulins
- 9.1.3. non-insulin injectables
- 9.1.4. combination drugs
- 9.2. Market Analysis, Insights and Forecast - by Distribution channel
- 9.2.1. Hospitals
- 9.2.2. pharmacies
- 9.2.3. clinics
- 9.3. Market Analysis, Insights and Forecast - by End-user
- 9.3.1. Type 1 diabetes patients
- 9.3.2. type 2 diabetes patients
- 9.1. Market Analysis, Insights and Forecast - by Product type
- 10. Asia Pacific Diabetes Care Drugs Market in Australia Analysis, Insights and Forecast, 2019-2031
- 10.1. Market Analysis, Insights and Forecast - by Product type
- 10.1.1. Oral anti-diabetic drugs
- 10.1.2. insulins
- 10.1.3. non-insulin injectables
- 10.1.4. combination drugs
- 10.2. Market Analysis, Insights and Forecast - by Distribution channel
- 10.2.1. Hospitals
- 10.2.2. pharmacies
- 10.2.3. clinics
- 10.3. Market Analysis, Insights and Forecast - by End-user
- 10.3.1. Type 1 diabetes patients
- 10.3.2. type 2 diabetes patients
- 10.1. Market Analysis, Insights and Forecast - by Product type
- 11. Competitive Analysis
- 11.1. Market Share Analysis 2024
- 11.2. Company Profiles
- 11.2.1 Merck And Co
- 11.2.1.1. Overview
- 11.2.1.2. Products
- 11.2.1.3. SWOT Analysis
- 11.2.1.4. Recent Developments
- 11.2.1.5. Financials (Based on Availability)
- 11.2.2 Pfizer
- 11.2.2.1. Overview
- 11.2.2.2. Products
- 11.2.2.3. SWOT Analysis
- 11.2.2.4. Recent Developments
- 11.2.2.5. Financials (Based on Availability)
- 11.2.3 Takeda
- 11.2.3.1. Overview
- 11.2.3.2. Products
- 11.2.3.3. SWOT Analysis
- 11.2.3.4. Recent Developments
- 11.2.3.5. Financials (Based on Availability)
- 11.2.4 Janssen Pharmaceuticals
- 11.2.4.1. Overview
- 11.2.4.2. Products
- 11.2.4.3. SWOT Analysis
- 11.2.4.4. Recent Developments
- 11.2.4.5. Financials (Based on Availability)
- 11.2.5 Eli Lilly
- 11.2.5.1. Overview
- 11.2.5.2. Products
- 11.2.5.3. SWOT Analysis
- 11.2.5.4. Recent Developments
- 11.2.5.5. Financials (Based on Availability)
- 11.2.6 Novartis
- 11.2.6.1. Overview
- 11.2.6.2. Products
- 11.2.6.3. SWOT Analysis
- 11.2.6.4. Recent Developments
- 11.2.6.5. Financials (Based on Availability)
- 11.2.7 AstraZeneca
- 11.2.7.1. Overview
- 11.2.7.2. Products
- 11.2.7.3. SWOT Analysis
- 11.2.7.4. Recent Developments
- 11.2.7.5. Financials (Based on Availability)
- 11.2.8 Bristol Myers Squibb
- 11.2.8.1. Overview
- 11.2.8.2. Products
- 11.2.8.3. SWOT Analysis
- 11.2.8.4. Recent Developments
- 11.2.8.5. Financials (Based on Availability)
- 11.2.9 Novo Nordisk
- 11.2.9.1. Overview
- 11.2.9.2. Products
- 11.2.9.3. SWOT Analysis
- 11.2.9.4. Recent Developments
- 11.2.9.5. Financials (Based on Availability)
- 11.2.10 Boehringer Ingelheim
- 11.2.10.1. Overview
- 11.2.10.2. Products
- 11.2.10.3. SWOT Analysis
- 11.2.10.4. Recent Developments
- 11.2.10.5. Financials (Based on Availability)
- 11.2.11 Sanofi
- 11.2.11.1. Overview
- 11.2.11.2. Products
- 11.2.11.3. SWOT Analysis
- 11.2.11.4. Recent Developments
- 11.2.11.5. Financials (Based on Availability)
- 11.2.12 Astellas
- 11.2.12.1. Overview
- 11.2.12.2. Products
- 11.2.12.3. SWOT Analysis
- 11.2.12.4. Recent Developments
- 11.2.12.5. Financials (Based on Availability)
- 11.2.1 Merck And Co
List of Figures
- Figure 1: Diabetes Care Drugs Market in Australia Revenue Breakdown (Million, %) by Product 2024 & 2032
- Figure 2: Diabetes Care Drugs Market in Australia Share (%) by Company 2024
List of Tables
- Table 1: Diabetes Care Drugs Market in Australia Revenue Million Forecast, by Region 2019 & 2032
- Table 2: Diabetes Care Drugs Market in Australia Volume K Unit Forecast, by Region 2019 & 2032
- Table 3: Diabetes Care Drugs Market in Australia Revenue Million Forecast, by Product type 2019 & 2032
- Table 4: Diabetes Care Drugs Market in Australia Volume K Unit Forecast, by Product type 2019 & 2032
- Table 5: Diabetes Care Drugs Market in Australia Revenue Million Forecast, by Distribution channel 2019 & 2032
- Table 6: Diabetes Care Drugs Market in Australia Volume K Unit Forecast, by Distribution channel 2019 & 2032
- Table 7: Diabetes Care Drugs Market in Australia Revenue Million Forecast, by End-user 2019 & 2032
- Table 8: Diabetes Care Drugs Market in Australia Volume K Unit Forecast, by End-user 2019 & 2032
- Table 9: Diabetes Care Drugs Market in Australia Revenue Million Forecast, by Region 2019 & 2032
- Table 10: Diabetes Care Drugs Market in Australia Volume K Unit Forecast, by Region 2019 & 2032
- Table 11: Diabetes Care Drugs Market in Australia Revenue Million Forecast, by Country 2019 & 2032
- Table 12: Diabetes Care Drugs Market in Australia Volume K Unit Forecast, by Country 2019 & 2032
- Table 13: Diabetes Care Drugs Market in Australia Revenue Million Forecast, by Product type 2019 & 2032
- Table 14: Diabetes Care Drugs Market in Australia Volume K Unit Forecast, by Product type 2019 & 2032
- Table 15: Diabetes Care Drugs Market in Australia Revenue Million Forecast, by Distribution channel 2019 & 2032
- Table 16: Diabetes Care Drugs Market in Australia Volume K Unit Forecast, by Distribution channel 2019 & 2032
- Table 17: Diabetes Care Drugs Market in Australia Revenue Million Forecast, by End-user 2019 & 2032
- Table 18: Diabetes Care Drugs Market in Australia Volume K Unit Forecast, by End-user 2019 & 2032
- Table 19: Diabetes Care Drugs Market in Australia Revenue Million Forecast, by Country 2019 & 2032
- Table 20: Diabetes Care Drugs Market in Australia Volume K Unit Forecast, by Country 2019 & 2032
- Table 21: United States Diabetes Care Drugs Market in Australia Revenue (Million) Forecast, by Application 2019 & 2032
- Table 22: United States Diabetes Care Drugs Market in Australia Volume (K Unit) Forecast, by Application 2019 & 2032
- Table 23: Canada Diabetes Care Drugs Market in Australia Revenue (Million) Forecast, by Application 2019 & 2032
- Table 24: Canada Diabetes Care Drugs Market in Australia Volume (K Unit) Forecast, by Application 2019 & 2032
- Table 25: Mexico Diabetes Care Drugs Market in Australia Revenue (Million) Forecast, by Application 2019 & 2032
- Table 26: Mexico Diabetes Care Drugs Market in Australia Volume (K Unit) Forecast, by Application 2019 & 2032
- Table 27: Diabetes Care Drugs Market in Australia Revenue Million Forecast, by Product type 2019 & 2032
- Table 28: Diabetes Care Drugs Market in Australia Volume K Unit Forecast, by Product type 2019 & 2032
- Table 29: Diabetes Care Drugs Market in Australia Revenue Million Forecast, by Distribution channel 2019 & 2032
- Table 30: Diabetes Care Drugs Market in Australia Volume K Unit Forecast, by Distribution channel 2019 & 2032
- Table 31: Diabetes Care Drugs Market in Australia Revenue Million Forecast, by End-user 2019 & 2032
- Table 32: Diabetes Care Drugs Market in Australia Volume K Unit Forecast, by End-user 2019 & 2032
- Table 33: Diabetes Care Drugs Market in Australia Revenue Million Forecast, by Country 2019 & 2032
- Table 34: Diabetes Care Drugs Market in Australia Volume K Unit Forecast, by Country 2019 & 2032
- Table 35: Brazil Diabetes Care Drugs Market in Australia Revenue (Million) Forecast, by Application 2019 & 2032
- Table 36: Brazil Diabetes Care Drugs Market in Australia Volume (K Unit) Forecast, by Application 2019 & 2032
- Table 37: Argentina Diabetes Care Drugs Market in Australia Revenue (Million) Forecast, by Application 2019 & 2032
- Table 38: Argentina Diabetes Care Drugs Market in Australia Volume (K Unit) Forecast, by Application 2019 & 2032
- Table 39: Rest of South America Diabetes Care Drugs Market in Australia Revenue (Million) Forecast, by Application 2019 & 2032
- Table 40: Rest of South America Diabetes Care Drugs Market in Australia Volume (K Unit) Forecast, by Application 2019 & 2032
- Table 41: Diabetes Care Drugs Market in Australia Revenue Million Forecast, by Product type 2019 & 2032
- Table 42: Diabetes Care Drugs Market in Australia Volume K Unit Forecast, by Product type 2019 & 2032
- Table 43: Diabetes Care Drugs Market in Australia Revenue Million Forecast, by Distribution channel 2019 & 2032
- Table 44: Diabetes Care Drugs Market in Australia Volume K Unit Forecast, by Distribution channel 2019 & 2032
- Table 45: Diabetes Care Drugs Market in Australia Revenue Million Forecast, by End-user 2019 & 2032
- Table 46: Diabetes Care Drugs Market in Australia Volume K Unit Forecast, by End-user 2019 & 2032
- Table 47: Diabetes Care Drugs Market in Australia Revenue Million Forecast, by Country 2019 & 2032
- Table 48: Diabetes Care Drugs Market in Australia Volume K Unit Forecast, by Country 2019 & 2032
- Table 49: United Kingdom Diabetes Care Drugs Market in Australia Revenue (Million) Forecast, by Application 2019 & 2032
- Table 50: United Kingdom Diabetes Care Drugs Market in Australia Volume (K Unit) Forecast, by Application 2019 & 2032
- Table 51: Germany Diabetes Care Drugs Market in Australia Revenue (Million) Forecast, by Application 2019 & 2032
- Table 52: Germany Diabetes Care Drugs Market in Australia Volume (K Unit) Forecast, by Application 2019 & 2032
- Table 53: France Diabetes Care Drugs Market in Australia Revenue (Million) Forecast, by Application 2019 & 2032
- Table 54: France Diabetes Care Drugs Market in Australia Volume (K Unit) Forecast, by Application 2019 & 2032
- Table 55: Italy Diabetes Care Drugs Market in Australia Revenue (Million) Forecast, by Application 2019 & 2032
- Table 56: Italy Diabetes Care Drugs Market in Australia Volume (K Unit) Forecast, by Application 2019 & 2032
- Table 57: Spain Diabetes Care Drugs Market in Australia Revenue (Million) Forecast, by Application 2019 & 2032
- Table 58: Spain Diabetes Care Drugs Market in Australia Volume (K Unit) Forecast, by Application 2019 & 2032
- Table 59: Russia Diabetes Care Drugs Market in Australia Revenue (Million) Forecast, by Application 2019 & 2032
- Table 60: Russia Diabetes Care Drugs Market in Australia Volume (K Unit) Forecast, by Application 2019 & 2032
- Table 61: Benelux Diabetes Care Drugs Market in Australia Revenue (Million) Forecast, by Application 2019 & 2032
- Table 62: Benelux Diabetes Care Drugs Market in Australia Volume (K Unit) Forecast, by Application 2019 & 2032
- Table 63: Nordics Diabetes Care Drugs Market in Australia Revenue (Million) Forecast, by Application 2019 & 2032
- Table 64: Nordics Diabetes Care Drugs Market in Australia Volume (K Unit) Forecast, by Application 2019 & 2032
- Table 65: Rest of Europe Diabetes Care Drugs Market in Australia Revenue (Million) Forecast, by Application 2019 & 2032
- Table 66: Rest of Europe Diabetes Care Drugs Market in Australia Volume (K Unit) Forecast, by Application 2019 & 2032
- Table 67: Diabetes Care Drugs Market in Australia Revenue Million Forecast, by Product type 2019 & 2032
- Table 68: Diabetes Care Drugs Market in Australia Volume K Unit Forecast, by Product type 2019 & 2032
- Table 69: Diabetes Care Drugs Market in Australia Revenue Million Forecast, by Distribution channel 2019 & 2032
- Table 70: Diabetes Care Drugs Market in Australia Volume K Unit Forecast, by Distribution channel 2019 & 2032
- Table 71: Diabetes Care Drugs Market in Australia Revenue Million Forecast, by End-user 2019 & 2032
- Table 72: Diabetes Care Drugs Market in Australia Volume K Unit Forecast, by End-user 2019 & 2032
- Table 73: Diabetes Care Drugs Market in Australia Revenue Million Forecast, by Country 2019 & 2032
- Table 74: Diabetes Care Drugs Market in Australia Volume K Unit Forecast, by Country 2019 & 2032
- Table 75: Turkey Diabetes Care Drugs Market in Australia Revenue (Million) Forecast, by Application 2019 & 2032
- Table 76: Turkey Diabetes Care Drugs Market in Australia Volume (K Unit) Forecast, by Application 2019 & 2032
- Table 77: Israel Diabetes Care Drugs Market in Australia Revenue (Million) Forecast, by Application 2019 & 2032
- Table 78: Israel Diabetes Care Drugs Market in Australia Volume (K Unit) Forecast, by Application 2019 & 2032
- Table 79: GCC Diabetes Care Drugs Market in Australia Revenue (Million) Forecast, by Application 2019 & 2032
- Table 80: GCC Diabetes Care Drugs Market in Australia Volume (K Unit) Forecast, by Application 2019 & 2032
- Table 81: North Africa Diabetes Care Drugs Market in Australia Revenue (Million) Forecast, by Application 2019 & 2032
- Table 82: North Africa Diabetes Care Drugs Market in Australia Volume (K Unit) Forecast, by Application 2019 & 2032
- Table 83: South Africa Diabetes Care Drugs Market in Australia Revenue (Million) Forecast, by Application 2019 & 2032
- Table 84: South Africa Diabetes Care Drugs Market in Australia Volume (K Unit) Forecast, by Application 2019 & 2032
- Table 85: Rest of Middle East & Africa Diabetes Care Drugs Market in Australia Revenue (Million) Forecast, by Application 2019 & 2032
- Table 86: Rest of Middle East & Africa Diabetes Care Drugs Market in Australia Volume (K Unit) Forecast, by Application 2019 & 2032
- Table 87: Diabetes Care Drugs Market in Australia Revenue Million Forecast, by Product type 2019 & 2032
- Table 88: Diabetes Care Drugs Market in Australia Volume K Unit Forecast, by Product type 2019 & 2032
- Table 89: Diabetes Care Drugs Market in Australia Revenue Million Forecast, by Distribution channel 2019 & 2032
- Table 90: Diabetes Care Drugs Market in Australia Volume K Unit Forecast, by Distribution channel 2019 & 2032
- Table 91: Diabetes Care Drugs Market in Australia Revenue Million Forecast, by End-user 2019 & 2032
- Table 92: Diabetes Care Drugs Market in Australia Volume K Unit Forecast, by End-user 2019 & 2032
- Table 93: Diabetes Care Drugs Market in Australia Revenue Million Forecast, by Country 2019 & 2032
- Table 94: Diabetes Care Drugs Market in Australia Volume K Unit Forecast, by Country 2019 & 2032
- Table 95: China Diabetes Care Drugs Market in Australia Revenue (Million) Forecast, by Application 2019 & 2032
- Table 96: China Diabetes Care Drugs Market in Australia Volume (K Unit) Forecast, by Application 2019 & 2032
- Table 97: India Diabetes Care Drugs Market in Australia Revenue (Million) Forecast, by Application 2019 & 2032
- Table 98: India Diabetes Care Drugs Market in Australia Volume (K Unit) Forecast, by Application 2019 & 2032
- Table 99: Japan Diabetes Care Drugs Market in Australia Revenue (Million) Forecast, by Application 2019 & 2032
- Table 100: Japan Diabetes Care Drugs Market in Australia Volume (K Unit) Forecast, by Application 2019 & 2032
- Table 101: South Korea Diabetes Care Drugs Market in Australia Revenue (Million) Forecast, by Application 2019 & 2032
- Table 102: South Korea Diabetes Care Drugs Market in Australia Volume (K Unit) Forecast, by Application 2019 & 2032
- Table 103: ASEAN Diabetes Care Drugs Market in Australia Revenue (Million) Forecast, by Application 2019 & 2032
- Table 104: ASEAN Diabetes Care Drugs Market in Australia Volume (K Unit) Forecast, by Application 2019 & 2032
- Table 105: Oceania Diabetes Care Drugs Market in Australia Revenue (Million) Forecast, by Application 2019 & 2032
- Table 106: Oceania Diabetes Care Drugs Market in Australia Volume (K Unit) Forecast, by Application 2019 & 2032
- Table 107: Rest of Asia Pacific Diabetes Care Drugs Market in Australia Revenue (Million) Forecast, by Application 2019 & 2032
- Table 108: Rest of Asia Pacific Diabetes Care Drugs Market in Australia Volume (K Unit) Forecast, by Application 2019 & 2032
Frequently Asked Questions
1. What is the projected Compound Annual Growth Rate (CAGR) of the Diabetes Care Drugs Market in Australia?
The projected CAGR is approximately 3.60%.
2. Which companies are prominent players in the Diabetes Care Drugs Market in Australia?
Key companies in the market include Merck And Co, Pfizer, Takeda, Janssen Pharmaceuticals, Eli Lilly, Novartis, AstraZeneca, Bristol Myers Squibb, Novo Nordisk, Boehringer Ingelheim, Sanofi, Astellas.
3. What are the main segments of the Diabetes Care Drugs Market in Australia?
The market segments include Product type, Distribution channel, End-user.
4. Can you provide details about the market size?
The market size is estimated to be USD 815.19 Million as of 2022.
5. What are some drivers contributing to market growth?
Increasing Geriatric Population and Changing Dietary Habits; High Prevalence of Irritable bowel syndrome with constipation (IBS-C) and Opioid-induced constipation (OIC) and Chronic Constipation; Development of Latest Drugs and Treatment Procedures.
6. What are the notable trends driving market growth?
Oral-Anti Diabetes Drugs is Having the Highest Market Share in the Current Year..
7. Are there any restraints impacting market growth?
Increasing Dependence on Majority of Over-the-Counter (OTC) Drugs; Lack of Awareness and Reluctance Among Patients due to Adverse Effects of Opioid-Induced Constipation (OIC) Drugs.
8. Can you provide examples of recent developments in the market?
March 2023: Albanese Government decided to extend access to Fiasp insulin and Fiasp FlexTouch via the Pharmaceutical Benefits Scheme for an additional six months. Under the arrangements, people with a current prescription for Fiasp can access it for the next six months.
9. What pricing options are available for accessing the report?
Pricing options include single-user, multi-user, and enterprise licenses priced at USD 3800, USD 4500, and USD 5800 respectively.
10. Is the market size provided in terms of value or volume?
The market size is provided in terms of value, measured in Million and volume, measured in K Unit.
11. Are there any specific market keywords associated with the report?
Yes, the market keyword associated with the report is "Diabetes Care Drugs Market in Australia," which aids in identifying and referencing the specific market segment covered.
12. How do I determine which pricing option suits my needs best?
The pricing options vary based on user requirements and access needs. Individual users may opt for single-user licenses, while businesses requiring broader access may choose multi-user or enterprise licenses for cost-effective access to the report.
13. Are there any additional resources or data provided in the Diabetes Care Drugs Market in Australia report?
While the report offers comprehensive insights, it's advisable to review the specific contents or supplementary materials provided to ascertain if additional resources or data are available.
14. How can I stay updated on further developments or reports in the Diabetes Care Drugs Market in Australia?
To stay informed about further developments, trends, and reports in the Diabetes Care Drugs Market in Australia, consider subscribing to industry newsletters, following relevant companies and organizations, or regularly checking reputable industry news sources and publications.
Methodology
Step 1 - Identification of Relevant Samples Size from Population Database


Step 2 - Approaches for Defining Global Market Size (Value, Volume* & Price*)

Note*: In applicable scenarios
Step 3 - Data Sources
Primary Research
- Web Analytics
- Survey Reports
- Research Institute
- Latest Research Reports
- Opinion Leaders
Secondary Research
- Annual Reports
- White Paper
- Latest Press Release
- Industry Association
- Paid Database
- Investor Presentations

Step 4 - Data Triangulation
Involves using different sources of information in order to increase the validity of a study
These sources are likely to be stakeholders in a program - participants, other researchers, program staff, other community members, and so on.
Then we put all data in single framework & apply various statistical tools to find out the dynamic on the market.
During the analysis stage, feedback from the stakeholder groups would be compared to determine areas of agreement as well as areas of divergence


