

Key Insights
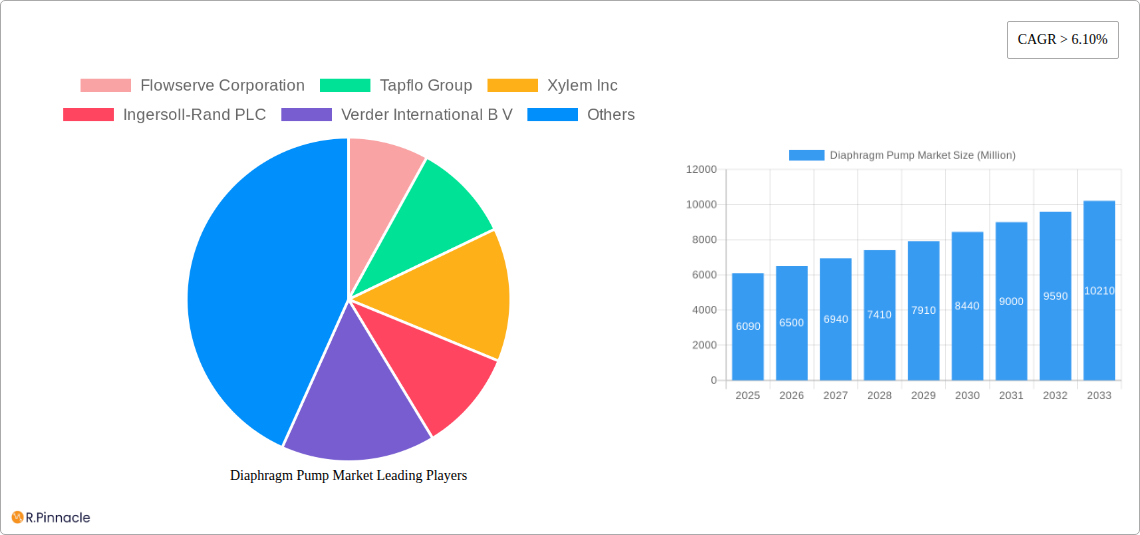
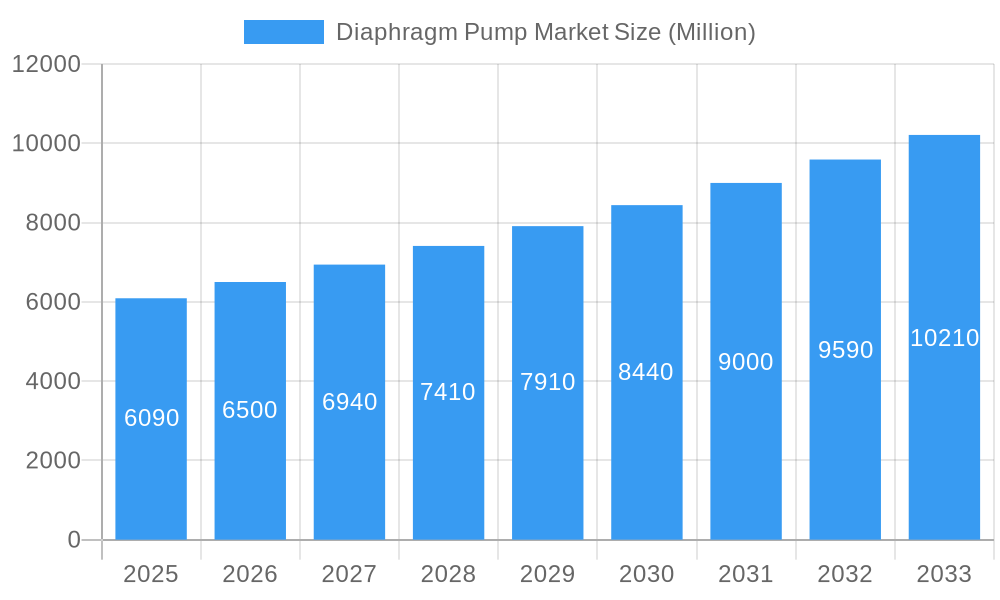
The global diaphragm pump market, valued at $6.09 billion in 2025, is projected to experience robust growth, exhibiting a Compound Annual Growth Rate (CAGR) exceeding 6.10% from 2025 to 2033. This expansion is driven by several key factors. Increasing demand across diverse end-user industries, such as water and wastewater treatment, oil and gas extraction, and the chemical and petrochemical sectors, fuels market growth. The inherent advantages of diaphragm pumps – their ability to handle abrasive, viscous, and corrosive fluids without significant wear and tear – make them a preferred choice in these demanding applications. Furthermore, advancements in pump technology, including the development of more energy-efficient electric models and higher-pressure capabilities, are contributing to market expansion. The rising adoption of automated systems and the increasing focus on process optimization across various industries further bolster demand. Geographical expansion, particularly in rapidly developing economies in Asia-Pacific and the Middle East and Africa, presents significant growth opportunities.
Diaphragm Pump Market Market Size (In Billion)
However, certain restraining factors influence market growth. Fluctuations in raw material prices, especially for specialized materials used in high-pressure pump construction, can impact profitability and hinder growth. Moreover, the relatively higher initial investment cost compared to other pump types may limit adoption in some segments. Competitive pressures from established and emerging players necessitate continuous innovation and strategic market positioning to maintain a competitive edge. Nevertheless, the long-term outlook for the diaphragm pump market remains positive, driven by consistent growth across key sectors and ongoing technological advancements. The market segmentation, encompassing various operating mechanisms (air-operated, electrically operated), discharge pressure ranges, and diverse end-user applications, provides valuable insights into specific growth pockets and helps companies target their efforts effectively.
Diaphragm Pump Market Company Market Share
Diaphragm Pump Market Report: 2019-2033 Forecast
This comprehensive report provides a detailed analysis of the global Diaphragm Pump market, offering valuable insights for industry professionals, investors, and strategic decision-makers. Covering the period from 2019 to 2033, with a focus on 2025, this report unveils market dynamics, growth drivers, competitive landscapes, and future trends. The market is expected to reach xx Million by 2033, showcasing significant growth potential.
Diaphragm Pump Market Market Structure & Innovation Trends
This section analyzes the competitive landscape of the diaphragm pump market, examining market concentration, innovation drivers, regulatory frameworks, product substitutes, end-user demographics, and M&A activities. The market exhibits a moderately consolidated structure, with key players holding significant market share. However, the presence of numerous smaller players indicates a dynamic competitive environment.
- Market Concentration: The top five players account for approximately xx% of the global market share in 2025, indicating moderate concentration.
- Innovation Drivers: Technological advancements in pump materials, automation, and energy efficiency are major drivers of innovation. Increased demand for high-performance pumps in various industries further fuels innovation.
- Regulatory Frameworks: Stringent environmental regulations related to emissions and waste disposal influence pump design and manufacturing practices. Compliance requirements vary across different regions, shaping market dynamics.
- Product Substitutes: Alternative pumping technologies, such as centrifugal pumps and peristaltic pumps, pose a competitive threat to diaphragm pumps in certain applications. However, the unique advantages of diaphragm pumps in handling abrasive or viscous fluids maintain their market position.
- End-User Demographics: The market is segmented across diverse end-user industries, including water & wastewater, oil & gas, chemical & petrochemical, pharmaceutical, and food & beverage sectors. Each segment presents unique application requirements.
- M&A Activities: The market has witnessed a moderate level of M&A activity in recent years, with deal values ranging from xx Million to xx Million. These activities primarily aim at expanding product portfolios, entering new markets, and enhancing technological capabilities.
Diaphragm Pump Market Market Dynamics & Trends
This section explores the key factors driving the growth of the diaphragm pump market. These include increasing industrialization, rising demand from various end-user sectors, technological advancements, and supportive government policies. The market exhibits a healthy CAGR of xx% during the forecast period (2025-2033). Market penetration is highest in the developed regions but is expected to expand rapidly in emerging economies. Technological disruptions, such as the adoption of smart pumps and automation systems, are transforming market dynamics. Consumer preference for energy-efficient, reliable, and low-maintenance pumps is also shaping market trends. Intense competition among existing and new players is further stimulating innovation and price optimization.
Dominant Regions & Segments in Diaphragm Pump Market
The North American region currently holds the largest market share, driven by robust industrial activity and a high concentration of key players. However, the Asia-Pacific region is expected to experience the highest growth rate during the forecast period, fueled by rapid industrialization and infrastructural development.
- Leading Segment (Mechanism): Air-operated diaphragm pumps dominate the market due to their simplicity, cost-effectiveness, and suitability for a wide range of applications.
- Leading Segment (Discharge Pressure): The "Up to 80 bar" segment holds the largest market share, reflecting the prevalent demand for low-to-medium pressure applications across various industries.
- Leading Segment (End-User): The water and wastewater treatment industry is the largest end-user segment for diaphragm pumps due to the significant demand for reliable and efficient pumping solutions in wastewater management.
Key Drivers:
- North America: Strong industrial base, presence of major manufacturers, robust regulatory frameworks driving adoption of advanced pump technologies.
- Asia-Pacific: Rapid industrialization, infrastructure development, rising demand from various sectors, particularly chemical and petrochemical.
- Europe: Established industrial sector, focus on energy efficiency and sustainability driving demand for advanced pump technologies.
Diaphragm Pump Market Product Innovations
Recent product innovations focus on enhanced energy efficiency, improved material durability, and increased automation capabilities. The integration of smart sensors and control systems enables real-time monitoring and optimized performance. New materials are designed to withstand harsh operating conditions and extend pump lifespan. These advancements improve operational efficiency and reduce maintenance costs, making diaphragm pumps more attractive to end-users.
Report Scope & Segmentation Analysis
The report comprehensively segments the diaphragm pump market based on mechanism (air-operated, electrically operated), discharge pressure (up to 80 bar, 80-200 bar, above 200 bar), and end-user (water and wastewater, oil and gas, chemical and petrochemical, pharmaceutical, food and beverage, other end-users). Each segment's growth projections, market sizes, and competitive dynamics are analyzed in detail. For instance, the electrically operated segment is expected to witness significant growth due to increasing demand for energy-efficient solutions. Similarly, the chemical and petrochemical segment is expected to remain a major growth driver due to its high volume usage.
Key Drivers of Diaphragm Pump Market Growth
The key drivers include the increasing demand from various industrial sectors, particularly in water and wastewater treatment, oil and gas, and chemical processing. Stringent environmental regulations, coupled with the need for energy efficiency, are pushing the adoption of advanced diaphragm pump technologies. Government investments in infrastructure development and industrial automation further contribute to market growth.
Challenges in the Diaphragm Pump Market Sector
The key challenges include fluctuating raw material prices, intense competition from alternative pumping technologies, and stringent regulatory compliance requirements. Supply chain disruptions and economic downturns can impact market growth. These factors need to be addressed to ensure sustained market expansion.
Emerging Opportunities in Diaphragm Pump Market
Emerging opportunities lie in the growing demand for energy-efficient pumps, the adoption of smart technologies, and expansion into new and developing markets. Growth in the pharmaceutical and food and beverage industries presents significant opportunities.
Leading Players in the Diaphragm Pump Market Market
- Flowserve Corporation
- Tapflo Group
- Xylem Inc
- Ingersoll-Rand PLC
- Verder International B.V.
- Graco Inc
- LEWA Group
- Idex Corporation
- Dover Corporation
- SPX FLOW Inc
- Yamada Corporation
- Grundfos AS
Key Developments in Diaphragm Pump Market Industry
- August 2021: Graco Inc. launched the Husky 3300e electric double diaphragm pump, offering high-volume fluid transfer and reduced power consumption.
- April 2020: Quattroflow (part of PSG and Dover Corporation) introduced the QF2500 Quaternary Diaphragm Pump, expanding its line of pumps for biopharma applications.
Future Outlook for Diaphragm Pump Market Market
The diaphragm pump market is poised for sustained growth, driven by technological advancements, increasing industrialization, and rising demand across various sectors. Strategic partnerships, product diversification, and expansion into emerging markets will be key strategies for success in this dynamic market. The focus on sustainability and energy efficiency will further shape the future of the diaphragm pump industry.
Diaphragm Pump Market Segmentation
-
1. Mechanism
- 1.1. Air Operated
- 1.2. Electrically Operated
-
2. Discharge Pressure
- 2.1. Up to 80 bar
- 2.2. Between 80 to 200 bar
- 2.3. Above 200 bar
-
3. End-User
- 3.1. Water and Wastewater
- 3.2. Oil and Gas
- 3.3. Chemical and Petrochemical
- 3.4. Pharmaceutical
- 3.5. Food and Beverage
- 3.6. Other End-Users
Diaphragm Pump Market Segmentation By Geography
- 1. North America
- 2. Europe
- 3. Asia Pacific
- 4. South America
- 5. Middle East and Africa
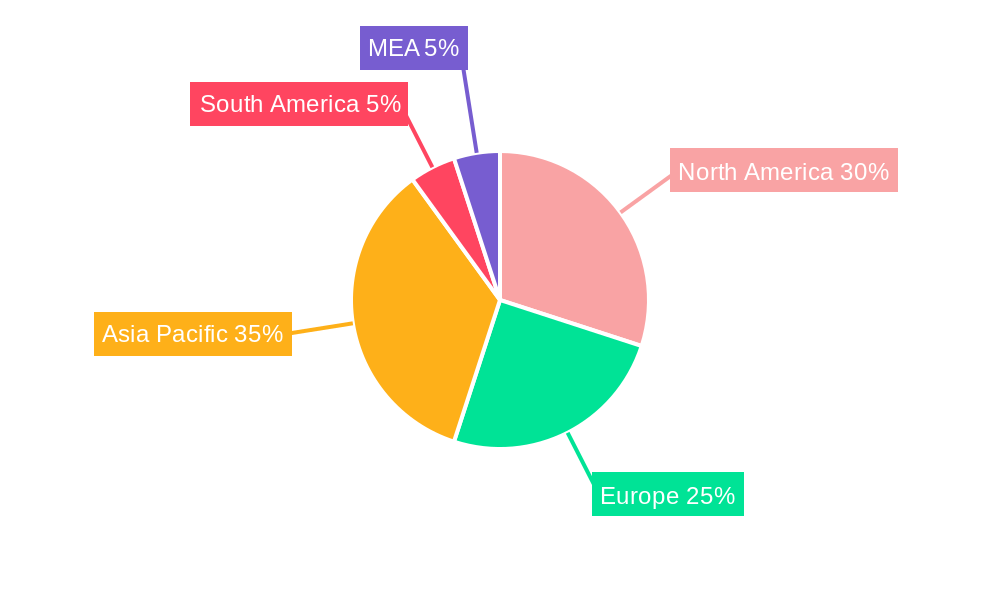
Diaphragm Pump Market Regional Market Share
Geographic Coverage of Diaphragm Pump Market
Diaphragm Pump Market REPORT HIGHLIGHTS
| Aspects | Details |
|---|---|
| Study Period | 2020-2034 |
| Base Year | 2025 |
| Estimated Year | 2026 |
| Forecast Period | 2026-2034 |
| Historical Period | 2020-2025 |
| Growth Rate | CAGR of > 6.10% from 2020-2034 |
| Segmentation |
|
Table of Contents
- 1. Introduction
- 1.1. Research Scope
- 1.2. Market Segmentation
- 1.3. Research Objective
- 1.4. Definitions and Assumptions
- 2. Executive Summary
- 2.1. Market Snapshot
- 3. Market Dynamics
- 3.1. Market Drivers
- 3.2. Market Restrains
- 3.3. Market Trends
- 3.4. Market Opportunities
- 4. Market Factor Analysis
- 4.1. Porters Five Forces
- 4.1.1. Bargaining Power of Suppliers
- 4.1.2. Bargaining Power of Buyers
- 4.1.3. Threat of New Entrants
- 4.1.4. Threat of Substitutes
- 4.1.5. Competitive Rivalry
- 4.2. PESTEL analysis
- 4.3. BCG Analysis
- 4.3.1. Stars (High Growth, High Market Share)
- 4.3.2. Cash Cows (Low Growth, High Market Share)
- 4.3.3. Question Mark (High Growth, Low Market Share)
- 4.3.4. Dogs (Low Growth, Low Market Share)
- 4.4. Ansoff Matrix Analysis
- 4.5. Supply Chain Analysis
- 4.6. Regulatory Landscape
- 4.7. Current Market Potential and Opportunity Assessment (TAM–SAM–SOM Framework)
- 4.8. PRI Analyst Note
- 4.1. Porters Five Forces
- 5. Market Analysis, Insights and Forecast 2021-2033
- 5.1. Market Analysis, Insights and Forecast - by Mechanism
- 5.1.1. Air Operated
- 5.1.2. Electrically Operated
- 5.2. Market Analysis, Insights and Forecast - by Discharge Pressure
- 5.2.1. Up to 80 bar
- 5.2.2. Between 80 to 200 bar
- 5.2.3. Above 200 bar
- 5.3. Market Analysis, Insights and Forecast - by End-User
- 5.3.1. Water and Wastewater
- 5.3.2. Oil and Gas
- 5.3.3. Chemical and Petrochemical
- 5.3.4. Pharmaceutical
- 5.3.5. Food and Beverage
- 5.3.6. Other End-Users
- 5.4. Market Analysis, Insights and Forecast - by Region
- 5.4.1. North America
- 5.4.2. Europe
- 5.4.3. Asia Pacific
- 5.4.4. South America
- 5.4.5. Middle East and Africa
- 5.1. Market Analysis, Insights and Forecast - by Mechanism
- 6. Global Diaphragm Pump Market Analysis, Insights and Forecast, 2021-2033
- 6.1. Market Analysis, Insights and Forecast - by Mechanism
- 6.1.1. Air Operated
- 6.1.2. Electrically Operated
- 6.2. Market Analysis, Insights and Forecast - by Discharge Pressure
- 6.2.1. Up to 80 bar
- 6.2.2. Between 80 to 200 bar
- 6.2.3. Above 200 bar
- 6.3. Market Analysis, Insights and Forecast - by End-User
- 6.3.1. Water and Wastewater
- 6.3.2. Oil and Gas
- 6.3.3. Chemical and Petrochemical
- 6.3.4. Pharmaceutical
- 6.3.5. Food and Beverage
- 6.3.6. Other End-Users
- 6.1. Market Analysis, Insights and Forecast - by Mechanism
- 7. North America Diaphragm Pump Market Analysis, Insights and Forecast, 2020-2032
- 7.1. Market Analysis, Insights and Forecast - by Mechanism
- 7.1.1. Air Operated
- 7.1.2. Electrically Operated
- 7.2. Market Analysis, Insights and Forecast - by Discharge Pressure
- 7.2.1. Up to 80 bar
- 7.2.2. Between 80 to 200 bar
- 7.2.3. Above 200 bar
- 7.3. Market Analysis, Insights and Forecast - by End-User
- 7.3.1. Water and Wastewater
- 7.3.2. Oil and Gas
- 7.3.3. Chemical and Petrochemical
- 7.3.4. Pharmaceutical
- 7.3.5. Food and Beverage
- 7.3.6. Other End-Users
- 7.1. Market Analysis, Insights and Forecast - by Mechanism
- 8. Europe Diaphragm Pump Market Analysis, Insights and Forecast, 2020-2032
- 8.1. Market Analysis, Insights and Forecast - by Mechanism
- 8.1.1. Air Operated
- 8.1.2. Electrically Operated
- 8.2. Market Analysis, Insights and Forecast - by Discharge Pressure
- 8.2.1. Up to 80 bar
- 8.2.2. Between 80 to 200 bar
- 8.2.3. Above 200 bar
- 8.3. Market Analysis, Insights and Forecast - by End-User
- 8.3.1. Water and Wastewater
- 8.3.2. Oil and Gas
- 8.3.3. Chemical and Petrochemical
- 8.3.4. Pharmaceutical
- 8.3.5. Food and Beverage
- 8.3.6. Other End-Users
- 8.1. Market Analysis, Insights and Forecast - by Mechanism
- 9. Asia Pacific Diaphragm Pump Market Analysis, Insights and Forecast, 2020-2032
- 9.1. Market Analysis, Insights and Forecast - by Mechanism
- 9.1.1. Air Operated
- 9.1.2. Electrically Operated
- 9.2. Market Analysis, Insights and Forecast - by Discharge Pressure
- 9.2.1. Up to 80 bar
- 9.2.2. Between 80 to 200 bar
- 9.2.3. Above 200 bar
- 9.3. Market Analysis, Insights and Forecast - by End-User
- 9.3.1. Water and Wastewater
- 9.3.2. Oil and Gas
- 9.3.3. Chemical and Petrochemical
- 9.3.4. Pharmaceutical
- 9.3.5. Food and Beverage
- 9.3.6. Other End-Users
- 9.1. Market Analysis, Insights and Forecast - by Mechanism
- 10. South America Diaphragm Pump Market Analysis, Insights and Forecast, 2020-2032
- 10.1. Market Analysis, Insights and Forecast - by Mechanism
- 10.1.1. Air Operated
- 10.1.2. Electrically Operated
- 10.2. Market Analysis, Insights and Forecast - by Discharge Pressure
- 10.2.1. Up to 80 bar
- 10.2.2. Between 80 to 200 bar
- 10.2.3. Above 200 bar
- 10.3. Market Analysis, Insights and Forecast - by End-User
- 10.3.1. Water and Wastewater
- 10.3.2. Oil and Gas
- 10.3.3. Chemical and Petrochemical
- 10.3.4. Pharmaceutical
- 10.3.5. Food and Beverage
- 10.3.6. Other End-Users
- 10.1. Market Analysis, Insights and Forecast - by Mechanism
- 11. Middle East and Africa Diaphragm Pump Market Analysis, Insights and Forecast, 2020-2032
- 11.1. Market Analysis, Insights and Forecast - by Mechanism
- 11.1.1. Air Operated
- 11.1.2. Electrically Operated
- 11.2. Market Analysis, Insights and Forecast - by Discharge Pressure
- 11.2.1. Up to 80 bar
- 11.2.2. Between 80 to 200 bar
- 11.2.3. Above 200 bar
- 11.3. Market Analysis, Insights and Forecast - by End-User
- 11.3.1. Water and Wastewater
- 11.3.2. Oil and Gas
- 11.3.3. Chemical and Petrochemical
- 11.3.4. Pharmaceutical
- 11.3.5. Food and Beverage
- 11.3.6. Other End-Users
- 11.1. Market Analysis, Insights and Forecast - by Mechanism
- 12. Competitive Analysis
- 12.1. Company Profiles
- 12.1.1 Flowserve Corporation
- 12.1.1.1. Company Overview
- 12.1.1.2. Products
- 12.1.1.3. Company Financials
- 12.1.1.4. SWOT Analysis
- 12.1.2 Tapflo Group
- 12.1.2.1. Company Overview
- 12.1.2.2. Products
- 12.1.2.3. Company Financials
- 12.1.2.4. SWOT Analysis
- 12.1.3 Xylem Inc
- 12.1.3.1. Company Overview
- 12.1.3.2. Products
- 12.1.3.3. Company Financials
- 12.1.3.4. SWOT Analysis
- 12.1.4 Ingersoll-Rand PLC
- 12.1.4.1. Company Overview
- 12.1.4.2. Products
- 12.1.4.3. Company Financials
- 12.1.4.4. SWOT Analysis
- 12.1.5 Verder International B V
- 12.1.5.1. Company Overview
- 12.1.5.2. Products
- 12.1.5.3. Company Financials
- 12.1.5.4. SWOT Analysis
- 12.1.6 Graco Inc
- 12.1.6.1. Company Overview
- 12.1.6.2. Products
- 12.1.6.3. Company Financials
- 12.1.6.4. SWOT Analysis
- 12.1.7 LEWA Group*List Not Exhaustive
- 12.1.7.1. Company Overview
- 12.1.7.2. Products
- 12.1.7.3. Company Financials
- 12.1.7.4. SWOT Analysis
- 12.1.8 Idex Corporation
- 12.1.8.1. Company Overview
- 12.1.8.2. Products
- 12.1.8.3. Company Financials
- 12.1.8.4. SWOT Analysis
- 12.1.9 Dover Corporation
- 12.1.9.1. Company Overview
- 12.1.9.2. Products
- 12.1.9.3. Company Financials
- 12.1.9.4. SWOT Analysis
- 12.1.10 SPX FLOW Inc
- 12.1.10.1. Company Overview
- 12.1.10.2. Products
- 12.1.10.3. Company Financials
- 12.1.10.4. SWOT Analysis
- 12.1.11 Yamada Corporation
- 12.1.11.1. Company Overview
- 12.1.11.2. Products
- 12.1.11.3. Company Financials
- 12.1.11.4. SWOT Analysis
- 12.1.12 Grundfos AS
- 12.1.12.1. Company Overview
- 12.1.12.2. Products
- 12.1.12.3. Company Financials
- 12.1.12.4. SWOT Analysis
- 12.1.1 Flowserve Corporation
- 12.2. Market Entropy
- 12.2.1 Company's Key Areas Served
- 12.2.2 Recent Developments
- 12.3. Company Market Share Analysis 2025
- 12.3.1 Top 5 Companies Market Share Analysis
- 12.3.2 Top 3 Companies Market Share Analysis
- 12.4. List of Potential Customers
- 13. Research Methodology
List of Figures
- Figure 1: Global Diaphragm Pump Market Revenue Breakdown (Million, %) by Region 2025 & 2033
- Figure 2: Global Diaphragm Pump Market Volume Breakdown (K Tons, %) by Region 2025 & 2033
- Figure 3: North America Diaphragm Pump Market Revenue (Million), by Mechanism 2025 & 2033
- Figure 4: North America Diaphragm Pump Market Volume (K Tons), by Mechanism 2025 & 2033
- Figure 5: North America Diaphragm Pump Market Revenue Share (%), by Mechanism 2025 & 2033
- Figure 6: North America Diaphragm Pump Market Volume Share (%), by Mechanism 2025 & 2033
- Figure 7: North America Diaphragm Pump Market Revenue (Million), by Discharge Pressure 2025 & 2033
- Figure 8: North America Diaphragm Pump Market Volume (K Tons), by Discharge Pressure 2025 & 2033
- Figure 9: North America Diaphragm Pump Market Revenue Share (%), by Discharge Pressure 2025 & 2033
- Figure 10: North America Diaphragm Pump Market Volume Share (%), by Discharge Pressure 2025 & 2033
- Figure 11: North America Diaphragm Pump Market Revenue (Million), by End-User 2025 & 2033
- Figure 12: North America Diaphragm Pump Market Volume (K Tons), by End-User 2025 & 2033
- Figure 13: North America Diaphragm Pump Market Revenue Share (%), by End-User 2025 & 2033
- Figure 14: North America Diaphragm Pump Market Volume Share (%), by End-User 2025 & 2033
- Figure 15: North America Diaphragm Pump Market Revenue (Million), by Country 2025 & 2033
- Figure 16: North America Diaphragm Pump Market Volume (K Tons), by Country 2025 & 2033
- Figure 17: North America Diaphragm Pump Market Revenue Share (%), by Country 2025 & 2033
- Figure 18: North America Diaphragm Pump Market Volume Share (%), by Country 2025 & 2033
- Figure 19: Europe Diaphragm Pump Market Revenue (Million), by Mechanism 2025 & 2033
- Figure 20: Europe Diaphragm Pump Market Volume (K Tons), by Mechanism 2025 & 2033
- Figure 21: Europe Diaphragm Pump Market Revenue Share (%), by Mechanism 2025 & 2033
- Figure 22: Europe Diaphragm Pump Market Volume Share (%), by Mechanism 2025 & 2033
- Figure 23: Europe Diaphragm Pump Market Revenue (Million), by Discharge Pressure 2025 & 2033
- Figure 24: Europe Diaphragm Pump Market Volume (K Tons), by Discharge Pressure 2025 & 2033
- Figure 25: Europe Diaphragm Pump Market Revenue Share (%), by Discharge Pressure 2025 & 2033
- Figure 26: Europe Diaphragm Pump Market Volume Share (%), by Discharge Pressure 2025 & 2033
- Figure 27: Europe Diaphragm Pump Market Revenue (Million), by End-User 2025 & 2033
- Figure 28: Europe Diaphragm Pump Market Volume (K Tons), by End-User 2025 & 2033
- Figure 29: Europe Diaphragm Pump Market Revenue Share (%), by End-User 2025 & 2033
- Figure 30: Europe Diaphragm Pump Market Volume Share (%), by End-User 2025 & 2033
- Figure 31: Europe Diaphragm Pump Market Revenue (Million), by Country 2025 & 2033
- Figure 32: Europe Diaphragm Pump Market Volume (K Tons), by Country 2025 & 2033
- Figure 33: Europe Diaphragm Pump Market Revenue Share (%), by Country 2025 & 2033
- Figure 34: Europe Diaphragm Pump Market Volume Share (%), by Country 2025 & 2033
- Figure 35: Asia Pacific Diaphragm Pump Market Revenue (Million), by Mechanism 2025 & 2033
- Figure 36: Asia Pacific Diaphragm Pump Market Volume (K Tons), by Mechanism 2025 & 2033
- Figure 37: Asia Pacific Diaphragm Pump Market Revenue Share (%), by Mechanism 2025 & 2033
- Figure 38: Asia Pacific Diaphragm Pump Market Volume Share (%), by Mechanism 2025 & 2033
- Figure 39: Asia Pacific Diaphragm Pump Market Revenue (Million), by Discharge Pressure 2025 & 2033
- Figure 40: Asia Pacific Diaphragm Pump Market Volume (K Tons), by Discharge Pressure 2025 & 2033
- Figure 41: Asia Pacific Diaphragm Pump Market Revenue Share (%), by Discharge Pressure 2025 & 2033
- Figure 42: Asia Pacific Diaphragm Pump Market Volume Share (%), by Discharge Pressure 2025 & 2033
- Figure 43: Asia Pacific Diaphragm Pump Market Revenue (Million), by End-User 2025 & 2033
- Figure 44: Asia Pacific Diaphragm Pump Market Volume (K Tons), by End-User 2025 & 2033
- Figure 45: Asia Pacific Diaphragm Pump Market Revenue Share (%), by End-User 2025 & 2033
- Figure 46: Asia Pacific Diaphragm Pump Market Volume Share (%), by End-User 2025 & 2033
- Figure 47: Asia Pacific Diaphragm Pump Market Revenue (Million), by Country 2025 & 2033
- Figure 48: Asia Pacific Diaphragm Pump Market Volume (K Tons), by Country 2025 & 2033
- Figure 49: Asia Pacific Diaphragm Pump Market Revenue Share (%), by Country 2025 & 2033
- Figure 50: Asia Pacific Diaphragm Pump Market Volume Share (%), by Country 2025 & 2033
- Figure 51: South America Diaphragm Pump Market Revenue (Million), by Mechanism 2025 & 2033
- Figure 52: South America Diaphragm Pump Market Volume (K Tons), by Mechanism 2025 & 2033
- Figure 53: South America Diaphragm Pump Market Revenue Share (%), by Mechanism 2025 & 2033
- Figure 54: South America Diaphragm Pump Market Volume Share (%), by Mechanism 2025 & 2033
- Figure 55: South America Diaphragm Pump Market Revenue (Million), by Discharge Pressure 2025 & 2033
- Figure 56: South America Diaphragm Pump Market Volume (K Tons), by Discharge Pressure 2025 & 2033
- Figure 57: South America Diaphragm Pump Market Revenue Share (%), by Discharge Pressure 2025 & 2033
- Figure 58: South America Diaphragm Pump Market Volume Share (%), by Discharge Pressure 2025 & 2033
- Figure 59: South America Diaphragm Pump Market Revenue (Million), by End-User 2025 & 2033
- Figure 60: South America Diaphragm Pump Market Volume (K Tons), by End-User 2025 & 2033
- Figure 61: South America Diaphragm Pump Market Revenue Share (%), by End-User 2025 & 2033
- Figure 62: South America Diaphragm Pump Market Volume Share (%), by End-User 2025 & 2033
- Figure 63: South America Diaphragm Pump Market Revenue (Million), by Country 2025 & 2033
- Figure 64: South America Diaphragm Pump Market Volume (K Tons), by Country 2025 & 2033
- Figure 65: South America Diaphragm Pump Market Revenue Share (%), by Country 2025 & 2033
- Figure 66: South America Diaphragm Pump Market Volume Share (%), by Country 2025 & 2033
- Figure 67: Middle East and Africa Diaphragm Pump Market Revenue (Million), by Mechanism 2025 & 2033
- Figure 68: Middle East and Africa Diaphragm Pump Market Volume (K Tons), by Mechanism 2025 & 2033
- Figure 69: Middle East and Africa Diaphragm Pump Market Revenue Share (%), by Mechanism 2025 & 2033
- Figure 70: Middle East and Africa Diaphragm Pump Market Volume Share (%), by Mechanism 2025 & 2033
- Figure 71: Middle East and Africa Diaphragm Pump Market Revenue (Million), by Discharge Pressure 2025 & 2033
- Figure 72: Middle East and Africa Diaphragm Pump Market Volume (K Tons), by Discharge Pressure 2025 & 2033
- Figure 73: Middle East and Africa Diaphragm Pump Market Revenue Share (%), by Discharge Pressure 2025 & 2033
- Figure 74: Middle East and Africa Diaphragm Pump Market Volume Share (%), by Discharge Pressure 2025 & 2033
- Figure 75: Middle East and Africa Diaphragm Pump Market Revenue (Million), by End-User 2025 & 2033
- Figure 76: Middle East and Africa Diaphragm Pump Market Volume (K Tons), by End-User 2025 & 2033
- Figure 77: Middle East and Africa Diaphragm Pump Market Revenue Share (%), by End-User 2025 & 2033
- Figure 78: Middle East and Africa Diaphragm Pump Market Volume Share (%), by End-User 2025 & 2033
- Figure 79: Middle East and Africa Diaphragm Pump Market Revenue (Million), by Country 2025 & 2033
- Figure 80: Middle East and Africa Diaphragm Pump Market Volume (K Tons), by Country 2025 & 2033
- Figure 81: Middle East and Africa Diaphragm Pump Market Revenue Share (%), by Country 2025 & 2033
- Figure 82: Middle East and Africa Diaphragm Pump Market Volume Share (%), by Country 2025 & 2033
List of Tables
- Table 1: Global Diaphragm Pump Market Revenue Million Forecast, by Mechanism 2020 & 2033
- Table 2: Global Diaphragm Pump Market Volume K Tons Forecast, by Mechanism 2020 & 2033
- Table 3: Global Diaphragm Pump Market Revenue Million Forecast, by Discharge Pressure 2020 & 2033
- Table 4: Global Diaphragm Pump Market Volume K Tons Forecast, by Discharge Pressure 2020 & 2033
- Table 5: Global Diaphragm Pump Market Revenue Million Forecast, by End-User 2020 & 2033
- Table 6: Global Diaphragm Pump Market Volume K Tons Forecast, by End-User 2020 & 2033
- Table 7: Global Diaphragm Pump Market Revenue Million Forecast, by Region 2020 & 2033
- Table 8: Global Diaphragm Pump Market Volume K Tons Forecast, by Region 2020 & 2033
- Table 9: Global Diaphragm Pump Market Revenue Million Forecast, by Mechanism 2020 & 2033
- Table 10: Global Diaphragm Pump Market Volume K Tons Forecast, by Mechanism 2020 & 2033
- Table 11: Global Diaphragm Pump Market Revenue Million Forecast, by Discharge Pressure 2020 & 2033
- Table 12: Global Diaphragm Pump Market Volume K Tons Forecast, by Discharge Pressure 2020 & 2033
- Table 13: Global Diaphragm Pump Market Revenue Million Forecast, by End-User 2020 & 2033
- Table 14: Global Diaphragm Pump Market Volume K Tons Forecast, by End-User 2020 & 2033
- Table 15: Global Diaphragm Pump Market Revenue Million Forecast, by Country 2020 & 2033
- Table 16: Global Diaphragm Pump Market Volume K Tons Forecast, by Country 2020 & 2033
- Table 17: Global Diaphragm Pump Market Revenue Million Forecast, by Mechanism 2020 & 2033
- Table 18: Global Diaphragm Pump Market Volume K Tons Forecast, by Mechanism 2020 & 2033
- Table 19: Global Diaphragm Pump Market Revenue Million Forecast, by Discharge Pressure 2020 & 2033
- Table 20: Global Diaphragm Pump Market Volume K Tons Forecast, by Discharge Pressure 2020 & 2033
- Table 21: Global Diaphragm Pump Market Revenue Million Forecast, by End-User 2020 & 2033
- Table 22: Global Diaphragm Pump Market Volume K Tons Forecast, by End-User 2020 & 2033
- Table 23: Global Diaphragm Pump Market Revenue Million Forecast, by Country 2020 & 2033
- Table 24: Global Diaphragm Pump Market Volume K Tons Forecast, by Country 2020 & 2033
- Table 25: Global Diaphragm Pump Market Revenue Million Forecast, by Mechanism 2020 & 2033
- Table 26: Global Diaphragm Pump Market Volume K Tons Forecast, by Mechanism 2020 & 2033
- Table 27: Global Diaphragm Pump Market Revenue Million Forecast, by Discharge Pressure 2020 & 2033
- Table 28: Global Diaphragm Pump Market Volume K Tons Forecast, by Discharge Pressure 2020 & 2033
- Table 29: Global Diaphragm Pump Market Revenue Million Forecast, by End-User 2020 & 2033
- Table 30: Global Diaphragm Pump Market Volume K Tons Forecast, by End-User 2020 & 2033
- Table 31: Global Diaphragm Pump Market Revenue Million Forecast, by Country 2020 & 2033
- Table 32: Global Diaphragm Pump Market Volume K Tons Forecast, by Country 2020 & 2033
- Table 33: Global Diaphragm Pump Market Revenue Million Forecast, by Mechanism 2020 & 2033
- Table 34: Global Diaphragm Pump Market Volume K Tons Forecast, by Mechanism 2020 & 2033
- Table 35: Global Diaphragm Pump Market Revenue Million Forecast, by Discharge Pressure 2020 & 2033
- Table 36: Global Diaphragm Pump Market Volume K Tons Forecast, by Discharge Pressure 2020 & 2033
- Table 37: Global Diaphragm Pump Market Revenue Million Forecast, by End-User 2020 & 2033
- Table 38: Global Diaphragm Pump Market Volume K Tons Forecast, by End-User 2020 & 2033
- Table 39: Global Diaphragm Pump Market Revenue Million Forecast, by Country 2020 & 2033
- Table 40: Global Diaphragm Pump Market Volume K Tons Forecast, by Country 2020 & 2033
- Table 41: Global Diaphragm Pump Market Revenue Million Forecast, by Mechanism 2020 & 2033
- Table 42: Global Diaphragm Pump Market Volume K Tons Forecast, by Mechanism 2020 & 2033
- Table 43: Global Diaphragm Pump Market Revenue Million Forecast, by Discharge Pressure 2020 & 2033
- Table 44: Global Diaphragm Pump Market Volume K Tons Forecast, by Discharge Pressure 2020 & 2033
- Table 45: Global Diaphragm Pump Market Revenue Million Forecast, by End-User 2020 & 2033
- Table 46: Global Diaphragm Pump Market Volume K Tons Forecast, by End-User 2020 & 2033
- Table 47: Global Diaphragm Pump Market Revenue Million Forecast, by Country 2020 & 2033
- Table 48: Global Diaphragm Pump Market Volume K Tons Forecast, by Country 2020 & 2033
Frequently Asked Questions
1. What is the projected Compound Annual Growth Rate (CAGR) of the Diaphragm Pump Market?
The projected CAGR is approximately > 6.10%.
2. Which companies are prominent players in the Diaphragm Pump Market?
Key companies in the market include Flowserve Corporation, Tapflo Group, Xylem Inc, Ingersoll-Rand PLC, Verder International B V, Graco Inc, LEWA Group*List Not Exhaustive, Idex Corporation, Dover Corporation, SPX FLOW Inc, Yamada Corporation, Grundfos AS.
3. What are the main segments of the Diaphragm Pump Market?
The market segments include Mechanism, Discharge Pressure, End-User.
4. Can you provide details about the market size?
The market size is estimated to be USD 6090 Million as of 2022.
5. What are some drivers contributing to market growth?
4.; Declining Costs of Solar Technologies4.; Demand for Decentralized Solar Energy Systems.
6. What are the notable trends driving market growth?
Water and Wastewater Sector to Dominate the Market.
7. Are there any restraints impacting market growth?
4.; Absence of Any New Initiatives in the Country.
8. Can you provide examples of recent developments in the market?
In August 2021, Graco Inc. announced the launch of its new Husky 3300e electric double diaphragm pump. The Husky 3300e pump transfers industrial fluids and offers plant managers high-volume fluid transfer (up 220 gpm) and drastically reduces power consumption.
9. What pricing options are available for accessing the report?
Pricing options include single-user, multi-user, and enterprise licenses priced at USD 4750, USD 5250, and USD 8750 respectively.
10. Is the market size provided in terms of value or volume?
The market size is provided in terms of value, measured in Million and volume, measured in K Tons.
11. Are there any specific market keywords associated with the report?
Yes, the market keyword associated with the report is "Diaphragm Pump Market," which aids in identifying and referencing the specific market segment covered.
12. How do I determine which pricing option suits my needs best?
The pricing options vary based on user requirements and access needs. Individual users may opt for single-user licenses, while businesses requiring broader access may choose multi-user or enterprise licenses for cost-effective access to the report.
13. Are there any additional resources or data provided in the Diaphragm Pump Market report?
While the report offers comprehensive insights, it's advisable to review the specific contents or supplementary materials provided to ascertain if additional resources or data are available.
14. How can I stay updated on further developments or reports in the Diaphragm Pump Market?
To stay informed about further developments, trends, and reports in the Diaphragm Pump Market, consider subscribing to industry newsletters, following relevant companies and organizations, or regularly checking reputable industry news sources and publications.
Methodology
Step 1 - Identification of Relevant Samples Size from Population Database


Step 2 - Approaches for Defining Global Market Size (Value, Volume* & Price*)

Note*: In applicable scenarios
Step 3 - Data Sources
Primary Research
- Web Analytics
- Survey Reports
- Research Institute
- Latest Research Reports
- Opinion Leaders
Secondary Research
- Annual Reports
- White Paper
- Latest Press Release
- Industry Association
- Paid Database
- Investor Presentations

Step 4 - Data Triangulation
Involves using different sources of information in order to increase the validity of a study
These sources are likely to be stakeholders in a program - participants, other researchers, program staff, other community members, and so on.
Then we put all data in single framework & apply various statistical tools to find out the dynamic on the market.
During the analysis stage, feedback from the stakeholder groups would be compared to determine areas of agreement as well as areas of divergence