

Key Insights
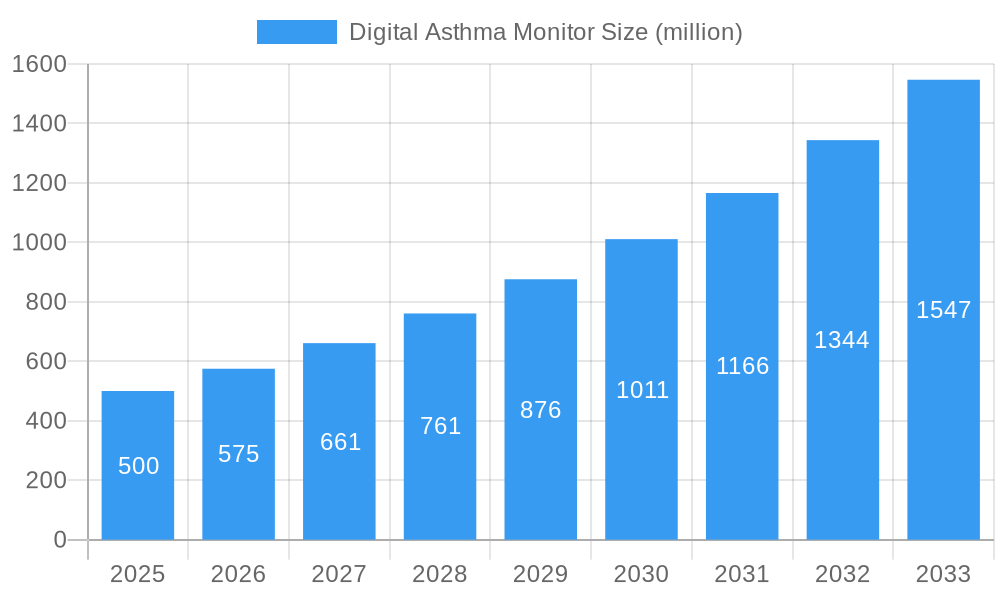
The global digital asthma monitor market is experiencing robust growth, driven by the increasing prevalence of asthma, advancements in sensor technology, and the rising demand for convenient and effective disease management tools. The market, estimated at $500 million in 2025, is projected to experience a Compound Annual Growth Rate (CAGR) of 15% from 2025 to 2033, reaching approximately $1.8 billion by 2033. This expansion is fueled by several key factors. Firstly, the increasing adoption of telehealth and remote patient monitoring solutions is creating new avenues for deploying digital asthma monitors. Secondly, the development of sophisticated wearable and handheld devices offering real-time data on peak expiratory flow (PEF), lung function, and other relevant metrics empowers patients and healthcare providers to proactively manage asthma exacerbations. Finally, the growing awareness about the benefits of personalized asthma management and the availability of user-friendly, connected devices are significantly contributing to market growth. The market segmentation shows a strong preference towards wearable and handheld monitors due to their portability and convenience compared to bench-top models. Hospitals and clinics remain the largest application segment, driven by their capacity for integrated data management and comprehensive patient care. However, the home care segment is expanding rapidly, reflecting the shift towards decentralized healthcare and patient empowerment.
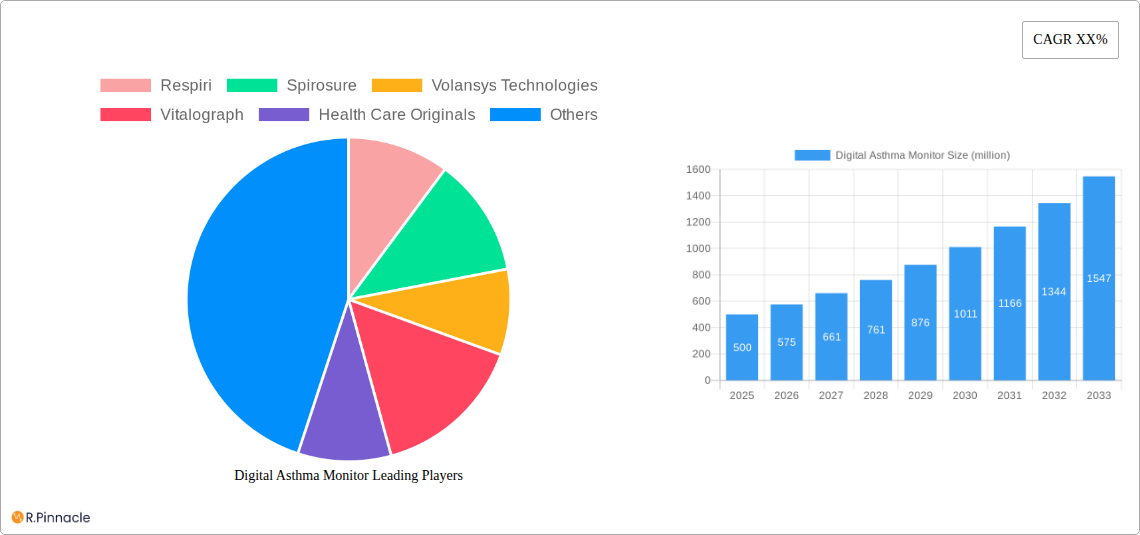
Digital Asthma Monitor Market Size (In Million)
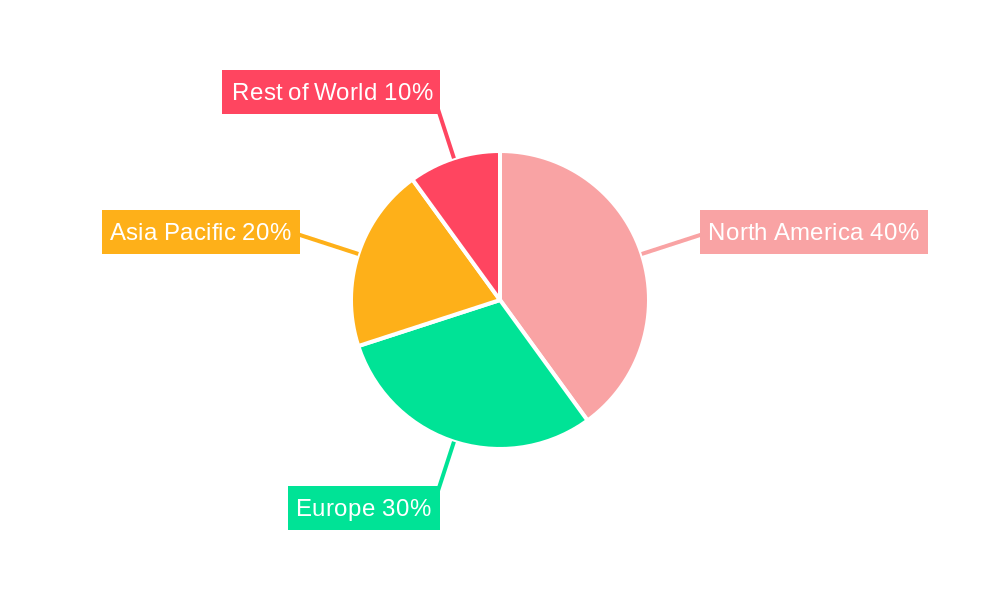
Competitive intensity within the digital asthma monitor market is high, with numerous established players and emerging technology companies vying for market share. Key players are focusing on technological innovation, strategic partnerships, and geographic expansion to secure a competitive edge. This includes developing more accurate and user-friendly devices with advanced features like integrated medication reminders and data analytics capabilities. Regional growth is diverse, with North America and Europe currently holding the largest market share due to high healthcare expenditure and technological advancements. However, Asia Pacific is witnessing significant growth potential driven by increasing asthma prevalence, rising disposable income, and improving healthcare infrastructure. The market faces some restraints, including high initial device costs, data privacy concerns, and the need for enhanced user education and training to ensure effective device utilization. Despite these challenges, the market’s positive outlook remains largely intact, driven by continuous technological innovation and a growing focus on improving asthma management.
Digital Asthma Monitor Company Market Share
Digital Asthma Monitor Market Report: 2019-2033
This comprehensive report provides a detailed analysis of the global digital asthma monitor market, offering invaluable insights for industry professionals, investors, and stakeholders. The study period spans from 2019 to 2033, with 2025 serving as the base and estimated year. The report projects a market value exceeding $XX million by 2033, driven by technological advancements and increasing prevalence of asthma. Key players like Respiri, Spirosure, Volansys Technologies, Vitalograph, Health Care Originals, Microlife, OMRON Healthcare, Isonea, Quvium, Adherium, Koninklijke Philips, Vectura Group, Propeller Health, Teva Pharmaceutical Industries, AstraZeneca, Cohero Health, 3M, AEvice Health, Anaxsys, and GlaxoSmithKline are profiled, showcasing their market share, strategies, and innovative offerings.
Digital Asthma Monitor Market Structure & Innovation Trends
The global digital asthma monitor market is characterized by a moderately concentrated structure, with a few major players holding significant market share. Respiri, for instance, holds an estimated XX% market share in the wearable segment in 2025, while Philips commands approximately XX% in the benchtop segment. Innovation is driven primarily by the demand for improved accuracy, ease of use, and remote monitoring capabilities. Regulatory frameworks, including FDA approvals and CE markings, play a significant role in market entry and product adoption. Product substitutes, such as traditional peak flow meters, continue to exist but are gradually being replaced by the convenience and data-driven insights of digital monitors. End-user demographics are shifting toward a broader age range, with increased adoption among children and elderly populations.
M&A activity within the sector has been moderate, with a few notable deals totaling approximately $XX million in the past five years. These include strategic acquisitions aimed at expanding product portfolios and geographical reach. Specific examples are limited due to confidentiality agreements, but the trend suggests consolidation within the market will likely continue.
- Market Concentration: Moderately concentrated, with key players holding significant shares.
- Innovation Drivers: Improved accuracy, ease of use, remote monitoring.
- Regulatory Landscape: FDA approvals, CE markings.
- Product Substitutes: Traditional peak flow meters.
- M&A Activity: Moderate, with total deal value around $XX million in recent years.
Digital Asthma Monitor Market Dynamics & Trends
The digital asthma monitor market is experiencing robust growth, with a projected Compound Annual Growth Rate (CAGR) of XX% during the forecast period (2025-2033). This growth is fueled by several key factors: the increasing prevalence of asthma globally, rising healthcare expenditure, and the growing adoption of telehealth and remote patient monitoring solutions. Technological disruptions, such as the incorporation of artificial intelligence (AI) for personalized treatment plans and the development of smaller, more user-friendly devices, are further accelerating market expansion. Consumer preferences are shifting toward devices offering seamless integration with mobile applications and convenient data sharing capabilities with healthcare providers. Competitive dynamics are primarily driven by innovation, pricing strategies, and strategic partnerships. Market penetration is expected to reach XX% by 2033 in developed markets.
Dominant Regions & Segments in Digital Asthma Monitor
North America currently dominates the digital asthma monitor market, driven by factors such as high healthcare expenditure, advanced healthcare infrastructure, and a high prevalence of asthma. Within the application segments, home care is experiencing the fastest growth, driven by the convenience and accessibility of remote monitoring. The wearable asthma monitor segment holds the largest market share due to its portability and user-friendly design.
- Key Drivers in North America: High healthcare expenditure, advanced infrastructure, high asthma prevalence.
- Home Care Segment: Fastest growing application segment due to convenience of remote monitoring.
- Wearable Asthma Monitors: Dominant type due to portability and ease of use.
- Other Regions: Europe and Asia-Pacific are experiencing significant growth, driven by rising awareness and increasing adoption.
Digital Asthma Monitor Product Innovations
Recent product innovations focus on miniaturization, improved sensor technology for more accurate measurements, and enhanced connectivity features for seamless data transmission. Smart inhalers integrated with digital monitors are gaining traction, enabling precise medication tracking and personalized asthma management. The incorporation of AI and machine learning algorithms allows for predictive analytics and early warning systems for asthma exacerbations. These improvements offer significant competitive advantages by providing more comprehensive and proactive asthma management solutions.
Report Scope & Segmentation Analysis
This report segments the digital asthma monitor market by application (Hospitals & Clinics, Home Care) and type (Bench-top, Wearable, Handheld). The Hospitals & Clinics segment is characterized by a focus on advanced features and data integration capabilities. The Home Care segment is growing rapidly, driven by increasing telehealth adoption. Bench-top monitors provide high accuracy but are less portable, while wearable and handheld monitors offer greater convenience but may compromise on some aspects of measurement accuracy. Each segment exhibits different growth trajectories and competitive landscapes, reflecting varied needs and preferences across different user groups.
Key Drivers of Digital Asthma Monitor Growth
The growth of the digital asthma monitor market is driven by several factors: the rising prevalence of asthma globally, particularly in developing countries; the increasing demand for improved asthma management solutions; the growing adoption of remote patient monitoring and telehealth; and the continuous technological advancements enhancing accuracy, user-friendliness, and data connectivity. Government initiatives promoting preventative healthcare and advancements in AI and machine learning algorithms further fuel market expansion.
Challenges in the Digital Asthma Monitor Sector
The sector faces challenges such as regulatory hurdles for device approvals and data privacy concerns related to patient health information. High initial costs of devices can limit accessibility, particularly in low-income regions. The market is also characterized by intense competition among established players and new entrants, creating pricing pressures. Supply chain disruptions and the need for skilled technicians for device maintenance and repair also represent significant hurdles.
Emerging Opportunities in Digital Asthma Monitor
Emerging opportunities include the expansion into untapped markets, particularly in developing countries with growing asthma prevalence. The integration of advanced technologies like AI and the Internet of Medical Things (IoMT) for predictive analytics and personalized asthma management presents significant growth potential. The development of cost-effective and user-friendly devices to improve accessibility and affordability will further unlock market expansion.
Leading Players in the Digital Asthma Monitor Market
- Respiri
- Spirosure
- Volansys Technologies
- Vitalograph
- Health Care Originals
- Microlife
- OMRON Healthcare
- Isonea
- Quvium
- Adherium
- Koninklijke Philips
- Vectura Group
- Propeller Health
- Teva Pharmaceutical Industries
- AstraZeneca
- Cohero Health
- 3M
- AEvice Health
- Anaxsys
- GlaxoSmithKline
Key Developments in Digital Asthma Monitor Industry
- January 2023: Respiri announced the launch of its next-generation wearable asthma monitor with improved accuracy.
- June 2022: Spirosure secured FDA approval for its new handheld asthma monitor.
- October 2021: A strategic partnership between Volansys Technologies and a major pharmaceutical company led to the development of a new connected inhaler. (Further details not publicly available due to NDA)
(Further key developments will be detailed in the full report)
Future Outlook for Digital Asthma Monitor Market
The future outlook for the digital asthma monitor market is extremely positive. Continued technological advancements, coupled with the increasing prevalence of asthma and rising healthcare expenditure, are expected to drive significant growth. Strategic partnerships and collaborations among technology providers and pharmaceutical companies will play a key role in shaping the market landscape. The focus on personalized asthma management and integration with other healthcare devices will further accelerate market expansion. The market is poised for substantial growth over the next decade, exceeding $XX million by 2033.
Digital Asthma Monitor Segmentation
-
1. Application
- 1.1. Hospitals & Clinics
- 1.2. Home Care
-
2. Types
- 2.1. Bench-top Asthma Monitor
- 2.2. Wearable Asthma Monitor
- 2.3. Handheld Asthma Monitor
Digital Asthma Monitor Segmentation By Geography
-
1. North America
- 1.1. United States
- 1.2. Canada
- 1.3. Mexico
-
2. South America
- 2.1. Brazil
- 2.2. Argentina
- 2.3. Rest of South America
-
3. Europe
- 3.1. United Kingdom
- 3.2. Germany
- 3.3. France
- 3.4. Italy
- 3.5. Spain
- 3.6. Russia
- 3.7. Benelux
- 3.8. Nordics
- 3.9. Rest of Europe
-
4. Middle East & Africa
- 4.1. Turkey
- 4.2. Israel
- 4.3. GCC
- 4.4. North Africa
- 4.5. South Africa
- 4.6. Rest of Middle East & Africa
-
5. Asia Pacific
- 5.1. China
- 5.2. India
- 5.3. Japan
- 5.4. South Korea
- 5.5. ASEAN
- 5.6. Oceania
- 5.7. Rest of Asia Pacific
Digital Asthma Monitor Regional Market Share
Geographic Coverage of Digital Asthma Monitor
Digital Asthma Monitor REPORT HIGHLIGHTS
| Aspects | Details |
|---|---|
| Study Period | 2020-2034 |
| Base Year | 2025 |
| Estimated Year | 2026 |
| Forecast Period | 2026-2034 |
| Historical Period | 2020-2025 |
| Growth Rate | CAGR of 5% from 2020-2034 |
| Segmentation |
|
Table of Contents
- 1. Introduction
- 1.1. Research Scope
- 1.2. Market Segmentation
- 1.3. Research Objective
- 1.4. Definitions and Assumptions
- 2. Executive Summary
- 2.1. Market Snapshot
- 3. Market Dynamics
- 3.1. Market Drivers
- 3.2. Market Restrains
- 3.3. Market Trends
- 3.4. Market Opportunities
- 4. Market Factor Analysis
- 4.1. Porters Five Forces
- 4.1.1. Bargaining Power of Suppliers
- 4.1.2. Bargaining Power of Buyers
- 4.1.3. Threat of New Entrants
- 4.1.4. Threat of Substitutes
- 4.1.5. Competitive Rivalry
- 4.2. PESTEL analysis
- 4.3. BCG Analysis
- 4.3.1. Stars (High Growth, High Market Share)
- 4.3.2. Cash Cows (Low Growth, High Market Share)
- 4.3.3. Question Mark (High Growth, Low Market Share)
- 4.3.4. Dogs (Low Growth, Low Market Share)
- 4.4. Ansoff Matrix Analysis
- 4.5. Supply Chain Analysis
- 4.6. Regulatory Landscape
- 4.7. Current Market Potential and Opportunity Assessment (TAM–SAM–SOM Framework)
- 4.8. PRI Analyst Note
- 4.1. Porters Five Forces
- 5. Market Analysis, Insights and Forecast 2021-2033
- 5.1. Market Analysis, Insights and Forecast - by Application
- 5.1.1. Hospitals & Clinics
- 5.1.2. Home Care
- 5.2. Market Analysis, Insights and Forecast - by Types
- 5.2.1. Bench-top Asthma Monitor
- 5.2.2. Wearable Asthma Monitor
- 5.2.3. Handheld Asthma Monitor
- 5.3. Market Analysis, Insights and Forecast - by Region
- 5.3.1. North America
- 5.3.2. South America
- 5.3.3. Europe
- 5.3.4. Middle East & Africa
- 5.3.5. Asia Pacific
- 5.1. Market Analysis, Insights and Forecast - by Application
- 6. Global Digital Asthma Monitor Analysis, Insights and Forecast, 2021-2033
- 6.1. Market Analysis, Insights and Forecast - by Application
- 6.1.1. Hospitals & Clinics
- 6.1.2. Home Care
- 6.2. Market Analysis, Insights and Forecast - by Types
- 6.2.1. Bench-top Asthma Monitor
- 6.2.2. Wearable Asthma Monitor
- 6.2.3. Handheld Asthma Monitor
- 6.1. Market Analysis, Insights and Forecast - by Application
- 7. North America Digital Asthma Monitor Analysis, Insights and Forecast, 2020-2032
- 7.1. Market Analysis, Insights and Forecast - by Application
- 7.1.1. Hospitals & Clinics
- 7.1.2. Home Care
- 7.2. Market Analysis, Insights and Forecast - by Types
- 7.2.1. Bench-top Asthma Monitor
- 7.2.2. Wearable Asthma Monitor
- 7.2.3. Handheld Asthma Monitor
- 7.1. Market Analysis, Insights and Forecast - by Application
- 8. South America Digital Asthma Monitor Analysis, Insights and Forecast, 2020-2032
- 8.1. Market Analysis, Insights and Forecast - by Application
- 8.1.1. Hospitals & Clinics
- 8.1.2. Home Care
- 8.2. Market Analysis, Insights and Forecast - by Types
- 8.2.1. Bench-top Asthma Monitor
- 8.2.2. Wearable Asthma Monitor
- 8.2.3. Handheld Asthma Monitor
- 8.1. Market Analysis, Insights and Forecast - by Application
- 9. Europe Digital Asthma Monitor Analysis, Insights and Forecast, 2020-2032
- 9.1. Market Analysis, Insights and Forecast - by Application
- 9.1.1. Hospitals & Clinics
- 9.1.2. Home Care
- 9.2. Market Analysis, Insights and Forecast - by Types
- 9.2.1. Bench-top Asthma Monitor
- 9.2.2. Wearable Asthma Monitor
- 9.2.3. Handheld Asthma Monitor
- 9.1. Market Analysis, Insights and Forecast - by Application
- 10. Middle East & Africa Digital Asthma Monitor Analysis, Insights and Forecast, 2020-2032
- 10.1. Market Analysis, Insights and Forecast - by Application
- 10.1.1. Hospitals & Clinics
- 10.1.2. Home Care
- 10.2. Market Analysis, Insights and Forecast - by Types
- 10.2.1. Bench-top Asthma Monitor
- 10.2.2. Wearable Asthma Monitor
- 10.2.3. Handheld Asthma Monitor
- 10.1. Market Analysis, Insights and Forecast - by Application
- 11. Asia Pacific Digital Asthma Monitor Analysis, Insights and Forecast, 2020-2032
- 11.1. Market Analysis, Insights and Forecast - by Application
- 11.1.1. Hospitals & Clinics
- 11.1.2. Home Care
- 11.2. Market Analysis, Insights and Forecast - by Types
- 11.2.1. Bench-top Asthma Monitor
- 11.2.2. Wearable Asthma Monitor
- 11.2.3. Handheld Asthma Monitor
- 11.1. Market Analysis, Insights and Forecast - by Application
- 12. Competitive Analysis
- 12.1. Company Profiles
- 12.1.1 Respiri
- 12.1.1.1. Company Overview
- 12.1.1.2. Products
- 12.1.1.3. Company Financials
- 12.1.1.4. SWOT Analysis
- 12.1.2 Spirosure
- 12.1.2.1. Company Overview
- 12.1.2.2. Products
- 12.1.2.3. Company Financials
- 12.1.2.4. SWOT Analysis
- 12.1.3 Volansys Technologies
- 12.1.3.1. Company Overview
- 12.1.3.2. Products
- 12.1.3.3. Company Financials
- 12.1.3.4. SWOT Analysis
- 12.1.4 Vitalograph
- 12.1.4.1. Company Overview
- 12.1.4.2. Products
- 12.1.4.3. Company Financials
- 12.1.4.4. SWOT Analysis
- 12.1.5 Health Care Originals
- 12.1.5.1. Company Overview
- 12.1.5.2. Products
- 12.1.5.3. Company Financials
- 12.1.5.4. SWOT Analysis
- 12.1.6 Microlife
- 12.1.6.1. Company Overview
- 12.1.6.2. Products
- 12.1.6.3. Company Financials
- 12.1.6.4. SWOT Analysis
- 12.1.7 OMRON Healthcare
- 12.1.7.1. Company Overview
- 12.1.7.2. Products
- 12.1.7.3. Company Financials
- 12.1.7.4. SWOT Analysis
- 12.1.8 ISonea
- 12.1.8.1. Company Overview
- 12.1.8.2. Products
- 12.1.8.3. Company Financials
- 12.1.8.4. SWOT Analysis
- 12.1.9 Quvium
- 12.1.9.1. Company Overview
- 12.1.9.2. Products
- 12.1.9.3. Company Financials
- 12.1.9.4. SWOT Analysis
- 12.1.10 Adherium
- 12.1.10.1. Company Overview
- 12.1.10.2. Products
- 12.1.10.3. Company Financials
- 12.1.10.4. SWOT Analysis
- 12.1.11 Koninklijke Philips
- 12.1.11.1. Company Overview
- 12.1.11.2. Products
- 12.1.11.3. Company Financials
- 12.1.11.4. SWOT Analysis
- 12.1.12 Vectura Group
- 12.1.12.1. Company Overview
- 12.1.12.2. Products
- 12.1.12.3. Company Financials
- 12.1.12.4. SWOT Analysis
- 12.1.13 Propeller Health
- 12.1.13.1. Company Overview
- 12.1.13.2. Products
- 12.1.13.3. Company Financials
- 12.1.13.4. SWOT Analysis
- 12.1.14 Teva Pharmaceutical Industries
- 12.1.14.1. Company Overview
- 12.1.14.2. Products
- 12.1.14.3. Company Financials
- 12.1.14.4. SWOT Analysis
- 12.1.15 AstraZeneca
- 12.1.15.1. Company Overview
- 12.1.15.2. Products
- 12.1.15.3. Company Financials
- 12.1.15.4. SWOT Analysis
- 12.1.16 Cohero Health
- 12.1.16.1. Company Overview
- 12.1.16.2. Products
- 12.1.16.3. Company Financials
- 12.1.16.4. SWOT Analysis
- 12.1.17 3M
- 12.1.17.1. Company Overview
- 12.1.17.2. Products
- 12.1.17.3. Company Financials
- 12.1.17.4. SWOT Analysis
- 12.1.18 AEvice Health
- 12.1.18.1. Company Overview
- 12.1.18.2. Products
- 12.1.18.3. Company Financials
- 12.1.18.4. SWOT Analysis
- 12.1.19 Anaxsys
- 12.1.19.1. Company Overview
- 12.1.19.2. Products
- 12.1.19.3. Company Financials
- 12.1.19.4. SWOT Analysis
- 12.1.20 GlaxoSmithKline
- 12.1.20.1. Company Overview
- 12.1.20.2. Products
- 12.1.20.3. Company Financials
- 12.1.20.4. SWOT Analysis
- 12.1.1 Respiri
- 12.2. Market Entropy
- 12.2.1 Company's Key Areas Served
- 12.2.2 Recent Developments
- 12.3. Company Market Share Analysis 2025
- 12.3.1 Top 5 Companies Market Share Analysis
- 12.3.2 Top 3 Companies Market Share Analysis
- 12.4. List of Potential Customers
- 13. Research Methodology
List of Figures
- Figure 1: Global Digital Asthma Monitor Revenue Breakdown (undefined, %) by Region 2025 & 2033
- Figure 2: North America Digital Asthma Monitor Revenue (undefined), by Application 2025 & 2033
- Figure 3: North America Digital Asthma Monitor Revenue Share (%), by Application 2025 & 2033
- Figure 4: North America Digital Asthma Monitor Revenue (undefined), by Types 2025 & 2033
- Figure 5: North America Digital Asthma Monitor Revenue Share (%), by Types 2025 & 2033
- Figure 6: North America Digital Asthma Monitor Revenue (undefined), by Country 2025 & 2033
- Figure 7: North America Digital Asthma Monitor Revenue Share (%), by Country 2025 & 2033
- Figure 8: South America Digital Asthma Monitor Revenue (undefined), by Application 2025 & 2033
- Figure 9: South America Digital Asthma Monitor Revenue Share (%), by Application 2025 & 2033
- Figure 10: South America Digital Asthma Monitor Revenue (undefined), by Types 2025 & 2033
- Figure 11: South America Digital Asthma Monitor Revenue Share (%), by Types 2025 & 2033
- Figure 12: South America Digital Asthma Monitor Revenue (undefined), by Country 2025 & 2033
- Figure 13: South America Digital Asthma Monitor Revenue Share (%), by Country 2025 & 2033
- Figure 14: Europe Digital Asthma Monitor Revenue (undefined), by Application 2025 & 2033
- Figure 15: Europe Digital Asthma Monitor Revenue Share (%), by Application 2025 & 2033
- Figure 16: Europe Digital Asthma Monitor Revenue (undefined), by Types 2025 & 2033
- Figure 17: Europe Digital Asthma Monitor Revenue Share (%), by Types 2025 & 2033
- Figure 18: Europe Digital Asthma Monitor Revenue (undefined), by Country 2025 & 2033
- Figure 19: Europe Digital Asthma Monitor Revenue Share (%), by Country 2025 & 2033
- Figure 20: Middle East & Africa Digital Asthma Monitor Revenue (undefined), by Application 2025 & 2033
- Figure 21: Middle East & Africa Digital Asthma Monitor Revenue Share (%), by Application 2025 & 2033
- Figure 22: Middle East & Africa Digital Asthma Monitor Revenue (undefined), by Types 2025 & 2033
- Figure 23: Middle East & Africa Digital Asthma Monitor Revenue Share (%), by Types 2025 & 2033
- Figure 24: Middle East & Africa Digital Asthma Monitor Revenue (undefined), by Country 2025 & 2033
- Figure 25: Middle East & Africa Digital Asthma Monitor Revenue Share (%), by Country 2025 & 2033
- Figure 26: Asia Pacific Digital Asthma Monitor Revenue (undefined), by Application 2025 & 2033
- Figure 27: Asia Pacific Digital Asthma Monitor Revenue Share (%), by Application 2025 & 2033
- Figure 28: Asia Pacific Digital Asthma Monitor Revenue (undefined), by Types 2025 & 2033
- Figure 29: Asia Pacific Digital Asthma Monitor Revenue Share (%), by Types 2025 & 2033
- Figure 30: Asia Pacific Digital Asthma Monitor Revenue (undefined), by Country 2025 & 2033
- Figure 31: Asia Pacific Digital Asthma Monitor Revenue Share (%), by Country 2025 & 2033
List of Tables
- Table 1: Global Digital Asthma Monitor Revenue undefined Forecast, by Application 2020 & 2033
- Table 2: Global Digital Asthma Monitor Revenue undefined Forecast, by Types 2020 & 2033
- Table 3: Global Digital Asthma Monitor Revenue undefined Forecast, by Region 2020 & 2033
- Table 4: Global Digital Asthma Monitor Revenue undefined Forecast, by Application 2020 & 2033
- Table 5: Global Digital Asthma Monitor Revenue undefined Forecast, by Types 2020 & 2033
- Table 6: Global Digital Asthma Monitor Revenue undefined Forecast, by Country 2020 & 2033
- Table 7: United States Digital Asthma Monitor Revenue (undefined) Forecast, by Application 2020 & 2033
- Table 8: Canada Digital Asthma Monitor Revenue (undefined) Forecast, by Application 2020 & 2033
- Table 9: Mexico Digital Asthma Monitor Revenue (undefined) Forecast, by Application 2020 & 2033
- Table 10: Global Digital Asthma Monitor Revenue undefined Forecast, by Application 2020 & 2033
- Table 11: Global Digital Asthma Monitor Revenue undefined Forecast, by Types 2020 & 2033
- Table 12: Global Digital Asthma Monitor Revenue undefined Forecast, by Country 2020 & 2033
- Table 13: Brazil Digital Asthma Monitor Revenue (undefined) Forecast, by Application 2020 & 2033
- Table 14: Argentina Digital Asthma Monitor Revenue (undefined) Forecast, by Application 2020 & 2033
- Table 15: Rest of South America Digital Asthma Monitor Revenue (undefined) Forecast, by Application 2020 & 2033
- Table 16: Global Digital Asthma Monitor Revenue undefined Forecast, by Application 2020 & 2033
- Table 17: Global Digital Asthma Monitor Revenue undefined Forecast, by Types 2020 & 2033
- Table 18: Global Digital Asthma Monitor Revenue undefined Forecast, by Country 2020 & 2033
- Table 19: United Kingdom Digital Asthma Monitor Revenue (undefined) Forecast, by Application 2020 & 2033
- Table 20: Germany Digital Asthma Monitor Revenue (undefined) Forecast, by Application 2020 & 2033
- Table 21: France Digital Asthma Monitor Revenue (undefined) Forecast, by Application 2020 & 2033
- Table 22: Italy Digital Asthma Monitor Revenue (undefined) Forecast, by Application 2020 & 2033
- Table 23: Spain Digital Asthma Monitor Revenue (undefined) Forecast, by Application 2020 & 2033
- Table 24: Russia Digital Asthma Monitor Revenue (undefined) Forecast, by Application 2020 & 2033
- Table 25: Benelux Digital Asthma Monitor Revenue (undefined) Forecast, by Application 2020 & 2033
- Table 26: Nordics Digital Asthma Monitor Revenue (undefined) Forecast, by Application 2020 & 2033
- Table 27: Rest of Europe Digital Asthma Monitor Revenue (undefined) Forecast, by Application 2020 & 2033
- Table 28: Global Digital Asthma Monitor Revenue undefined Forecast, by Application 2020 & 2033
- Table 29: Global Digital Asthma Monitor Revenue undefined Forecast, by Types 2020 & 2033
- Table 30: Global Digital Asthma Monitor Revenue undefined Forecast, by Country 2020 & 2033
- Table 31: Turkey Digital Asthma Monitor Revenue (undefined) Forecast, by Application 2020 & 2033
- Table 32: Israel Digital Asthma Monitor Revenue (undefined) Forecast, by Application 2020 & 2033
- Table 33: GCC Digital Asthma Monitor Revenue (undefined) Forecast, by Application 2020 & 2033
- Table 34: North Africa Digital Asthma Monitor Revenue (undefined) Forecast, by Application 2020 & 2033
- Table 35: South Africa Digital Asthma Monitor Revenue (undefined) Forecast, by Application 2020 & 2033
- Table 36: Rest of Middle East & Africa Digital Asthma Monitor Revenue (undefined) Forecast, by Application 2020 & 2033
- Table 37: Global Digital Asthma Monitor Revenue undefined Forecast, by Application 2020 & 2033
- Table 38: Global Digital Asthma Monitor Revenue undefined Forecast, by Types 2020 & 2033
- Table 39: Global Digital Asthma Monitor Revenue undefined Forecast, by Country 2020 & 2033
- Table 40: China Digital Asthma Monitor Revenue (undefined) Forecast, by Application 2020 & 2033
- Table 41: India Digital Asthma Monitor Revenue (undefined) Forecast, by Application 2020 & 2033
- Table 42: Japan Digital Asthma Monitor Revenue (undefined) Forecast, by Application 2020 & 2033
- Table 43: South Korea Digital Asthma Monitor Revenue (undefined) Forecast, by Application 2020 & 2033
- Table 44: ASEAN Digital Asthma Monitor Revenue (undefined) Forecast, by Application 2020 & 2033
- Table 45: Oceania Digital Asthma Monitor Revenue (undefined) Forecast, by Application 2020 & 2033
- Table 46: Rest of Asia Pacific Digital Asthma Monitor Revenue (undefined) Forecast, by Application 2020 & 2033
Frequently Asked Questions
1. What is the projected Compound Annual Growth Rate (CAGR) of the Digital Asthma Monitor?
The projected CAGR is approximately 5%.
2. Which companies are prominent players in the Digital Asthma Monitor?
Key companies in the market include Respiri, Spirosure, Volansys Technologies, Vitalograph, Health Care Originals, Microlife, OMRON Healthcare, ISonea, Quvium, Adherium, Koninklijke Philips, Vectura Group, Propeller Health, Teva Pharmaceutical Industries, AstraZeneca, Cohero Health, 3M, AEvice Health, Anaxsys, GlaxoSmithKline.
3. What are the main segments of the Digital Asthma Monitor?
The market segments include Application, Types.
4. Can you provide details about the market size?
The market size is estimated to be USD XXX N/A as of 2022.
5. What are some drivers contributing to market growth?
N/A
6. What are the notable trends driving market growth?
N/A
7. Are there any restraints impacting market growth?
N/A
8. Can you provide examples of recent developments in the market?
N/A
9. What pricing options are available for accessing the report?
Pricing options include single-user, multi-user, and enterprise licenses priced at USD 2900.00, USD 4350.00, and USD 5800.00 respectively.
10. Is the market size provided in terms of value or volume?
The market size is provided in terms of value, measured in N/A.
11. Are there any specific market keywords associated with the report?
Yes, the market keyword associated with the report is "Digital Asthma Monitor," which aids in identifying and referencing the specific market segment covered.
12. How do I determine which pricing option suits my needs best?
The pricing options vary based on user requirements and access needs. Individual users may opt for single-user licenses, while businesses requiring broader access may choose multi-user or enterprise licenses for cost-effective access to the report.
13. Are there any additional resources or data provided in the Digital Asthma Monitor report?
While the report offers comprehensive insights, it's advisable to review the specific contents or supplementary materials provided to ascertain if additional resources or data are available.
14. How can I stay updated on further developments or reports in the Digital Asthma Monitor?
To stay informed about further developments, trends, and reports in the Digital Asthma Monitor, consider subscribing to industry newsletters, following relevant companies and organizations, or regularly checking reputable industry news sources and publications.
Methodology
Step 1 - Identification of Relevant Samples Size from Population Database


Step 2 - Approaches for Defining Global Market Size (Value, Volume* & Price*)

Note*: In applicable scenarios
Step 3 - Data Sources
Primary Research
- Web Analytics
- Survey Reports
- Research Institute
- Latest Research Reports
- Opinion Leaders
Secondary Research
- Annual Reports
- White Paper
- Latest Press Release
- Industry Association
- Paid Database
- Investor Presentations

Step 4 - Data Triangulation
Involves using different sources of information in order to increase the validity of a study
These sources are likely to be stakeholders in a program - participants, other researchers, program staff, other community members, and so on.
Then we put all data in single framework & apply various statistical tools to find out the dynamic on the market.
During the analysis stage, feedback from the stakeholder groups would be compared to determine areas of agreement as well as areas of divergence