

Key Insights
The Digital Solutions for Waste Management market is poised for significant expansion, currently valued at approximately $15,500 million in 2025 and projected to grow at a robust Compound Annual Growth Rate (CAGR) of 15% through 2033. This growth is primarily fueled by the escalating need for efficient waste collection, processing, and disposal strategies, driven by increasing global waste generation and stringent environmental regulations. Smart cities initiatives worldwide are a major catalyst, demanding advanced technologies for real-time waste monitoring, optimized route planning for collection vehicles, and enhanced citizen engagement in waste segregation and recycling programs. The adoption of IoT sensors, AI-powered sorting robots, and data analytics platforms are transforming traditional waste management operations into more intelligent, cost-effective, and sustainable systems. Waste management companies are investing heavily in these digital solutions to reduce operational costs, improve resource recovery, and comply with evolving environmental mandates, further accelerating market penetration.
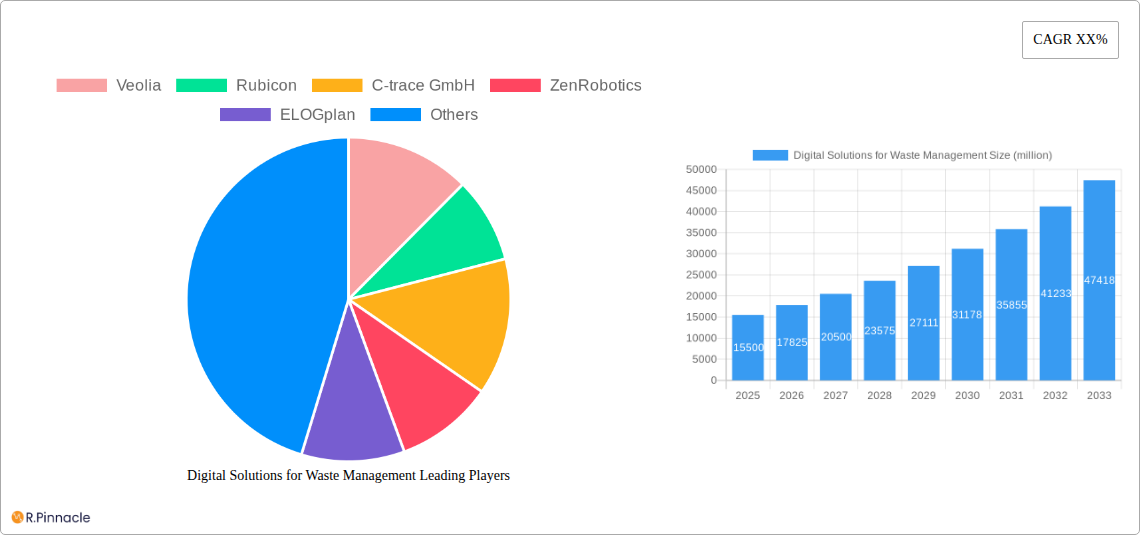
Digital Solutions for Waste Management Market Size (In Billion)
Key trends shaping the digital waste management landscape include the integration of AI and machine learning for predictive analytics in waste generation patterns, enabling proactive resource allocation and waste stream optimization. The emergence of circular economy principles is also driving demand for digital solutions that facilitate material traceability, recycling, and upcycling processes, moving beyond mere disposal. However, the market faces certain restraints, including the high initial investment costs associated with implementing advanced digital infrastructure and the need for skilled workforce to manage and operate these sophisticated systems. Data security and privacy concerns, particularly with the widespread deployment of IoT devices, also present a challenge. Despite these hurdles, the compelling benefits of digital transformation – including enhanced operational efficiency, reduced environmental impact, and improved public health – are expected to outweigh the challenges, ensuring sustained market growth across diverse applications such as smart cities, municipal services, and private waste management enterprises.
Digital Solutions for Waste Management Company Market Share
Unlock unparalleled insights into the rapidly evolving digital waste management landscape. This definitive report offers a deep dive into market dynamics, technological advancements, and strategic opportunities shaping the future of waste management. Empower your business with data-driven strategies to navigate this burgeoning sector, targeting key decision-makers in waste management companies, smart city initiatives, and municipal authorities.
Digital Solutions for Waste Management Market Structure & Innovation Trends
The digital solutions for waste management market exhibits a moderately concentrated structure, with a few key players holding significant market share. Innovation is predominantly driven by advancements in IoT, AI, and data analytics, enabling more efficient collection, sorting, and recycling processes. Regulatory frameworks, particularly those focused on circular economy principles and landfill diversion, are significant drivers for technology adoption. The emergence of sophisticated product substitutes, such as advanced sorting robots and AI-powered route optimization software, continuously reshapes the competitive arena. End-user demographics span from large-scale waste management corporations seeking operational efficiency to municipalities aiming for cost-effectiveness and environmental sustainability. Mergers and acquisition activities are on the rise, with an estimated XX million in deal values, as established companies seek to acquire innovative technologies and expand their service portfolios. For instance, a major acquisition in 2023 involved a value of approximately 150 million, highlighting the strategic importance of consolidation.
Digital Solutions for Waste Management Market Dynamics & Trends
The global digital solutions for waste management market is poised for substantial growth, driven by an escalating global waste generation crisis and a growing imperative for sustainable practices. The compound annual growth rate (CAGR) is projected to be XX% from 2025 to 2033, reaching an estimated market size of over one million dollars by the end of the forecast period. Key growth drivers include increasing urbanization, leading to higher waste volumes, and stringent environmental regulations mandating better waste management practices. Technological disruptions are at the forefront, with the integration of the Internet of Things (IoT) for smart bins that monitor fill levels and optimize collection routes, and Artificial Intelligence (AI) for automated waste sorting and identification. Consumer preferences are shifting towards eco-friendly solutions, pushing for higher recycling rates and reduced landfill dependency. Competitive dynamics are characterized by intense innovation, with companies focusing on developing integrated platforms that offer comprehensive waste management solutions, from collection to processing and data analysis. Market penetration for advanced digital solutions is steadily increasing, particularly in developed nations, as the tangible benefits of cost savings and environmental compliance become more apparent. The estimated market penetration of smart waste bins, for example, is expected to grow from xx% in 2024 to xx% by 2033. Furthermore, the rising adoption of smart city initiatives worldwide is a significant catalyst, as these initiatives heavily rely on digital infrastructure for efficient urban management, including waste services. The growing emphasis on the circular economy and the need to extract maximum value from waste streams are also pushing the adoption of digital solutions that can facilitate material recovery and reuse.
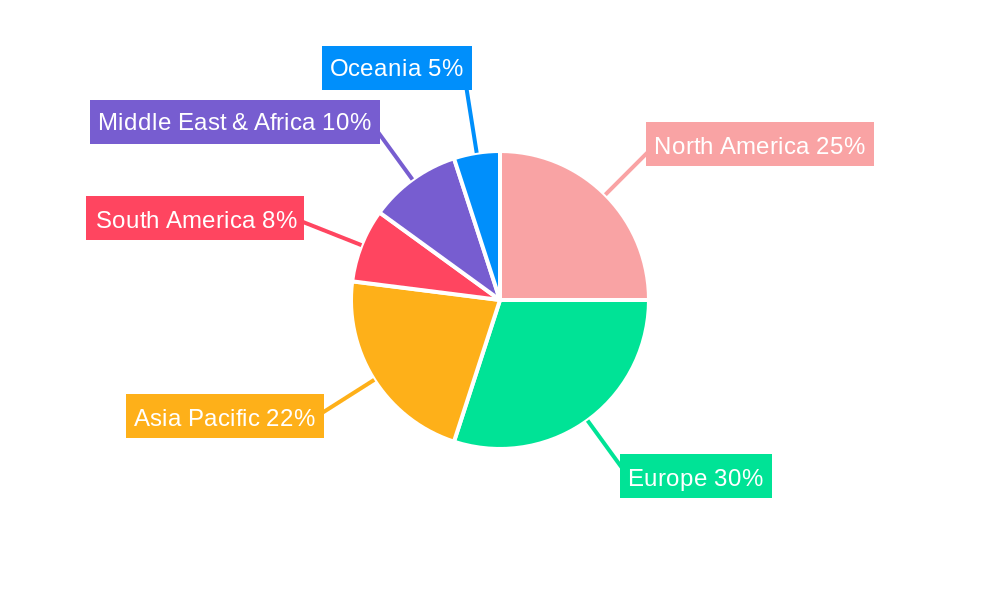
Dominant Regions & Segments in Digital Solutions for Waste Management
North America currently leads the digital solutions for waste management market, driven by robust economic policies promoting sustainability, advanced technological infrastructure, and a high degree of smart city adoption. The United States, in particular, is a key market due to the presence of major waste management companies and significant investment in smart technologies.
Leading Region Drivers:
- Economic Policies: Government incentives and regulations favoring waste reduction and recycling.
- Technological Advancement: High adoption rates of IoT, AI, and data analytics in urban environments.
- Smart City Initiatives: Extensive implementation of smart city projects, integrating waste management into broader urban planning.
Dominant Segments:
- Application: Waste Companies: This segment represents a significant portion of the market due to the direct operational needs of waste management service providers for efficiency and cost optimization. They are early adopters of solutions that streamline collection routes, improve fleet management, and enhance sorting accuracy. The market size for waste companies is projected to reach over one million dollars by 2033.
- Types: Service: The service segment, encompassing software platforms, data analytics, and ongoing maintenance and support, is experiencing rapid growth. This is driven by the increasing complexity of waste management operations and the demand for integrated, data-driven solutions. The service segment is expected to grow at a CAGR of xx% during the forecast period.
Detailed Dominance Analysis:
While North America currently holds the dominant position, Europe is rapidly gaining traction due to its stringent environmental regulations and strong commitment to the circular economy. Countries like Germany and the UK are investing heavily in smart waste management technologies to meet ambitious recycling targets. Asia-Pacific is emerging as a high-growth region, fueled by rapid urbanization and increasing environmental awareness, though market penetration is still in its nascent stages compared to developed regions. The Smart Cities application segment is projected to witness the highest growth rate, as municipalities globally recognize the critical role of efficient digital waste management in achieving smart city objectives. The Service type segment is also expected to outpace hardware solutions in growth, reflecting the increasing demand for sophisticated software and data-driven insights that optimize the entire waste management lifecycle. The market share for service-based solutions is anticipated to expand significantly as companies move towards subscription-based models and integrated management platforms.
Digital Solutions for Waste Management Product Innovations
Product innovation in digital waste management centers on enhanced IoT capabilities for smart bins, advanced AI algorithms for automated waste sorting, and integrated software platforms for comprehensive data analysis and route optimization. Key advancements include real-time waste level monitoring, predictive maintenance for waste management fleets, and intelligent sorting systems capable of identifying and separating a wider range of recyclable materials. These innovations offer competitive advantages by reducing operational costs, improving recycling efficiency, and providing valuable data insights for better decision-making, thereby driving market adoption and fostering a more sustainable waste management ecosystem.
Report Scope & Segmentation Analysis
This report meticulously analyzes the digital solutions for waste management market, encompassing a comprehensive segmentation strategy.
- Application: Waste Companies: This segment focuses on solutions tailored for waste collection, transportation, and processing companies. Growth projections indicate a significant market size, exceeding one million dollars by 2033, driven by efficiency gains and operational cost reductions. Competitive dynamics are characterized by the adoption of integrated management platforms.
- Application: Smart Cities: This segment examines the integration of digital waste solutions into smart city frameworks, aiming for optimized urban resource management and environmental sustainability. This segment is expected to exhibit the highest CAGR, xx%, due to the global push for smart urban development.
- Application: Municipalities: This segment addresses the needs of local government bodies responsible for public waste management services, focusing on cost-effectiveness, regulatory compliance, and citizen satisfaction. Market sizes are projected to grow steadily, with competitive dynamics centered around public-private partnerships.
- Application: Others: This broad category includes solutions for industrial waste management, agricultural waste, and specialized waste streams. Growth projections are moderate, with market sizes evolving based on niche industry demands and technological adoption rates.
- Types: Hardware: This segment covers physical devices such as smart bins, sensors, sorting machinery, and communication modules. The market size is projected to reach over one million dollars, with growth driven by the increasing deployment of smart infrastructure.
- Types: Service: This segment includes software platforms, data analytics, cloud-based solutions, consulting, and maintenance services. This segment is anticipated to experience robust growth, with competitive dynamics revolving around comprehensive and intelligent waste management solutions.
Key Drivers of Digital Solutions for Waste Management Growth
The digital solutions for waste management market is propelled by several critical factors. Growing global waste generation, exacerbated by increasing population and urbanization, creates an urgent need for efficient management systems. Stringent environmental regulations and government mandates focused on sustainability, landfill diversion, and the circular economy are significant catalysts. Technological advancements, including the widespread adoption of IoT for real-time monitoring, AI for automated sorting and route optimization, and big data analytics for operational intelligence, are fundamentally transforming the sector. Furthermore, the economic benefits associated with optimized collection routes, reduced fuel consumption, and enhanced material recovery are driving adoption among waste management entities. The growing awareness of environmental impact and the demand for sustainable practices from consumers and businesses alike further bolster market growth.
Challenges in the Digital Solutions for Waste Management Sector
Despite the promising growth, the digital solutions for waste management sector faces several hurdles. High upfront investment costs for implementing advanced hardware and software solutions can be a barrier, particularly for smaller organizations. Integration complexities with existing legacy systems and the lack of standardization across different platforms pose significant challenges. Regulatory hurdles, while driving adoption, can also be complex to navigate across different regions and jurisdictions. Supply chain issues, especially for specialized hardware components, can lead to delays and increased costs. Furthermore, the competitive pressures among solution providers can lead to price wars, impacting profitability. Public perception and the need for education on the benefits of digital waste management also play a role in adoption rates. The cybersecurity of connected devices and sensitive data is another critical concern that needs to be addressed comprehensively.
Emerging Opportunities in Digital Solutions for Waste Management
Emerging opportunities abound in the digital solutions for waste management sector. The expansion of smart city initiatives globally presents a vast market for integrated waste management solutions that contribute to urban efficiency and sustainability. The growing focus on the circular economy is creating opportunities for technologies that enhance material recovery, recycling, and waste-to-energy processes. The development of AI-powered waste analytics for predictive maintenance and resource optimization offers significant potential for cost savings and improved operational planning. Furthermore, niche markets, such as the management of electronic waste, hazardous waste, and organic waste, are ripe for specialized digital solutions. The increasing demand for sustainability reporting and compliance tools presents another avenue for growth, enabling organizations to track and report their environmental performance effectively. Advancements in robotics for automated sorting are also opening new avenues for efficiency and safety.
Leading Players in the Digital Solutions for Waste Management Market
- Veolia
- Rubicon
- C-trace GmbH
- ZenRobotics
- ELOGplan
- AMCS Group
- Contelligent
- Bigbelly Solar
- AMP Robotics
- ISB Global
- Evreka
- Geminor
- Sensoneo
- BrighterBins
Key Developments in Digital Solutions for Waste Management Industry
- 2023/10: Veolia expands its smart waste management solutions with a new IoT platform for enhanced route optimization.
- 2023/08: Rubicon acquires a leading AI-powered waste analytics startup to bolster its data offerings.
- 2023/05: ZenRobotics unveils its latest generation of AI-powered sorting robots, increasing material recovery rates by xx%.
- 2022/12: AMCS Group launches a comprehensive cloud-based platform for the waste and recycling industry.
- 2022/09: Bigbelly Solar introduces next-generation smart compacting bins with enhanced communication capabilities.
- 2022/06: AMP Robotics secures significant funding to scale its robotic sorting solutions globally.
- 2021/11: Evreka partners with a major municipality to implement a city-wide smart waste management system.
- 2021/07: Sensoneo introduces an advanced waste management platform with predictive analytics for fleet management.
Future Outlook for Digital Solutions for Waste Management Market
The future outlook for the digital solutions for waste management market is exceptionally bright, driven by an unwavering global commitment to sustainability and efficiency. Continued advancements in AI, IoT, and robotics will further revolutionize waste collection, sorting, and recycling processes, leading to significant cost reductions and environmental benefits. The increasing adoption of circular economy principles will create demand for sophisticated technologies that facilitate material reuse and value extraction from waste streams. Smart city initiatives will act as major growth accelerators, integrating digital waste management into the fabric of urban living. Strategic partnerships and mergers are expected to consolidate the market, fostering innovation and expanding service offerings. The market is poised for sustained growth, offering immense opportunities for businesses that can deliver integrated, intelligent, and sustainable waste management solutions.
Digital Solutions for Waste Management Segmentation
-
1. Application
- 1.1. Waste Companies
- 1.2. Smart Cities
- 1.3. Municipalities
- 1.4. Others
-
2. Types
- 2.1. Hardware
- 2.2. Service
Digital Solutions for Waste Management Segmentation By Geography
-
1. North America
- 1.1. United States
- 1.2. Canada
- 1.3. Mexico
-
2. South America
- 2.1. Brazil
- 2.2. Argentina
- 2.3. Rest of South America
-
3. Europe
- 3.1. United Kingdom
- 3.2. Germany
- 3.3. France
- 3.4. Italy
- 3.5. Spain
- 3.6. Russia
- 3.7. Benelux
- 3.8. Nordics
- 3.9. Rest of Europe
-
4. Middle East & Africa
- 4.1. Turkey
- 4.2. Israel
- 4.3. GCC
- 4.4. North Africa
- 4.5. South Africa
- 4.6. Rest of Middle East & Africa
-
5. Asia Pacific
- 5.1. China
- 5.2. India
- 5.3. Japan
- 5.4. South Korea
- 5.5. ASEAN
- 5.6. Oceania
- 5.7. Rest of Asia Pacific
Digital Solutions for Waste Management Regional Market Share
Geographic Coverage of Digital Solutions for Waste Management
Digital Solutions for Waste Management REPORT HIGHLIGHTS
| Aspects | Details |
|---|---|
| Study Period | 2020-2034 |
| Base Year | 2025 |
| Estimated Year | 2026 |
| Forecast Period | 2026-2034 |
| Historical Period | 2020-2025 |
| Growth Rate | CAGR of XX% from 2020-2034 |
| Segmentation |
|
Table of Contents
- 1. Introduction
- 1.1. Research Scope
- 1.2. Market Segmentation
- 1.3. Research Methodology
- 1.4. Definitions and Assumptions
- 2. Executive Summary
- 2.1. Introduction
- 3. Market Dynamics
- 3.1. Introduction
- 3.2. Market Drivers
- 3.3. Market Restrains
- 3.4. Market Trends
- 4. Market Factor Analysis
- 4.1. Porters Five Forces
- 4.2. Supply/Value Chain
- 4.3. PESTEL analysis
- 4.4. Market Entropy
- 4.5. Patent/Trademark Analysis
- 5. Global Digital Solutions for Waste Management Analysis, Insights and Forecast, 2020-2032
- 5.1. Market Analysis, Insights and Forecast - by Application
- 5.1.1. Waste Companies
- 5.1.2. Smart Cities
- 5.1.3. Municipalities
- 5.1.4. Others
- 5.2. Market Analysis, Insights and Forecast - by Types
- 5.2.1. Hardware
- 5.2.2. Service
- 5.3. Market Analysis, Insights and Forecast - by Region
- 5.3.1. North America
- 5.3.2. South America
- 5.3.3. Europe
- 5.3.4. Middle East & Africa
- 5.3.5. Asia Pacific
- 5.1. Market Analysis, Insights and Forecast - by Application
- 6. North America Digital Solutions for Waste Management Analysis, Insights and Forecast, 2020-2032
- 6.1. Market Analysis, Insights and Forecast - by Application
- 6.1.1. Waste Companies
- 6.1.2. Smart Cities
- 6.1.3. Municipalities
- 6.1.4. Others
- 6.2. Market Analysis, Insights and Forecast - by Types
- 6.2.1. Hardware
- 6.2.2. Service
- 6.1. Market Analysis, Insights and Forecast - by Application
- 7. South America Digital Solutions for Waste Management Analysis, Insights and Forecast, 2020-2032
- 7.1. Market Analysis, Insights and Forecast - by Application
- 7.1.1. Waste Companies
- 7.1.2. Smart Cities
- 7.1.3. Municipalities
- 7.1.4. Others
- 7.2. Market Analysis, Insights and Forecast - by Types
- 7.2.1. Hardware
- 7.2.2. Service
- 7.1. Market Analysis, Insights and Forecast - by Application
- 8. Europe Digital Solutions for Waste Management Analysis, Insights and Forecast, 2020-2032
- 8.1. Market Analysis, Insights and Forecast - by Application
- 8.1.1. Waste Companies
- 8.1.2. Smart Cities
- 8.1.3. Municipalities
- 8.1.4. Others
- 8.2. Market Analysis, Insights and Forecast - by Types
- 8.2.1. Hardware
- 8.2.2. Service
- 8.1. Market Analysis, Insights and Forecast - by Application
- 9. Middle East & Africa Digital Solutions for Waste Management Analysis, Insights and Forecast, 2020-2032
- 9.1. Market Analysis, Insights and Forecast - by Application
- 9.1.1. Waste Companies
- 9.1.2. Smart Cities
- 9.1.3. Municipalities
- 9.1.4. Others
- 9.2. Market Analysis, Insights and Forecast - by Types
- 9.2.1. Hardware
- 9.2.2. Service
- 9.1. Market Analysis, Insights and Forecast - by Application
- 10. Asia Pacific Digital Solutions for Waste Management Analysis, Insights and Forecast, 2020-2032
- 10.1. Market Analysis, Insights and Forecast - by Application
- 10.1.1. Waste Companies
- 10.1.2. Smart Cities
- 10.1.3. Municipalities
- 10.1.4. Others
- 10.2. Market Analysis, Insights and Forecast - by Types
- 10.2.1. Hardware
- 10.2.2. Service
- 10.1. Market Analysis, Insights and Forecast - by Application
- 11. Competitive Analysis
- 11.1. Global Market Share Analysis 2025
- 11.2. Company Profiles
- 11.2.1 Veolia
- 11.2.1.1. Overview
- 11.2.1.2. Products
- 11.2.1.3. SWOT Analysis
- 11.2.1.4. Recent Developments
- 11.2.1.5. Financials (Based on Availability)
- 11.2.2 Rubicon
- 11.2.2.1. Overview
- 11.2.2.2. Products
- 11.2.2.3. SWOT Analysis
- 11.2.2.4. Recent Developments
- 11.2.2.5. Financials (Based on Availability)
- 11.2.3 C-trace GmbH
- 11.2.3.1. Overview
- 11.2.3.2. Products
- 11.2.3.3. SWOT Analysis
- 11.2.3.4. Recent Developments
- 11.2.3.5. Financials (Based on Availability)
- 11.2.4 ZenRobotics
- 11.2.4.1. Overview
- 11.2.4.2. Products
- 11.2.4.3. SWOT Analysis
- 11.2.4.4. Recent Developments
- 11.2.4.5. Financials (Based on Availability)
- 11.2.5 ELOGplan
- 11.2.5.1. Overview
- 11.2.5.2. Products
- 11.2.5.3. SWOT Analysis
- 11.2.5.4. Recent Developments
- 11.2.5.5. Financials (Based on Availability)
- 11.2.6 AMCS Group
- 11.2.6.1. Overview
- 11.2.6.2. Products
- 11.2.6.3. SWOT Analysis
- 11.2.6.4. Recent Developments
- 11.2.6.5. Financials (Based on Availability)
- 11.2.7 Contelligent
- 11.2.7.1. Overview
- 11.2.7.2. Products
- 11.2.7.3. SWOT Analysis
- 11.2.7.4. Recent Developments
- 11.2.7.5. Financials (Based on Availability)
- 11.2.8 Bigbelly Solar
- 11.2.8.1. Overview
- 11.2.8.2. Products
- 11.2.8.3. SWOT Analysis
- 11.2.8.4. Recent Developments
- 11.2.8.5. Financials (Based on Availability)
- 11.2.9 AMP Robotics
- 11.2.9.1. Overview
- 11.2.9.2. Products
- 11.2.9.3. SWOT Analysis
- 11.2.9.4. Recent Developments
- 11.2.9.5. Financials (Based on Availability)
- 11.2.10 ISB Global
- 11.2.10.1. Overview
- 11.2.10.2. Products
- 11.2.10.3. SWOT Analysis
- 11.2.10.4. Recent Developments
- 11.2.10.5. Financials (Based on Availability)
- 11.2.11 Evreka
- 11.2.11.1. Overview
- 11.2.11.2. Products
- 11.2.11.3. SWOT Analysis
- 11.2.11.4. Recent Developments
- 11.2.11.5. Financials (Based on Availability)
- 11.2.12 Geminor
- 11.2.12.1. Overview
- 11.2.12.2. Products
- 11.2.12.3. SWOT Analysis
- 11.2.12.4. Recent Developments
- 11.2.12.5. Financials (Based on Availability)
- 11.2.13 Sensoneo
- 11.2.13.1. Overview
- 11.2.13.2. Products
- 11.2.13.3. SWOT Analysis
- 11.2.13.4. Recent Developments
- 11.2.13.5. Financials (Based on Availability)
- 11.2.14 BrighterBins
- 11.2.14.1. Overview
- 11.2.14.2. Products
- 11.2.14.3. SWOT Analysis
- 11.2.14.4. Recent Developments
- 11.2.14.5. Financials (Based on Availability)
- 11.2.1 Veolia
List of Figures
- Figure 1: Global Digital Solutions for Waste Management Revenue Breakdown (million, %) by Region 2025 & 2033
- Figure 2: North America Digital Solutions for Waste Management Revenue (million), by Application 2025 & 2033
- Figure 3: North America Digital Solutions for Waste Management Revenue Share (%), by Application 2025 & 2033
- Figure 4: North America Digital Solutions for Waste Management Revenue (million), by Types 2025 & 2033
- Figure 5: North America Digital Solutions for Waste Management Revenue Share (%), by Types 2025 & 2033
- Figure 6: North America Digital Solutions for Waste Management Revenue (million), by Country 2025 & 2033
- Figure 7: North America Digital Solutions for Waste Management Revenue Share (%), by Country 2025 & 2033
- Figure 8: South America Digital Solutions for Waste Management Revenue (million), by Application 2025 & 2033
- Figure 9: South America Digital Solutions for Waste Management Revenue Share (%), by Application 2025 & 2033
- Figure 10: South America Digital Solutions for Waste Management Revenue (million), by Types 2025 & 2033
- Figure 11: South America Digital Solutions for Waste Management Revenue Share (%), by Types 2025 & 2033
- Figure 12: South America Digital Solutions for Waste Management Revenue (million), by Country 2025 & 2033
- Figure 13: South America Digital Solutions for Waste Management Revenue Share (%), by Country 2025 & 2033
- Figure 14: Europe Digital Solutions for Waste Management Revenue (million), by Application 2025 & 2033
- Figure 15: Europe Digital Solutions for Waste Management Revenue Share (%), by Application 2025 & 2033
- Figure 16: Europe Digital Solutions for Waste Management Revenue (million), by Types 2025 & 2033
- Figure 17: Europe Digital Solutions for Waste Management Revenue Share (%), by Types 2025 & 2033
- Figure 18: Europe Digital Solutions for Waste Management Revenue (million), by Country 2025 & 2033
- Figure 19: Europe Digital Solutions for Waste Management Revenue Share (%), by Country 2025 & 2033
- Figure 20: Middle East & Africa Digital Solutions for Waste Management Revenue (million), by Application 2025 & 2033
- Figure 21: Middle East & Africa Digital Solutions for Waste Management Revenue Share (%), by Application 2025 & 2033
- Figure 22: Middle East & Africa Digital Solutions for Waste Management Revenue (million), by Types 2025 & 2033
- Figure 23: Middle East & Africa Digital Solutions for Waste Management Revenue Share (%), by Types 2025 & 2033
- Figure 24: Middle East & Africa Digital Solutions for Waste Management Revenue (million), by Country 2025 & 2033
- Figure 25: Middle East & Africa Digital Solutions for Waste Management Revenue Share (%), by Country 2025 & 2033
- Figure 26: Asia Pacific Digital Solutions for Waste Management Revenue (million), by Application 2025 & 2033
- Figure 27: Asia Pacific Digital Solutions for Waste Management Revenue Share (%), by Application 2025 & 2033
- Figure 28: Asia Pacific Digital Solutions for Waste Management Revenue (million), by Types 2025 & 2033
- Figure 29: Asia Pacific Digital Solutions for Waste Management Revenue Share (%), by Types 2025 & 2033
- Figure 30: Asia Pacific Digital Solutions for Waste Management Revenue (million), by Country 2025 & 2033
- Figure 31: Asia Pacific Digital Solutions for Waste Management Revenue Share (%), by Country 2025 & 2033
List of Tables
- Table 1: Global Digital Solutions for Waste Management Revenue million Forecast, by Application 2020 & 2033
- Table 2: Global Digital Solutions for Waste Management Revenue million Forecast, by Types 2020 & 2033
- Table 3: Global Digital Solutions for Waste Management Revenue million Forecast, by Region 2020 & 2033
- Table 4: Global Digital Solutions for Waste Management Revenue million Forecast, by Application 2020 & 2033
- Table 5: Global Digital Solutions for Waste Management Revenue million Forecast, by Types 2020 & 2033
- Table 6: Global Digital Solutions for Waste Management Revenue million Forecast, by Country 2020 & 2033
- Table 7: United States Digital Solutions for Waste Management Revenue (million) Forecast, by Application 2020 & 2033
- Table 8: Canada Digital Solutions for Waste Management Revenue (million) Forecast, by Application 2020 & 2033
- Table 9: Mexico Digital Solutions for Waste Management Revenue (million) Forecast, by Application 2020 & 2033
- Table 10: Global Digital Solutions for Waste Management Revenue million Forecast, by Application 2020 & 2033
- Table 11: Global Digital Solutions for Waste Management Revenue million Forecast, by Types 2020 & 2033
- Table 12: Global Digital Solutions for Waste Management Revenue million Forecast, by Country 2020 & 2033
- Table 13: Brazil Digital Solutions for Waste Management Revenue (million) Forecast, by Application 2020 & 2033
- Table 14: Argentina Digital Solutions for Waste Management Revenue (million) Forecast, by Application 2020 & 2033
- Table 15: Rest of South America Digital Solutions for Waste Management Revenue (million) Forecast, by Application 2020 & 2033
- Table 16: Global Digital Solutions for Waste Management Revenue million Forecast, by Application 2020 & 2033
- Table 17: Global Digital Solutions for Waste Management Revenue million Forecast, by Types 2020 & 2033
- Table 18: Global Digital Solutions for Waste Management Revenue million Forecast, by Country 2020 & 2033
- Table 19: United Kingdom Digital Solutions for Waste Management Revenue (million) Forecast, by Application 2020 & 2033
- Table 20: Germany Digital Solutions for Waste Management Revenue (million) Forecast, by Application 2020 & 2033
- Table 21: France Digital Solutions for Waste Management Revenue (million) Forecast, by Application 2020 & 2033
- Table 22: Italy Digital Solutions for Waste Management Revenue (million) Forecast, by Application 2020 & 2033
- Table 23: Spain Digital Solutions for Waste Management Revenue (million) Forecast, by Application 2020 & 2033
- Table 24: Russia Digital Solutions for Waste Management Revenue (million) Forecast, by Application 2020 & 2033
- Table 25: Benelux Digital Solutions for Waste Management Revenue (million) Forecast, by Application 2020 & 2033
- Table 26: Nordics Digital Solutions for Waste Management Revenue (million) Forecast, by Application 2020 & 2033
- Table 27: Rest of Europe Digital Solutions for Waste Management Revenue (million) Forecast, by Application 2020 & 2033
- Table 28: Global Digital Solutions for Waste Management Revenue million Forecast, by Application 2020 & 2033
- Table 29: Global Digital Solutions for Waste Management Revenue million Forecast, by Types 2020 & 2033
- Table 30: Global Digital Solutions for Waste Management Revenue million Forecast, by Country 2020 & 2033
- Table 31: Turkey Digital Solutions for Waste Management Revenue (million) Forecast, by Application 2020 & 2033
- Table 32: Israel Digital Solutions for Waste Management Revenue (million) Forecast, by Application 2020 & 2033
- Table 33: GCC Digital Solutions for Waste Management Revenue (million) Forecast, by Application 2020 & 2033
- Table 34: North Africa Digital Solutions for Waste Management Revenue (million) Forecast, by Application 2020 & 2033
- Table 35: South Africa Digital Solutions for Waste Management Revenue (million) Forecast, by Application 2020 & 2033
- Table 36: Rest of Middle East & Africa Digital Solutions for Waste Management Revenue (million) Forecast, by Application 2020 & 2033
- Table 37: Global Digital Solutions for Waste Management Revenue million Forecast, by Application 2020 & 2033
- Table 38: Global Digital Solutions for Waste Management Revenue million Forecast, by Types 2020 & 2033
- Table 39: Global Digital Solutions for Waste Management Revenue million Forecast, by Country 2020 & 2033
- Table 40: China Digital Solutions for Waste Management Revenue (million) Forecast, by Application 2020 & 2033
- Table 41: India Digital Solutions for Waste Management Revenue (million) Forecast, by Application 2020 & 2033
- Table 42: Japan Digital Solutions for Waste Management Revenue (million) Forecast, by Application 2020 & 2033
- Table 43: South Korea Digital Solutions for Waste Management Revenue (million) Forecast, by Application 2020 & 2033
- Table 44: ASEAN Digital Solutions for Waste Management Revenue (million) Forecast, by Application 2020 & 2033
- Table 45: Oceania Digital Solutions for Waste Management Revenue (million) Forecast, by Application 2020 & 2033
- Table 46: Rest of Asia Pacific Digital Solutions for Waste Management Revenue (million) Forecast, by Application 2020 & 2033
Frequently Asked Questions
1. What is the projected Compound Annual Growth Rate (CAGR) of the Digital Solutions for Waste Management?
The projected CAGR is approximately XX%.
2. Which companies are prominent players in the Digital Solutions for Waste Management?
Key companies in the market include Veolia, Rubicon, C-trace GmbH, ZenRobotics, ELOGplan, AMCS Group, Contelligent, Bigbelly Solar, AMP Robotics, ISB Global, Evreka, Geminor, Sensoneo, BrighterBins.
3. What are the main segments of the Digital Solutions for Waste Management?
The market segments include Application, Types.
4. Can you provide details about the market size?
The market size is estimated to be USD XXX million as of 2022.
5. What are some drivers contributing to market growth?
N/A
6. What are the notable trends driving market growth?
N/A
7. Are there any restraints impacting market growth?
N/A
8. Can you provide examples of recent developments in the market?
N/A
9. What pricing options are available for accessing the report?
Pricing options include single-user, multi-user, and enterprise licenses priced at USD 2900.00, USD 4350.00, and USD 5800.00 respectively.
10. Is the market size provided in terms of value or volume?
The market size is provided in terms of value, measured in million.
11. Are there any specific market keywords associated with the report?
Yes, the market keyword associated with the report is "Digital Solutions for Waste Management," which aids in identifying and referencing the specific market segment covered.
12. How do I determine which pricing option suits my needs best?
The pricing options vary based on user requirements and access needs. Individual users may opt for single-user licenses, while businesses requiring broader access may choose multi-user or enterprise licenses for cost-effective access to the report.
13. Are there any additional resources or data provided in the Digital Solutions for Waste Management report?
While the report offers comprehensive insights, it's advisable to review the specific contents or supplementary materials provided to ascertain if additional resources or data are available.
14. How can I stay updated on further developments or reports in the Digital Solutions for Waste Management?
To stay informed about further developments, trends, and reports in the Digital Solutions for Waste Management, consider subscribing to industry newsletters, following relevant companies and organizations, or regularly checking reputable industry news sources and publications.
Methodology
Step 1 - Identification of Relevant Samples Size from Population Database


Step 2 - Approaches for Defining Global Market Size (Value, Volume* & Price*)

Note*: In applicable scenarios
Step 3 - Data Sources
Primary Research
- Web Analytics
- Survey Reports
- Research Institute
- Latest Research Reports
- Opinion Leaders
Secondary Research
- Annual Reports
- White Paper
- Latest Press Release
- Industry Association
- Paid Database
- Investor Presentations

Step 4 - Data Triangulation
Involves using different sources of information in order to increase the validity of a study
These sources are likely to be stakeholders in a program - participants, other researchers, program staff, other community members, and so on.
Then we put all data in single framework & apply various statistical tools to find out the dynamic on the market.
During the analysis stage, feedback from the stakeholder groups would be compared to determine areas of agreement as well as areas of divergence