


Key Insights
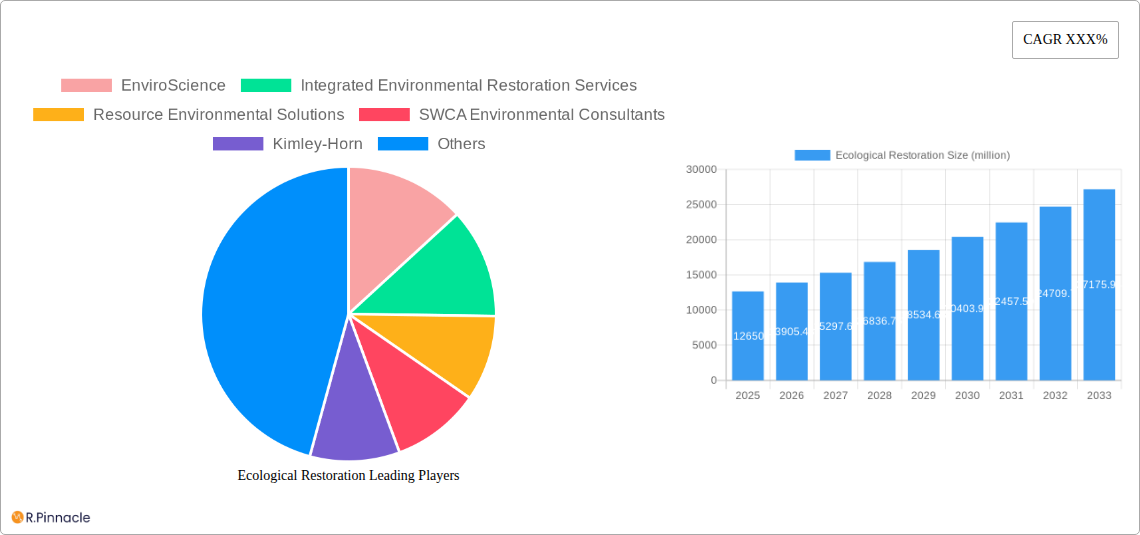
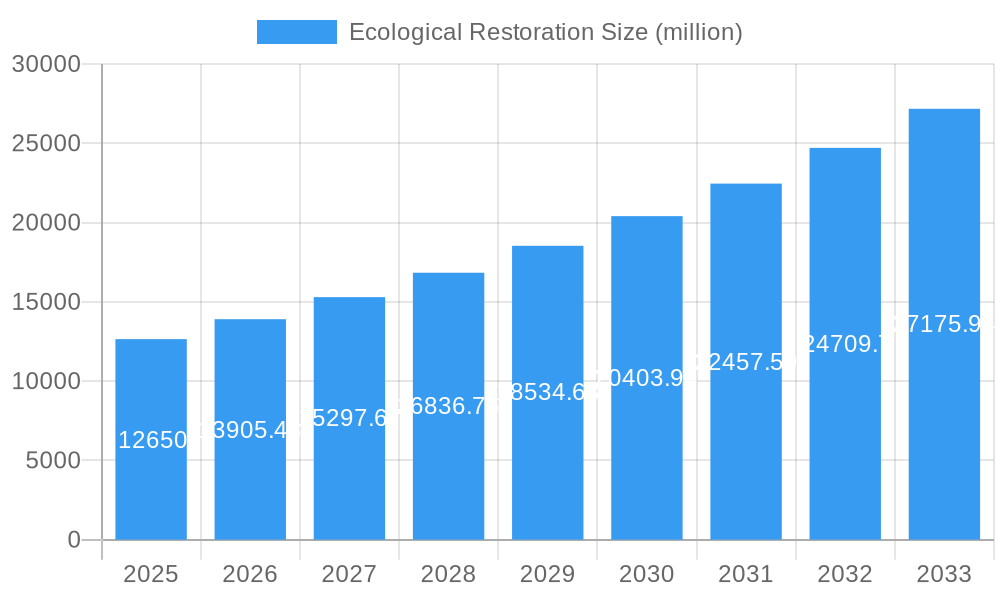
The global ecological restoration market is poised for substantial growth, projected to reach an estimated $12.65 billion by 2025. This expansion is driven by a confluence of factors including increasing environmental awareness, stringent government regulations aimed at mitigating ecological damage, and a growing recognition of the economic and social benefits of healthy ecosystems. The compound annual growth rate (CAGR) of 9.96% over the forecast period (2025-2033) underscores the robust demand for services that aim to repair, rehabilitate, and manage damaged or degraded natural environments. Key applications within this market segment include governmental projects focused on conservation and compliance, and private sector initiatives driven by corporate social responsibility and sustainable development goals. The market is segmented into stream, wetland, and land restoration types, each addressing distinct environmental challenges and offering unique solutions.
Ecological Restoration Market Size (In Billion)

The burgeoning ecological restoration market is fueled by urgent needs to address biodiversity loss, climate change impacts, and the degradation of natural resources. Public entities are actively investing in large-scale projects, while private companies are increasingly integrating ecological considerations into their operations and investments. The diverse range of companies involved, from specialized environmental consultancies to large engineering firms, highlights the multifaceted nature of the industry. Innovations in restoration techniques, such as bio-engineering and the use of native species, are further enhancing the effectiveness and efficiency of these efforts. Despite the positive outlook, challenges such as funding limitations, complex regulatory landscapes, and the need for long-term monitoring and adaptive management strategies will continue to shape the market dynamics. However, the overarching imperative for environmental sustainability and resilience is expected to propel sustained growth across all segments and regions.
Ecological Restoration Company Market Share
This in-depth report delivers an unparalleled analysis of the global ecological restoration market, providing critical insights for industry professionals, investors, and policymakers. Spanning a study period from 2019 to 2033, with a base and estimated year of 2025, this comprehensive resource dissects market structure, dynamics, regional dominance, product innovations, and future outlook. Discover actionable strategies and anticipate evolving trends within this vital sector.
Ecological Restoration Market Structure & Innovation Trends
The ecological restoration market, while experiencing significant growth, currently exhibits a moderately concentrated structure. Key players are investing heavily in research and development to address the escalating demand for sustainable land and water management solutions. Innovation drivers are predominantly fueled by increasing governmental regulations mandating environmental compliance and corporate sustainability initiatives. Product substitutes, such as traditional construction materials and less eco-friendly land management practices, are steadily being phased out as the benefits of ecological restoration become more apparent. End-user demographics are diverse, ranging from government agencies and municipalities to private developers, corporations, and non-profit organizations. Mergers and acquisitions (M&A) activities are on the rise, indicating a consolidation phase and strategic expansion by leading firms. We anticipate M&A deal values to exceed $1.5 billion by 2025, reflecting a robust market consolidation. Key innovation trends include the adoption of advanced geospatial technologies for site assessment, bioengineering techniques for enhanced resilience, and data-driven monitoring systems for long-term success.
Ecological Restoration Market Dynamics & Trends
The global ecological restoration market is poised for substantial expansion, driven by a confluence of powerful factors. A projected Compound Annual Growth Rate (CAGR) of approximately 8.5% over the forecast period of 2025-2033 underscores the sector's robust trajectory. This growth is significantly propelled by heightened awareness of climate change impacts and the urgent need for biodiversity conservation. Governmental initiatives and funding, particularly for stream and wetland restoration projects, represent a major market penetration driver. Technological disruptions are revolutionizing how restoration is planned and executed. Advanced drone technology for surveying, AI-powered predictive modeling for site suitability, and innovative bio-materials are enhancing efficiency and effectiveness. Consumer preferences are increasingly shifting towards sustainable practices, with private customers and corporations actively seeking eco-friendly solutions for their land development and operational footprints. Competitive dynamics are intensifying, with companies differentiating themselves through specialized expertise, technological adoption, and the ability to deliver cost-effective, long-term ecological outcomes. The market penetration for ecological restoration services is estimated to reach 45% by 2033, up from 20% in the historical period of 2019-2024.
Dominant Regions & Segments in Ecological Restoration
North America is currently the dominant region in the ecological restoration market, driven by stringent environmental regulations, significant government funding for infrastructure development and environmental protection, and a strong emphasis on corporate social responsibility. Within North America, the United States leads in terms of market size and activity, with states like California and those along the Gulf Coast spearheading large-scale restoration initiatives.
Key Drivers of Regional Dominance in North America:
- Governmental Customers: Extensive federal and state funding programs for natural resource management, conservation, and disaster recovery projects significantly boost demand.
- Infrastructure Development: Ongoing infrastructure projects, including transportation and energy, often incorporate mandatory ecological restoration components to mitigate environmental impacts.
- Corporate Sustainability Goals: A growing number of corporations are investing in ecological restoration to offset their carbon footprint, enhance their brand image, and meet ESG (Environmental, Social, and Governance) targets.
- Private Customers: Increasing awareness among private landowners and developers about the long-term economic and environmental benefits of well-managed ecosystems.
Dominant Segments:
- Stream Restoration: This segment is a major contributor due to its critical role in water quality improvement, flood control, and habitat preservation for aquatic species. The economic policies promoting watershed health and the infrastructure needs for mitigating erosion and sedimentation are key drivers.
- Wetland Restoration: Wetlands are vital for biodiversity, water filtration, and coastal protection. Growing recognition of their ecological services and increasing regulatory pressures to restore degraded wetland areas contribute to its dominance.
- Land Restoration: This broad category encompasses reforestation, soil remediation, and habitat recovery for terrestrial ecosystems. It is driven by agricultural land management practices, urban development, and the remediation of contaminated sites.
The market size for stream restoration is estimated to reach $75 billion by 2025, while wetland restoration is projected to be $60 billion, and land restoration $55 billion.
Ecological Restoration Product Innovations
Product innovations in ecological restoration are rapidly advancing, focusing on enhancing the efficacy and sustainability of restoration projects. Bio-engineered materials, such as specialized soil amendments and biodegradable erosion control products, are gaining traction, offering superior performance and reduced environmental impact compared to conventional alternatives. Advanced monitoring technologies, including IoT sensors and drone-based imaging, are providing real-time data on ecological health, enabling adaptive management and optimizing project outcomes. These innovations translate into significant competitive advantages for companies that can leverage them to deliver more cost-effective and resilient restoration solutions.
Report Scope & Segmentation Analysis
This report segments the ecological restoration market across two primary dimensions: Application and Type.
Application:
- Governmental Customers: This segment is anticipated to continue its dominance, driven by ongoing public sector investments in environmental protection, infrastructure upgrades, and climate resilience projects. The market size for this segment is projected to reach $120 billion by 2025.
- Private Customers: The private sector is experiencing robust growth, fueled by corporate sustainability mandates, ESG reporting requirements, and increasing demand from developers for eco-friendly land use. Projected market size of $95 billion by 2025.
Type:
- Stream Restoration: This segment is projected to experience substantial growth due to critical needs in water quality, flood mitigation, and aquatic habitat enhancement. Market size estimated at $75 billion by 2025.
- Wetland Restoration: Driven by the crucial ecological services of wetlands, including biodiversity support and water filtration, this segment is set for significant expansion. Market size estimated at $60 billion by 2025.
- Land Restoration: Encompassing reforestation, soil health, and terrestrial habitat recovery, this segment is vital for addressing land degradation and supporting ecological balance. Market size estimated at $55 billion by 2025.
Key Drivers of Ecological Restoration Growth
The ecological restoration sector is propelled by a potent mix of technological advancements, economic incentives, and evolving regulatory frameworks. Technological drivers include the increasing affordability and sophistication of remote sensing, GIS mapping, and AI for site assessment and monitoring. Economically, the growing understanding of the long-term cost savings associated with proactive restoration – such as reduced flood damage and improved water quality – is a significant motivator. Regulatory factors, including stricter environmental protection laws and international climate agreements, mandate restoration efforts and create a consistent demand for services. For instance, the increasing number of endangered species listings directly translates into a need for habitat restoration.
Challenges in the Ecological Restoration Sector
Despite its promising growth, the ecological restoration sector faces several significant challenges. Regulatory hurdles can sometimes be complex and time-consuming, with varying requirements across different jurisdictions. Supply chain issues, particularly for specialized native plant materials and bioengineering components, can impact project timelines and costs. Competitive pressures among service providers are increasing, sometimes leading to price erosion. Furthermore, the long-term success of restoration projects often depends on ongoing monitoring and adaptive management, which can be challenging to secure consistent funding for. These challenges collectively represent a combined market friction estimated at $10 billion annually.
Emerging Opportunities in Ecological Restoration
The ecological restoration market is ripe with emerging opportunities, driven by new market needs and innovative approaches. The growing emphasis on climate change adaptation and resilience is creating demand for nature-based solutions, such as restoring coastal wetlands for storm surge protection and reforesting watersheds to enhance water security. Technological advancements are opening doors to more efficient and data-driven restoration practices, attracting new investors. Furthermore, increasing consumer and corporate demand for sustainable products and services is creating a pull for companies that can demonstrate their commitment to ecological stewardship through robust restoration initiatives. The development of carbon credit markets specifically for ecological restoration projects represents a significant untapped revenue stream.
Leading Players in the Ecological Restoration Market
- EnviroScience
- Integrated Environmental Restoration Services
- Resource Environmental Solutions
- SWCA Environmental Consultants
- Kimley-Horn
- Ecotone
- Ecological Restoration, Inc.
- Madrone Environmental Services
- Litoria
- Conservation Halton
- AES
- Wai-ora Nursery
- Heartland Restoration Services
- Envite Environment
- Ausecology
- Apache Ecological Service
- Adaptive Restoration
- Jacobszoon Forestry
- Polatin Ecological Services
- ENCAP
Key Developments in Ecological Restoration Industry
- 2024 February: Launch of a new AI-powered platform for rapid ecological assessment by SWCA Environmental Consultants, enhancing site analysis efficiency.
- 2023 December: Integrated Environmental Restoration Services acquired a regional competitor, expanding its service footprint in the Pacific Northwest by an estimated $200 million deal value.
- 2023 October: EnviroScience announced a strategic partnership with a leading biomaterials manufacturer to integrate novel erosion control solutions into their restoration projects.
- 2023 July: Kimley-Horn secured a multi-year contract with a major governmental agency for large-scale stream restoration across several states, valued at over $500 million.
- 2022 November: Ecotone led a successful reforestation initiative in a major urban area, demonstrating the viability of ecological restoration in highly developed landscapes.
- 2022 May: Resource Environmental Solutions unveiled a new drone-based monitoring system for wetland health, offering advanced data analytics for adaptive management.
Future Outlook for Ecological Restoration Market
The future outlook for the ecological restoration market is exceptionally positive, driven by an accelerating global imperative for environmental sustainability and biodiversity preservation. Continued growth in governmental and private sector investments, coupled with ongoing technological innovation, will fuel market expansion. The increasing recognition of ecosystem services as a quantifiable economic asset will likely lead to innovative financing mechanisms and market-based instruments, such as carbon offsetting and ecological banking. Strategic opportunities lie in developing specialized restoration techniques for challenging environments, expanding into emerging markets with growing environmental awareness, and fostering greater collaboration across industry stakeholders to address complex ecological challenges. The market is projected to exceed $300 billion by 2033, with a focus on climate resilience and nature-based solutions.
Ecological Restoration Segmentation
-
1. Application
- 1.1. Governmental Customers
- 1.2. Private Customers
-
2. Type
- 2.1. Stream
- 2.2. Wetland
- 2.3. Land
Ecological Restoration Segmentation By Geography
-
1. North America
- 1.1. United States
- 1.2. Canada
- 1.3. Mexico
-
2. South America
- 2.1. Brazil
- 2.2. Argentina
- 2.3. Rest of South America
-
3. Europe
- 3.1. United Kingdom
- 3.2. Germany
- 3.3. France
- 3.4. Italy
- 3.5. Spain
- 3.6. Russia
- 3.7. Benelux
- 3.8. Nordics
- 3.9. Rest of Europe
-
4. Middle East & Africa
- 4.1. Turkey
- 4.2. Israel
- 4.3. GCC
- 4.4. North Africa
- 4.5. South Africa
- 4.6. Rest of Middle East & Africa
-
5. Asia Pacific
- 5.1. China
- 5.2. India
- 5.3. Japan
- 5.4. South Korea
- 5.5. ASEAN
- 5.6. Oceania
- 5.7. Rest of Asia Pacific
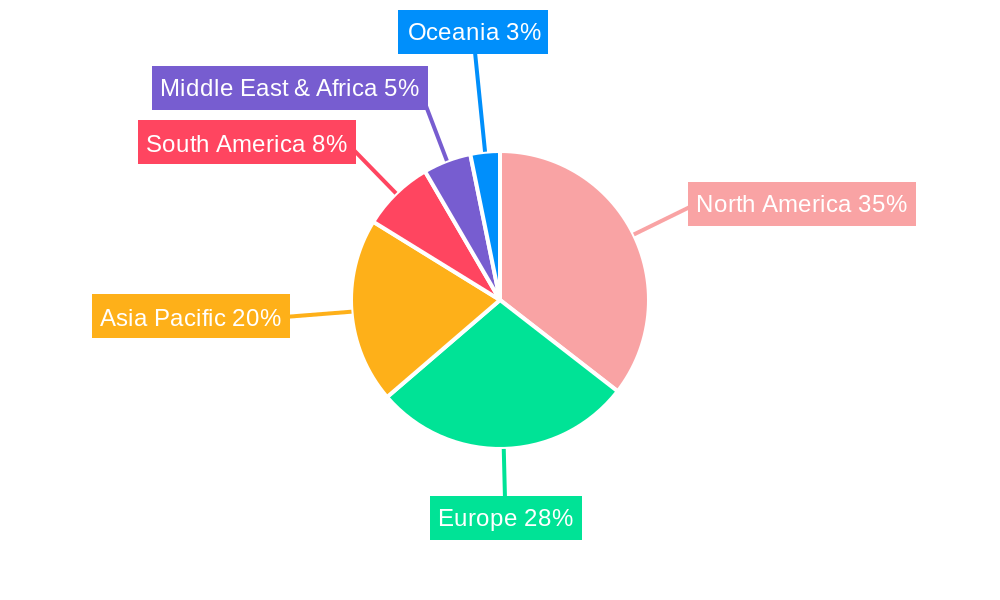
Ecological Restoration Regional Market Share
Geographic Coverage of Ecological Restoration
Ecological Restoration REPORT HIGHLIGHTS
| Aspects | Details |
|---|---|
| Study Period | 2020-2034 |
| Base Year | 2025 |
| Estimated Year | 2026 |
| Forecast Period | 2026-2034 |
| Historical Period | 2020-2025 |
| Growth Rate | CAGR of 8.4% from 2020-2034 |
| Segmentation |
|
Table of Contents
- 1. Introduction
- 1.1. Research Scope
- 1.2. Market Segmentation
- 1.3. Research Objective
- 1.4. Definitions and Assumptions
- 2. Executive Summary
- 2.1. Market Snapshot
- 3. Market Dynamics
- 3.1. Market Drivers
- 3.2. Market Restrains
- 3.3. Market Trends
- 3.4. Market Opportunities
- 4. Market Factor Analysis
- 4.1. Porters Five Forces
- 4.1.1. Bargaining Power of Suppliers
- 4.1.2. Bargaining Power of Buyers
- 4.1.3. Threat of New Entrants
- 4.1.4. Threat of Substitutes
- 4.1.5. Competitive Rivalry
- 4.2. PESTEL analysis
- 4.3. BCG Analysis
- 4.3.1. Stars (High Growth, High Market Share)
- 4.3.2. Cash Cows (Low Growth, High Market Share)
- 4.3.3. Question Mark (High Growth, Low Market Share)
- 4.3.4. Dogs (Low Growth, Low Market Share)
- 4.4. Ansoff Matrix Analysis
- 4.5. Supply Chain Analysis
- 4.6. Regulatory Landscape
- 4.7. Current Market Potential and Opportunity Assessment (TAM–SAM–SOM Framework)
- 4.8. PRI Analyst Note
- 4.1. Porters Five Forces
- 5. Market Analysis, Insights and Forecast 2021-2033
- 5.1. Market Analysis, Insights and Forecast - by Application
- 5.1.1. Governmental Customers
- 5.1.2. Private Customers
- 5.2. Market Analysis, Insights and Forecast - by Type
- 5.2.1. Stream
- 5.2.2. Wetland
- 5.2.3. Land
- 5.3. Market Analysis, Insights and Forecast - by Region
- 5.3.1. North America
- 5.3.2. South America
- 5.3.3. Europe
- 5.3.4. Middle East & Africa
- 5.3.5. Asia Pacific
- 5.1. Market Analysis, Insights and Forecast - by Application
- 6. Global Ecological Restoration Analysis, Insights and Forecast, 2021-2033
- 6.1. Market Analysis, Insights and Forecast - by Application
- 6.1.1. Governmental Customers
- 6.1.2. Private Customers
- 6.2. Market Analysis, Insights and Forecast - by Type
- 6.2.1. Stream
- 6.2.2. Wetland
- 6.2.3. Land
- 6.1. Market Analysis, Insights and Forecast - by Application
- 7. North America Ecological Restoration Analysis, Insights and Forecast, 2020-2032
- 7.1. Market Analysis, Insights and Forecast - by Application
- 7.1.1. Governmental Customers
- 7.1.2. Private Customers
- 7.2. Market Analysis, Insights and Forecast - by Type
- 7.2.1. Stream
- 7.2.2. Wetland
- 7.2.3. Land
- 7.1. Market Analysis, Insights and Forecast - by Application
- 8. South America Ecological Restoration Analysis, Insights and Forecast, 2020-2032
- 8.1. Market Analysis, Insights and Forecast - by Application
- 8.1.1. Governmental Customers
- 8.1.2. Private Customers
- 8.2. Market Analysis, Insights and Forecast - by Type
- 8.2.1. Stream
- 8.2.2. Wetland
- 8.2.3. Land
- 8.1. Market Analysis, Insights and Forecast - by Application
- 9. Europe Ecological Restoration Analysis, Insights and Forecast, 2020-2032
- 9.1. Market Analysis, Insights and Forecast - by Application
- 9.1.1. Governmental Customers
- 9.1.2. Private Customers
- 9.2. Market Analysis, Insights and Forecast - by Type
- 9.2.1. Stream
- 9.2.2. Wetland
- 9.2.3. Land
- 9.1. Market Analysis, Insights and Forecast - by Application
- 10. Middle East & Africa Ecological Restoration Analysis, Insights and Forecast, 2020-2032
- 10.1. Market Analysis, Insights and Forecast - by Application
- 10.1.1. Governmental Customers
- 10.1.2. Private Customers
- 10.2. Market Analysis, Insights and Forecast - by Type
- 10.2.1. Stream
- 10.2.2. Wetland
- 10.2.3. Land
- 10.1. Market Analysis, Insights and Forecast - by Application
- 11. Asia Pacific Ecological Restoration Analysis, Insights and Forecast, 2020-2032
- 11.1. Market Analysis, Insights and Forecast - by Application
- 11.1.1. Governmental Customers
- 11.1.2. Private Customers
- 11.2. Market Analysis, Insights and Forecast - by Type
- 11.2.1. Stream
- 11.2.2. Wetland
- 11.2.3. Land
- 11.1. Market Analysis, Insights and Forecast - by Application
- 12. Competitive Analysis
- 12.1. Company Profiles
- 12.1.1 EnviroScience
- 12.1.1.1. Company Overview
- 12.1.1.2. Products
- 12.1.1.3. Company Financials
- 12.1.1.4. SWOT Analysis
- 12.1.2 Integrated Environmental Restoration Services
- 12.1.2.1. Company Overview
- 12.1.2.2. Products
- 12.1.2.3. Company Financials
- 12.1.2.4. SWOT Analysis
- 12.1.3 Resource Environmental Solutions
- 12.1.3.1. Company Overview
- 12.1.3.2. Products
- 12.1.3.3. Company Financials
- 12.1.3.4. SWOT Analysis
- 12.1.4 SWCA Environmental Consultants
- 12.1.4.1. Company Overview
- 12.1.4.2. Products
- 12.1.4.3. Company Financials
- 12.1.4.4. SWOT Analysis
- 12.1.5 Kimley-Horn
- 12.1.5.1. Company Overview
- 12.1.5.2. Products
- 12.1.5.3. Company Financials
- 12.1.5.4. SWOT Analysis
- 12.1.6 Ecotone
- 12.1.6.1. Company Overview
- 12.1.6.2. Products
- 12.1.6.3. Company Financials
- 12.1.6.4. SWOT Analysis
- 12.1.7 Ecological Restoration Inc.
- 12.1.7.1. Company Overview
- 12.1.7.2. Products
- 12.1.7.3. Company Financials
- 12.1.7.4. SWOT Analysis
- 12.1.8 Madrone Environmental Services
- 12.1.8.1. Company Overview
- 12.1.8.2. Products
- 12.1.8.3. Company Financials
- 12.1.8.4. SWOT Analysis
- 12.1.9 Litoria
- 12.1.9.1. Company Overview
- 12.1.9.2. Products
- 12.1.9.3. Company Financials
- 12.1.9.4. SWOT Analysis
- 12.1.10 Conservation Halton
- 12.1.10.1. Company Overview
- 12.1.10.2. Products
- 12.1.10.3. Company Financials
- 12.1.10.4. SWOT Analysis
- 12.1.11 AES
- 12.1.11.1. Company Overview
- 12.1.11.2. Products
- 12.1.11.3. Company Financials
- 12.1.11.4. SWOT Analysis
- 12.1.12 Wai-ora Nursery
- 12.1.12.1. Company Overview
- 12.1.12.2. Products
- 12.1.12.3. Company Financials
- 12.1.12.4. SWOT Analysis
- 12.1.13 Heartland Restoration Services
- 12.1.13.1. Company Overview
- 12.1.13.2. Products
- 12.1.13.3. Company Financials
- 12.1.13.4. SWOT Analysis
- 12.1.14 Envite Environment
- 12.1.14.1. Company Overview
- 12.1.14.2. Products
- 12.1.14.3. Company Financials
- 12.1.14.4. SWOT Analysis
- 12.1.15 Ausecology
- 12.1.15.1. Company Overview
- 12.1.15.2. Products
- 12.1.15.3. Company Financials
- 12.1.15.4. SWOT Analysis
- 12.1.16 Apache Ecological Service
- 12.1.16.1. Company Overview
- 12.1.16.2. Products
- 12.1.16.3. Company Financials
- 12.1.16.4. SWOT Analysis
- 12.1.17 Adaptive Restoration
- 12.1.17.1. Company Overview
- 12.1.17.2. Products
- 12.1.17.3. Company Financials
- 12.1.17.4. SWOT Analysis
- 12.1.18 Jacobszoon Forestry
- 12.1.18.1. Company Overview
- 12.1.18.2. Products
- 12.1.18.3. Company Financials
- 12.1.18.4. SWOT Analysis
- 12.1.19 Polatin Ecological Services
- 12.1.19.1. Company Overview
- 12.1.19.2. Products
- 12.1.19.3. Company Financials
- 12.1.19.4. SWOT Analysis
- 12.1.20 ENCAP
- 12.1.20.1. Company Overview
- 12.1.20.2. Products
- 12.1.20.3. Company Financials
- 12.1.20.4. SWOT Analysis
- 12.1.1 EnviroScience
- 12.2. Market Entropy
- 12.2.1 Company's Key Areas Served
- 12.2.2 Recent Developments
- 12.3. Company Market Share Analysis 2025
- 12.3.1 Top 5 Companies Market Share Analysis
- 12.3.2 Top 3 Companies Market Share Analysis
- 12.4. List of Potential Customers
- 13. Research Methodology
List of Figures
- Figure 1: Global Ecological Restoration Revenue Breakdown (billion, %) by Region 2025 & 2033
- Figure 2: North America Ecological Restoration Revenue (billion), by Application 2025 & 2033
- Figure 3: North America Ecological Restoration Revenue Share (%), by Application 2025 & 2033
- Figure 4: North America Ecological Restoration Revenue (billion), by Type 2025 & 2033
- Figure 5: North America Ecological Restoration Revenue Share (%), by Type 2025 & 2033
- Figure 6: North America Ecological Restoration Revenue (billion), by Country 2025 & 2033
- Figure 7: North America Ecological Restoration Revenue Share (%), by Country 2025 & 2033
- Figure 8: South America Ecological Restoration Revenue (billion), by Application 2025 & 2033
- Figure 9: South America Ecological Restoration Revenue Share (%), by Application 2025 & 2033
- Figure 10: South America Ecological Restoration Revenue (billion), by Type 2025 & 2033
- Figure 11: South America Ecological Restoration Revenue Share (%), by Type 2025 & 2033
- Figure 12: South America Ecological Restoration Revenue (billion), by Country 2025 & 2033
- Figure 13: South America Ecological Restoration Revenue Share (%), by Country 2025 & 2033
- Figure 14: Europe Ecological Restoration Revenue (billion), by Application 2025 & 2033
- Figure 15: Europe Ecological Restoration Revenue Share (%), by Application 2025 & 2033
- Figure 16: Europe Ecological Restoration Revenue (billion), by Type 2025 & 2033
- Figure 17: Europe Ecological Restoration Revenue Share (%), by Type 2025 & 2033
- Figure 18: Europe Ecological Restoration Revenue (billion), by Country 2025 & 2033
- Figure 19: Europe Ecological Restoration Revenue Share (%), by Country 2025 & 2033
- Figure 20: Middle East & Africa Ecological Restoration Revenue (billion), by Application 2025 & 2033
- Figure 21: Middle East & Africa Ecological Restoration Revenue Share (%), by Application 2025 & 2033
- Figure 22: Middle East & Africa Ecological Restoration Revenue (billion), by Type 2025 & 2033
- Figure 23: Middle East & Africa Ecological Restoration Revenue Share (%), by Type 2025 & 2033
- Figure 24: Middle East & Africa Ecological Restoration Revenue (billion), by Country 2025 & 2033
- Figure 25: Middle East & Africa Ecological Restoration Revenue Share (%), by Country 2025 & 2033
- Figure 26: Asia Pacific Ecological Restoration Revenue (billion), by Application 2025 & 2033
- Figure 27: Asia Pacific Ecological Restoration Revenue Share (%), by Application 2025 & 2033
- Figure 28: Asia Pacific Ecological Restoration Revenue (billion), by Type 2025 & 2033
- Figure 29: Asia Pacific Ecological Restoration Revenue Share (%), by Type 2025 & 2033
- Figure 30: Asia Pacific Ecological Restoration Revenue (billion), by Country 2025 & 2033
- Figure 31: Asia Pacific Ecological Restoration Revenue Share (%), by Country 2025 & 2033
List of Tables
- Table 1: Global Ecological Restoration Revenue billion Forecast, by Application 2020 & 2033
- Table 2: Global Ecological Restoration Revenue billion Forecast, by Type 2020 & 2033
- Table 3: Global Ecological Restoration Revenue billion Forecast, by Region 2020 & 2033
- Table 4: Global Ecological Restoration Revenue billion Forecast, by Application 2020 & 2033
- Table 5: Global Ecological Restoration Revenue billion Forecast, by Type 2020 & 2033
- Table 6: Global Ecological Restoration Revenue billion Forecast, by Country 2020 & 2033
- Table 7: United States Ecological Restoration Revenue (billion) Forecast, by Application 2020 & 2033
- Table 8: Canada Ecological Restoration Revenue (billion) Forecast, by Application 2020 & 2033
- Table 9: Mexico Ecological Restoration Revenue (billion) Forecast, by Application 2020 & 2033
- Table 10: Global Ecological Restoration Revenue billion Forecast, by Application 2020 & 2033
- Table 11: Global Ecological Restoration Revenue billion Forecast, by Type 2020 & 2033
- Table 12: Global Ecological Restoration Revenue billion Forecast, by Country 2020 & 2033
- Table 13: Brazil Ecological Restoration Revenue (billion) Forecast, by Application 2020 & 2033
- Table 14: Argentina Ecological Restoration Revenue (billion) Forecast, by Application 2020 & 2033
- Table 15: Rest of South America Ecological Restoration Revenue (billion) Forecast, by Application 2020 & 2033
- Table 16: Global Ecological Restoration Revenue billion Forecast, by Application 2020 & 2033
- Table 17: Global Ecological Restoration Revenue billion Forecast, by Type 2020 & 2033
- Table 18: Global Ecological Restoration Revenue billion Forecast, by Country 2020 & 2033
- Table 19: United Kingdom Ecological Restoration Revenue (billion) Forecast, by Application 2020 & 2033
- Table 20: Germany Ecological Restoration Revenue (billion) Forecast, by Application 2020 & 2033
- Table 21: France Ecological Restoration Revenue (billion) Forecast, by Application 2020 & 2033
- Table 22: Italy Ecological Restoration Revenue (billion) Forecast, by Application 2020 & 2033
- Table 23: Spain Ecological Restoration Revenue (billion) Forecast, by Application 2020 & 2033
- Table 24: Russia Ecological Restoration Revenue (billion) Forecast, by Application 2020 & 2033
- Table 25: Benelux Ecological Restoration Revenue (billion) Forecast, by Application 2020 & 2033
- Table 26: Nordics Ecological Restoration Revenue (billion) Forecast, by Application 2020 & 2033
- Table 27: Rest of Europe Ecological Restoration Revenue (billion) Forecast, by Application 2020 & 2033
- Table 28: Global Ecological Restoration Revenue billion Forecast, by Application 2020 & 2033
- Table 29: Global Ecological Restoration Revenue billion Forecast, by Type 2020 & 2033
- Table 30: Global Ecological Restoration Revenue billion Forecast, by Country 2020 & 2033
- Table 31: Turkey Ecological Restoration Revenue (billion) Forecast, by Application 2020 & 2033
- Table 32: Israel Ecological Restoration Revenue (billion) Forecast, by Application 2020 & 2033
- Table 33: GCC Ecological Restoration Revenue (billion) Forecast, by Application 2020 & 2033
- Table 34: North Africa Ecological Restoration Revenue (billion) Forecast, by Application 2020 & 2033
- Table 35: South Africa Ecological Restoration Revenue (billion) Forecast, by Application 2020 & 2033
- Table 36: Rest of Middle East & Africa Ecological Restoration Revenue (billion) Forecast, by Application 2020 & 2033
- Table 37: Global Ecological Restoration Revenue billion Forecast, by Application 2020 & 2033
- Table 38: Global Ecological Restoration Revenue billion Forecast, by Type 2020 & 2033
- Table 39: Global Ecological Restoration Revenue billion Forecast, by Country 2020 & 2033
- Table 40: China Ecological Restoration Revenue (billion) Forecast, by Application 2020 & 2033
- Table 41: India Ecological Restoration Revenue (billion) Forecast, by Application 2020 & 2033
- Table 42: Japan Ecological Restoration Revenue (billion) Forecast, by Application 2020 & 2033
- Table 43: South Korea Ecological Restoration Revenue (billion) Forecast, by Application 2020 & 2033
- Table 44: ASEAN Ecological Restoration Revenue (billion) Forecast, by Application 2020 & 2033
- Table 45: Oceania Ecological Restoration Revenue (billion) Forecast, by Application 2020 & 2033
- Table 46: Rest of Asia Pacific Ecological Restoration Revenue (billion) Forecast, by Application 2020 & 2033
Frequently Asked Questions
1. What is the projected Compound Annual Growth Rate (CAGR) of the Ecological Restoration?
The projected CAGR is approximately 8.4%.
2. Which companies are prominent players in the Ecological Restoration?
Key companies in the market include EnviroScience, Integrated Environmental Restoration Services, Resource Environmental Solutions, SWCA Environmental Consultants, Kimley-Horn, Ecotone, Ecological Restoration, Inc., Madrone Environmental Services, Litoria, Conservation Halton, AES, Wai-ora Nursery, Heartland Restoration Services, Envite Environment, Ausecology, Apache Ecological Service, Adaptive Restoration, Jacobszoon Forestry, Polatin Ecological Services, ENCAP.
3. What are the main segments of the Ecological Restoration?
The market segments include Application, Type.
4. Can you provide details about the market size?
The market size is estimated to be USD 13.8 billion as of 2022.
5. What are some drivers contributing to market growth?
N/A
6. What are the notable trends driving market growth?
N/A
7. Are there any restraints impacting market growth?
N/A
8. Can you provide examples of recent developments in the market?
N/A
9. What pricing options are available for accessing the report?
Pricing options include single-user, multi-user, and enterprise licenses priced at USD 2900.00, USD 4350.00, and USD 5800.00 respectively.
10. Is the market size provided in terms of value or volume?
The market size is provided in terms of value, measured in billion.
11. Are there any specific market keywords associated with the report?
Yes, the market keyword associated with the report is "Ecological Restoration," which aids in identifying and referencing the specific market segment covered.
12. How do I determine which pricing option suits my needs best?
The pricing options vary based on user requirements and access needs. Individual users may opt for single-user licenses, while businesses requiring broader access may choose multi-user or enterprise licenses for cost-effective access to the report.
13. Are there any additional resources or data provided in the Ecological Restoration report?
While the report offers comprehensive insights, it's advisable to review the specific contents or supplementary materials provided to ascertain if additional resources or data are available.
14. How can I stay updated on further developments or reports in the Ecological Restoration?
To stay informed about further developments, trends, and reports in the Ecological Restoration, consider subscribing to industry newsletters, following relevant companies and organizations, or regularly checking reputable industry news sources and publications.
Methodology
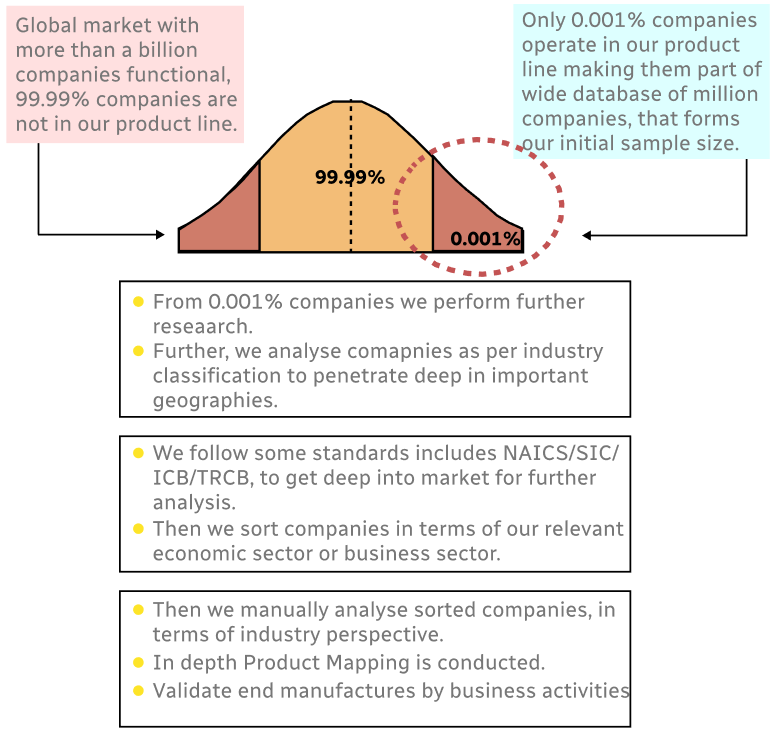
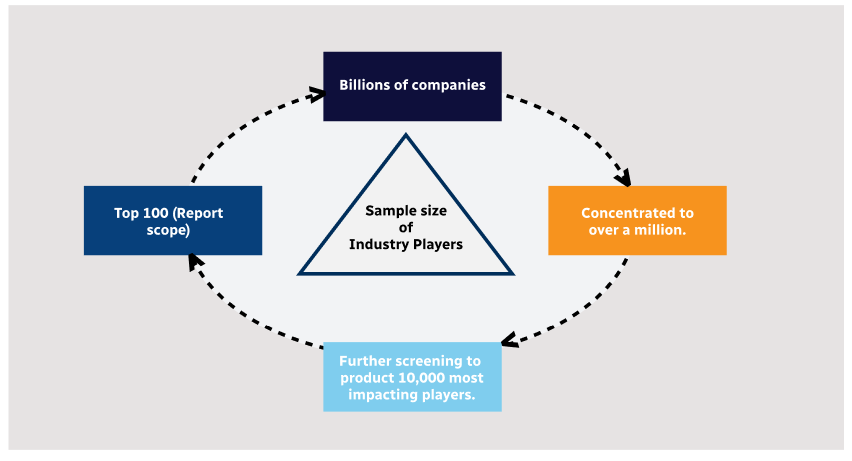
Step 1 - Identification of Relevant Samples Size from Population Database
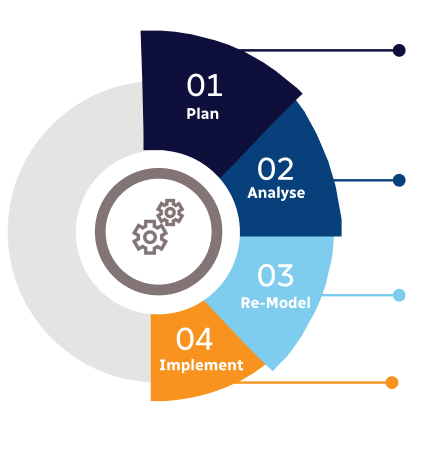
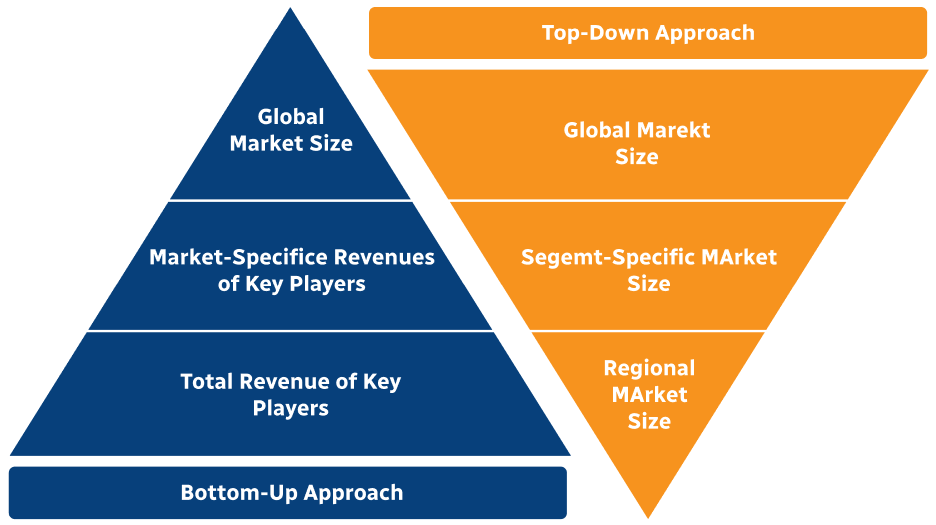
Step 2 - Approaches for Defining Global Market Size (Value, Volume* & Price*)
Note*: In applicable scenarios
Step 3 - Data Sources
Primary Research
- Web Analytics
- Survey Reports
- Research Institute
- Latest Research Reports
- Opinion Leaders
Secondary Research
- Annual Reports
- White Paper
- Latest Press Release
- Industry Association
- Paid Database
- Investor Presentations
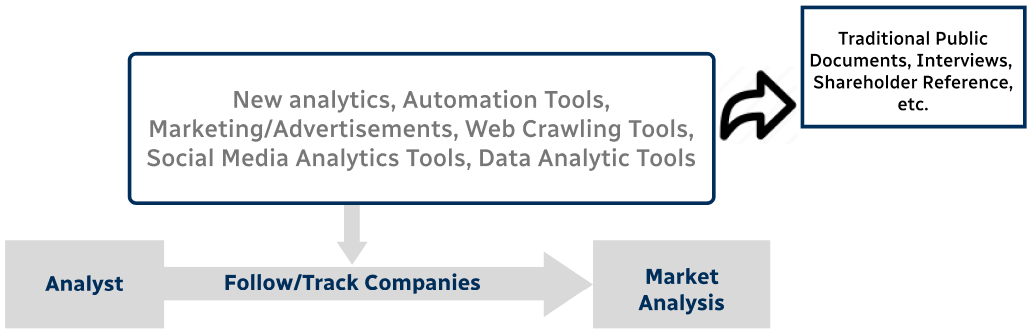
Step 4 - Data Triangulation
Involves using different sources of information in order to increase the validity of a study
These sources are likely to be stakeholders in a program - participants, other researchers, program staff, other community members, and so on.
Then we put all data in single framework & apply various statistical tools to find out the dynamic on the market.
During the analysis stage, feedback from the stakeholder groups would be compared to determine areas of agreement as well as areas of divergence