
Key Insights
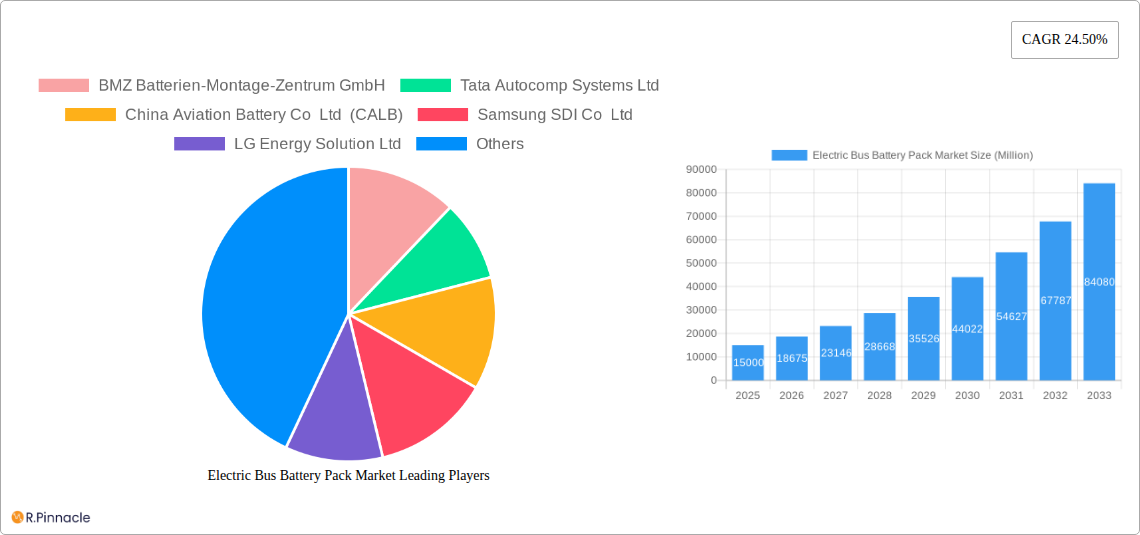
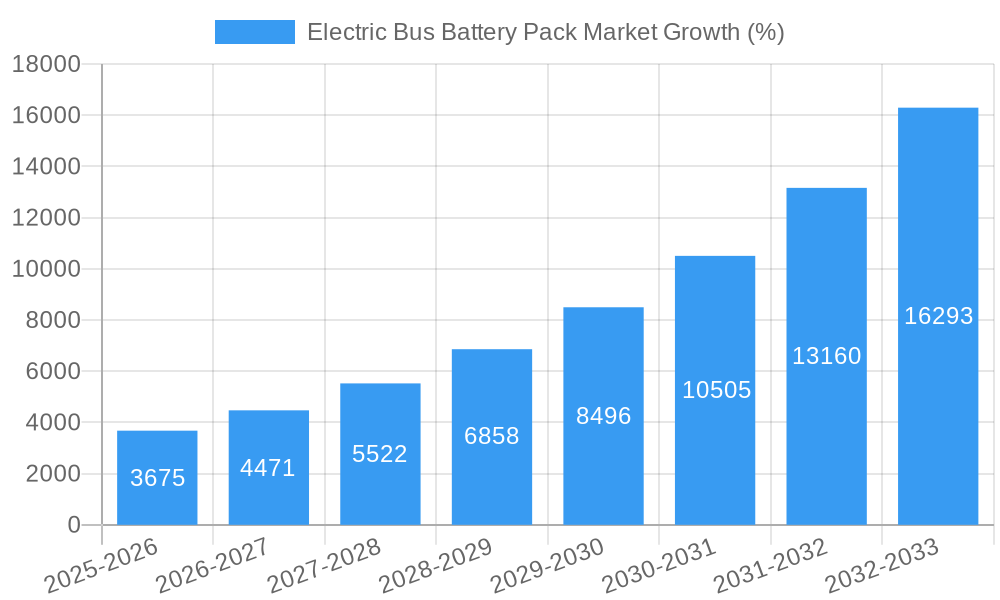
The electric bus battery pack market is experiencing robust growth, driven by the global push for sustainable transportation and stringent emission regulations. The market's Compound Annual Growth Rate (CAGR) of 24.50% from 2019 to 2024 indicates significant expansion, projected to continue through 2033. This growth is fueled by increasing demand for electric buses in both developed and developing nations, alongside advancements in battery technology leading to higher energy density, longer lifespan, and improved safety. Key market segments include cylindrical, pouch, and prismatic battery forms, with laser and wire connection methods dominating. Material composition significantly impacts performance and cost, with lithium, cobalt, nickel, and manganese-based chemistries prevalent. Battery capacity preferences vary across regions and operational needs, ranging from less than 15 kWh to above 80 kWh, catering to diverse bus sizes and routes. The market is highly competitive, with key players such as CATL, BYD, LG Energy Solution, and Samsung SDI leading in innovation and market share. The shift towards longer-range electric buses and improved charging infrastructure further enhances market prospects. Different battery chemistries like LFP (Lithium Iron Phosphate), NCA (Nickel Cobalt Aluminum), NCM (Nickel Cobalt Manganese), and NMC (Nickel Manganese Cobalt) cater to various performance and cost requirements. The market is segmented by propulsion type (BEV, PHEV), reflecting the diverse electrification strategies adopted by bus manufacturers.
The continued expansion of the electric bus battery pack market relies on several factors. Government incentives, subsidies, and investments in public transportation infrastructure are vital for accelerating adoption. Technological advancements, particularly in fast-charging capabilities and improved battery management systems, will also be key drivers. Overcoming challenges like high initial costs, limited battery lifespan, and the need for robust charging infrastructure remains crucial for sustained market growth. The geographical distribution of the market is likely influenced by factors such as the level of government support, the maturity of the electric vehicle infrastructure, and the specific regulations in place. A thorough understanding of these regional variations is crucial for both manufacturers and investors aiming to navigate this dynamic and expanding market effectively.
This in-depth report provides a comprehensive analysis of the Electric Bus Battery Pack Market, offering valuable insights for industry professionals, investors, and strategic decision-makers. The study period covers 2019-2033, with 2025 as the base and estimated year, and a forecast period of 2025-2033. The historical period analyzed is 2019-2024. This report encompasses detailed segmentation, competitive landscape analysis, and future growth projections, empowering you to navigate the complexities of this rapidly evolving market. The market is valued at xx Million in 2025 and is projected to reach xx Million by 2033, exhibiting a CAGR of xx%.
Electric Bus Battery Pack Market Structure & Innovation Trends
The Electric Bus Battery Pack market exhibits a moderately concentrated structure, with key players like CATL, BYD, and Samsung SDI holding significant market share. However, the market is characterized by intense competition, driven by continuous innovation in battery chemistry, cell design, and pack integration. The market is also influenced by stringent government regulations promoting electric mobility and the increasing demand for sustainable transportation solutions. Product substitution is minimal, with the focus primarily on improving existing technologies rather than replacing them entirely. End-user demographics are shifting towards larger fleets and public transportation systems, especially in urban and metropolitan areas.
- Market Concentration: CATL and BYD hold a combined market share of approximately xx%, while Samsung SDI holds approximately xx%.
- Innovation Drivers: Demand for higher energy density, longer lifespan, faster charging times, and improved safety features are driving innovation.
- Regulatory Frameworks: Government incentives and emission regulations are significantly impacting market growth.
- M&A Activities: The past five years have witnessed xx M&A deals, with an average deal value of xx Million. These activities primarily focus on securing supply chains and expanding production capacities.
Electric Bus Battery Pack Market Dynamics & Trends
The Electric Bus Battery Pack market is experiencing robust growth, fueled by several key factors. The increasing adoption of electric buses globally is a primary driver, alongside government initiatives promoting sustainable transportation and reducing carbon emissions. Technological advancements, such as the development of high-energy-density batteries and improved battery management systems, are also contributing to market expansion. Consumer preferences are shifting towards environmentally friendly public transportation, boosting demand. However, price sensitivity and concerns about battery lifespan remain challenges. The competitive landscape is characterized by intense rivalry among established players and emerging entrants, leading to continuous innovation and price competition. The market penetration rate for electric buses is currently at xx% and is projected to reach xx% by 2033.
Dominant Regions & Segments in Electric Bus Battery Pack Market
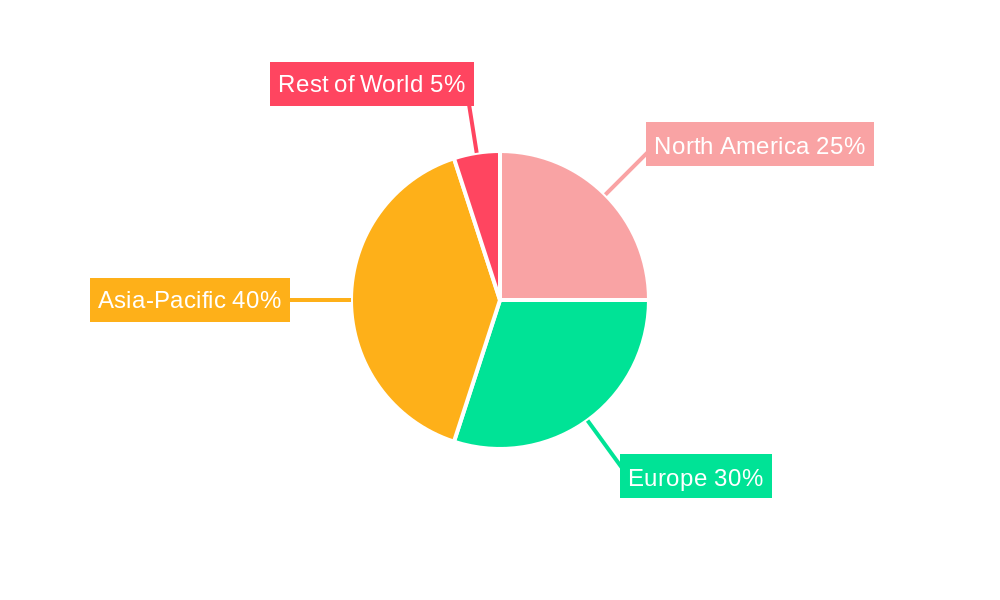
The Asia-Pacific region currently dominates the Electric Bus Battery Pack market, driven by strong government support for electric vehicle adoption in countries like China and India. Europe and North America are also experiencing significant growth, albeit at a slower pace.
Key Drivers:
- Asia-Pacific: Large-scale government subsidies, expanding infrastructure, and a growing population in urban areas.
- Europe: Stringent emission regulations, supportive policies, and increasing environmental awareness.
- North America: Growing investments in public transportation and initiatives to reduce greenhouse gas emissions.
Dominant Segments:
- Battery Form: Prismatic batteries currently hold the largest market share due to their high energy density and suitability for electric bus applications.
- Method: Wire bonding dominates the market due to its cost-effectiveness and reliability.
- Component: Cathode materials are a significant segment due to their impact on battery performance.
- Material Type: Lithium-ion batteries are dominant due to their high energy density.
- Propulsion Type: Battery Electric Vehicles (BEVs) dominate the market due to their zero-emission characteristic.
- Battery Chemistry: LFP and NMC chemistries are the leading battery chemistries due to their cost-effectiveness and performance balance.
- Capacity: The 40 kWh to 80 kWh capacity segment is currently the largest, catering to the majority of electric bus applications.
Electric Bus Battery Pack Market Product Innovations
Recent innovations focus on improving energy density, reducing costs, enhancing safety features, and extending battery lifespan. These advancements are crucial for making electric buses more competitive and appealing to consumers and operators. New battery chemistries and cell designs are constantly being developed to meet the evolving demands of the market, with a strong emphasis on fast-charging capabilities and extended range. This ongoing innovation ensures market fit and enhances the competitive landscape.
Report Scope & Segmentation Analysis
This report segments the Electric Bus Battery Pack market across various parameters: battery form (cylindrical, pouch, prismatic), assembly method (laser, wire), components (anode, cathode, electrolyte, separator), material type (cobalt, lithium, manganese, natural graphite, nickel, other materials), propulsion type (BEV, PHEV), battery chemistry (LFP, NCA, NCM, NMC, others), and capacity (less than 15 kWh, 15 kWh to 40 kWh, 40 kWh to 80 kWh, above 80 kWh). Each segment's growth projections, market size, and competitive dynamics are thoroughly analyzed.
Key Drivers of Electric Bus Battery Pack Market Growth
Several factors are driving the growth of the Electric Bus Battery Pack market, including government regulations promoting electric vehicles, the rising demand for sustainable transportation, and technological advancements leading to improved battery performance and reduced costs. Furthermore, increasing urbanization and the need for efficient public transportation systems are also boosting demand. Specific examples include the EU's stricter emission standards and China's significant investments in electric bus infrastructure.
Challenges in the Electric Bus Battery Pack Market Sector
The Electric Bus Battery Pack market faces several challenges, including the high initial cost of electric buses, concerns about battery lifespan and degradation, the availability of charging infrastructure, and the supply chain complexities associated with battery raw materials. These factors can significantly impact the overall market growth and adoption rate. The impact of raw material price volatility on the final product cost is a noteworthy challenge.
Emerging Opportunities in Electric Bus Battery Pack Market
Emerging opportunities lie in the development of next-generation battery technologies, such as solid-state batteries, which offer higher energy density and improved safety features. Expansion into new markets, particularly in developing countries with rapidly growing urban populations, also presents significant potential. Furthermore, advancements in battery management systems and charging infrastructure are expected to unlock new growth avenues.
Leading Players in the Electric Bus Battery Pack Market Market
- BMZ Batterien-Montage-Zentrum GmbH
- Tata Autocomp Systems Ltd
- China Aviation Battery Co Ltd (CALB)
- Samsung SDI Co Ltd
- LG Energy Solution Ltd
- Guoxuan High-tech Co Ltd
- Farasis Energy (Ganzhou) Co Ltd
- Gotion High-Tech Co Ltd
- TOSHIBA Corp
- Contemporary Amperex Technology Co Ltd (CATL)
- NFI Group Inc
- Leclanché SA
- BYD Company Ltd
- Sunwoda Electric Vehicle Battery Co Ltd (Sunwoda)
- Proterra Operating Company Inc
- Panasonic Holdings Corporation
Key Developments in Electric Bus Battery Pack Market Industry
- November 2022: Samsung SDI partnered with Sungkyunkwan University to develop battery technology expertise.
- January 2023: Samsung SDI reported record-high profits in 2022 due to strong EV battery demand.
- February 2023: Samsung SDI expanded its Hungary plant to meet the increasing demand for mid- to large-size batteries.
Future Outlook for Electric Bus Battery Pack Market Market
The future outlook for the Electric Bus Battery Pack market is positive, driven by continued technological advancements, supportive government policies, and the growing demand for sustainable transportation solutions. Strategic partnerships, investments in R&D, and expansion into new markets will be crucial for companies to capitalize on the significant growth opportunities in this sector. The market is poised for substantial expansion, particularly in regions with ambitious electrification targets.
Electric Bus Battery Pack Market Segmentation
-
1. Propulsion Type
- 1.1. BEV
- 1.2. PHEV
-
2. Battery Chemistry
- 2.1. LFP
- 2.2. NCA
- 2.3. NCM
- 2.4. NMC
- 2.5. Others
-
3. Capacity
- 3.1. 15 kWh to 40 kWh
- 3.2. 40 kWh to 80 kWh
- 3.3. Above 80 kWh
- 3.4. Less than 15 kWh
-
4. Battery Form
- 4.1. Cylindrical
- 4.2. Pouch
- 4.3. Prismatic
-
5. Method
- 5.1. Laser
- 5.2. Wire
-
6. Component
- 6.1. Anode
- 6.2. Cathode
- 6.3. Electrolyte
- 6.4. Separator
-
7. Material Type
- 7.1. Cobalt
- 7.2. Lithium
- 7.3. Manganese
- 7.4. Natural Graphite
- 7.5. Nickel
- 7.6. Other Materials
Electric Bus Battery Pack Market Segmentation By Geography
-
1. North America
- 1.1. United States
- 1.2. Canada
- 1.3. Mexico
-
2. South America
- 2.1. Brazil
- 2.2. Argentina
- 2.3. Rest of South America
-
3. Europe
- 3.1. United Kingdom
- 3.2. Germany
- 3.3. France
- 3.4. Italy
- 3.5. Spain
- 3.6. Russia
- 3.7. Benelux
- 3.8. Nordics
- 3.9. Rest of Europe
-
4. Middle East & Africa
- 4.1. Turkey
- 4.2. Israel
- 4.3. GCC
- 4.4. North Africa
- 4.5. South Africa
- 4.6. Rest of Middle East & Africa
-
5. Asia Pacific
- 5.1. China
- 5.2. India
- 5.3. Japan
- 5.4. South Korea
- 5.5. ASEAN
- 5.6. Oceania
- 5.7. Rest of Asia Pacific
Electric Bus Battery Pack Market REPORT HIGHLIGHTS
| Aspects | Details |
|---|---|
| Study Period | 2019-2033 |
| Base Year | 2024 |
| Estimated Year | 2025 |
| Forecast Period | 2025-2033 |
| Historical Period | 2019-2024 |
| Growth Rate | CAGR of 24.50% from 2019-2033 |
| Segmentation |
|
Table of Contents
- 1. Introduction
- 1.1. Research Scope
- 1.2. Market Segmentation
- 1.3. Research Methodology
- 1.4. Definitions and Assumptions
- 2. Executive Summary
- 2.1. Introduction
- 3. Market Dynamics
- 3.1. Introduction
- 3.2. Market Drivers
- 3.2.1. Exponential Increase in Automotive Sector
- 3.3. Market Restrains
- 3.3.1. Digitization of R&D Operations in Automotive Sector
- 3.4. Market Trends
- 3.4.1. OTHER KEY INDUSTRY TRENDS COVERED IN THE REPORT
- 4. Market Factor Analysis
- 4.1. Porters Five Forces
- 4.2. Supply/Value Chain
- 4.3. PESTEL analysis
- 4.4. Market Entropy
- 4.5. Patent/Trademark Analysis
- 5. Global Electric Bus Battery Pack Market Analysis, Insights and Forecast, 2019-2031
- 5.1. Market Analysis, Insights and Forecast - by Propulsion Type
- 5.1.1. BEV
- 5.1.2. PHEV
- 5.2. Market Analysis, Insights and Forecast - by Battery Chemistry
- 5.2.1. LFP
- 5.2.2. NCA
- 5.2.3. NCM
- 5.2.4. NMC
- 5.2.5. Others
- 5.3. Market Analysis, Insights and Forecast - by Capacity
- 5.3.1. 15 kWh to 40 kWh
- 5.3.2. 40 kWh to 80 kWh
- 5.3.3. Above 80 kWh
- 5.3.4. Less than 15 kWh
- 5.4. Market Analysis, Insights and Forecast - by Battery Form
- 5.4.1. Cylindrical
- 5.4.2. Pouch
- 5.4.3. Prismatic
- 5.5. Market Analysis, Insights and Forecast - by Method
- 5.5.1. Laser
- 5.5.2. Wire
- 5.6. Market Analysis, Insights and Forecast - by Component
- 5.6.1. Anode
- 5.6.2. Cathode
- 5.6.3. Electrolyte
- 5.6.4. Separator
- 5.7. Market Analysis, Insights and Forecast - by Material Type
- 5.7.1. Cobalt
- 5.7.2. Lithium
- 5.7.3. Manganese
- 5.7.4. Natural Graphite
- 5.7.5. Nickel
- 5.7.6. Other Materials
- 5.8. Market Analysis, Insights and Forecast - by Region
- 5.8.1. North America
- 5.8.2. South America
- 5.8.3. Europe
- 5.8.4. Middle East & Africa
- 5.8.5. Asia Pacific
- 5.1. Market Analysis, Insights and Forecast - by Propulsion Type
- 6. North America Electric Bus Battery Pack Market Analysis, Insights and Forecast, 2019-2031
- 6.1. Market Analysis, Insights and Forecast - by Propulsion Type
- 6.1.1. BEV
- 6.1.2. PHEV
- 6.2. Market Analysis, Insights and Forecast - by Battery Chemistry
- 6.2.1. LFP
- 6.2.2. NCA
- 6.2.3. NCM
- 6.2.4. NMC
- 6.2.5. Others
- 6.3. Market Analysis, Insights and Forecast - by Capacity
- 6.3.1. 15 kWh to 40 kWh
- 6.3.2. 40 kWh to 80 kWh
- 6.3.3. Above 80 kWh
- 6.3.4. Less than 15 kWh
- 6.4. Market Analysis, Insights and Forecast - by Battery Form
- 6.4.1. Cylindrical
- 6.4.2. Pouch
- 6.4.3. Prismatic
- 6.5. Market Analysis, Insights and Forecast - by Method
- 6.5.1. Laser
- 6.5.2. Wire
- 6.6. Market Analysis, Insights and Forecast - by Component
- 6.6.1. Anode
- 6.6.2. Cathode
- 6.6.3. Electrolyte
- 6.6.4. Separator
- 6.7. Market Analysis, Insights and Forecast - by Material Type
- 6.7.1. Cobalt
- 6.7.2. Lithium
- 6.7.3. Manganese
- 6.7.4. Natural Graphite
- 6.7.5. Nickel
- 6.7.6. Other Materials
- 6.1. Market Analysis, Insights and Forecast - by Propulsion Type
- 7. South America Electric Bus Battery Pack Market Analysis, Insights and Forecast, 2019-2031
- 7.1. Market Analysis, Insights and Forecast - by Propulsion Type
- 7.1.1. BEV
- 7.1.2. PHEV
- 7.2. Market Analysis, Insights and Forecast - by Battery Chemistry
- 7.2.1. LFP
- 7.2.2. NCA
- 7.2.3. NCM
- 7.2.4. NMC
- 7.2.5. Others
- 7.3. Market Analysis, Insights and Forecast - by Capacity
- 7.3.1. 15 kWh to 40 kWh
- 7.3.2. 40 kWh to 80 kWh
- 7.3.3. Above 80 kWh
- 7.3.4. Less than 15 kWh
- 7.4. Market Analysis, Insights and Forecast - by Battery Form
- 7.4.1. Cylindrical
- 7.4.2. Pouch
- 7.4.3. Prismatic
- 7.5. Market Analysis, Insights and Forecast - by Method
- 7.5.1. Laser
- 7.5.2. Wire
- 7.6. Market Analysis, Insights and Forecast - by Component
- 7.6.1. Anode
- 7.6.2. Cathode
- 7.6.3. Electrolyte
- 7.6.4. Separator
- 7.7. Market Analysis, Insights and Forecast - by Material Type
- 7.7.1. Cobalt
- 7.7.2. Lithium
- 7.7.3. Manganese
- 7.7.4. Natural Graphite
- 7.7.5. Nickel
- 7.7.6. Other Materials
- 7.1. Market Analysis, Insights and Forecast - by Propulsion Type
- 8. Europe Electric Bus Battery Pack Market Analysis, Insights and Forecast, 2019-2031
- 8.1. Market Analysis, Insights and Forecast - by Propulsion Type
- 8.1.1. BEV
- 8.1.2. PHEV
- 8.2. Market Analysis, Insights and Forecast - by Battery Chemistry
- 8.2.1. LFP
- 8.2.2. NCA
- 8.2.3. NCM
- 8.2.4. NMC
- 8.2.5. Others
- 8.3. Market Analysis, Insights and Forecast - by Capacity
- 8.3.1. 15 kWh to 40 kWh
- 8.3.2. 40 kWh to 80 kWh
- 8.3.3. Above 80 kWh
- 8.3.4. Less than 15 kWh
- 8.4. Market Analysis, Insights and Forecast - by Battery Form
- 8.4.1. Cylindrical
- 8.4.2. Pouch
- 8.4.3. Prismatic
- 8.5. Market Analysis, Insights and Forecast - by Method
- 8.5.1. Laser
- 8.5.2. Wire
- 8.6. Market Analysis, Insights and Forecast - by Component
- 8.6.1. Anode
- 8.6.2. Cathode
- 8.6.3. Electrolyte
- 8.6.4. Separator
- 8.7. Market Analysis, Insights and Forecast - by Material Type
- 8.7.1. Cobalt
- 8.7.2. Lithium
- 8.7.3. Manganese
- 8.7.4. Natural Graphite
- 8.7.5. Nickel
- 8.7.6. Other Materials
- 8.1. Market Analysis, Insights and Forecast - by Propulsion Type
- 9. Middle East & Africa Electric Bus Battery Pack Market Analysis, Insights and Forecast, 2019-2031
- 9.1. Market Analysis, Insights and Forecast - by Propulsion Type
- 9.1.1. BEV
- 9.1.2. PHEV
- 9.2. Market Analysis, Insights and Forecast - by Battery Chemistry
- 9.2.1. LFP
- 9.2.2. NCA
- 9.2.3. NCM
- 9.2.4. NMC
- 9.2.5. Others
- 9.3. Market Analysis, Insights and Forecast - by Capacity
- 9.3.1. 15 kWh to 40 kWh
- 9.3.2. 40 kWh to 80 kWh
- 9.3.3. Above 80 kWh
- 9.3.4. Less than 15 kWh
- 9.4. Market Analysis, Insights and Forecast - by Battery Form
- 9.4.1. Cylindrical
- 9.4.2. Pouch
- 9.4.3. Prismatic
- 9.5. Market Analysis, Insights and Forecast - by Method
- 9.5.1. Laser
- 9.5.2. Wire
- 9.6. Market Analysis, Insights and Forecast - by Component
- 9.6.1. Anode
- 9.6.2. Cathode
- 9.6.3. Electrolyte
- 9.6.4. Separator
- 9.7. Market Analysis, Insights and Forecast - by Material Type
- 9.7.1. Cobalt
- 9.7.2. Lithium
- 9.7.3. Manganese
- 9.7.4. Natural Graphite
- 9.7.5. Nickel
- 9.7.6. Other Materials
- 9.1. Market Analysis, Insights and Forecast - by Propulsion Type
- 10. Asia Pacific Electric Bus Battery Pack Market Analysis, Insights and Forecast, 2019-2031
- 10.1. Market Analysis, Insights and Forecast - by Propulsion Type
- 10.1.1. BEV
- 10.1.2. PHEV
- 10.2. Market Analysis, Insights and Forecast - by Battery Chemistry
- 10.2.1. LFP
- 10.2.2. NCA
- 10.2.3. NCM
- 10.2.4. NMC
- 10.2.5. Others
- 10.3. Market Analysis, Insights and Forecast - by Capacity
- 10.3.1. 15 kWh to 40 kWh
- 10.3.2. 40 kWh to 80 kWh
- 10.3.3. Above 80 kWh
- 10.3.4. Less than 15 kWh
- 10.4. Market Analysis, Insights and Forecast - by Battery Form
- 10.4.1. Cylindrical
- 10.4.2. Pouch
- 10.4.3. Prismatic
- 10.5. Market Analysis, Insights and Forecast - by Method
- 10.5.1. Laser
- 10.5.2. Wire
- 10.6. Market Analysis, Insights and Forecast - by Component
- 10.6.1. Anode
- 10.6.2. Cathode
- 10.6.3. Electrolyte
- 10.6.4. Separator
- 10.7. Market Analysis, Insights and Forecast - by Material Type
- 10.7.1. Cobalt
- 10.7.2. Lithium
- 10.7.3. Manganese
- 10.7.4. Natural Graphite
- 10.7.5. Nickel
- 10.7.6. Other Materials
- 10.1. Market Analysis, Insights and Forecast - by Propulsion Type
- 11. Competitive Analysis
- 11.1. Global Market Share Analysis 2024
- 11.2. Company Profiles
- 11.2.1 BMZ Batterien-Montage-Zentrum GmbH
- 11.2.1.1. Overview
- 11.2.1.2. Products
- 11.2.1.3. SWOT Analysis
- 11.2.1.4. Recent Developments
- 11.2.1.5. Financials (Based on Availability)
- 11.2.2 Tata Autocomp Systems Ltd
- 11.2.2.1. Overview
- 11.2.2.2. Products
- 11.2.2.3. SWOT Analysis
- 11.2.2.4. Recent Developments
- 11.2.2.5. Financials (Based on Availability)
- 11.2.3 China Aviation Battery Co Ltd (CALB)
- 11.2.3.1. Overview
- 11.2.3.2. Products
- 11.2.3.3. SWOT Analysis
- 11.2.3.4. Recent Developments
- 11.2.3.5. Financials (Based on Availability)
- 11.2.4 Samsung SDI Co Ltd
- 11.2.4.1. Overview
- 11.2.4.2. Products
- 11.2.4.3. SWOT Analysis
- 11.2.4.4. Recent Developments
- 11.2.4.5. Financials (Based on Availability)
- 11.2.5 LG Energy Solution Ltd
- 11.2.5.1. Overview
- 11.2.5.2. Products
- 11.2.5.3. SWOT Analysis
- 11.2.5.4. Recent Developments
- 11.2.5.5. Financials (Based on Availability)
- 11.2.6 Guoxuan High-tech Co Ltd
- 11.2.6.1. Overview
- 11.2.6.2. Products
- 11.2.6.3. SWOT Analysis
- 11.2.6.4. Recent Developments
- 11.2.6.5. Financials (Based on Availability)
- 11.2.7 Farasis Energy (Ganzhou) Co Ltd
- 11.2.7.1. Overview
- 11.2.7.2. Products
- 11.2.7.3. SWOT Analysis
- 11.2.7.4. Recent Developments
- 11.2.7.5. Financials (Based on Availability)
- 11.2.8 Gotion High-Tech Co Ltd
- 11.2.8.1. Overview
- 11.2.8.2. Products
- 11.2.8.3. SWOT Analysis
- 11.2.8.4. Recent Developments
- 11.2.8.5. Financials (Based on Availability)
- 11.2.9 TOSHIBA Corp
- 11.2.9.1. Overview
- 11.2.9.2. Products
- 11.2.9.3. SWOT Analysis
- 11.2.9.4. Recent Developments
- 11.2.9.5. Financials (Based on Availability)
- 11.2.10 Contemporary Amperex Technology Co Ltd (CATL)
- 11.2.10.1. Overview
- 11.2.10.2. Products
- 11.2.10.3. SWOT Analysis
- 11.2.10.4. Recent Developments
- 11.2.10.5. Financials (Based on Availability)
- 11.2.11 NFI Group Inc
- 11.2.11.1. Overview
- 11.2.11.2. Products
- 11.2.11.3. SWOT Analysis
- 11.2.11.4. Recent Developments
- 11.2.11.5. Financials (Based on Availability)
- 11.2.12 Leclanché SA
- 11.2.12.1. Overview
- 11.2.12.2. Products
- 11.2.12.3. SWOT Analysis
- 11.2.12.4. Recent Developments
- 11.2.12.5. Financials (Based on Availability)
- 11.2.13 BYD Company Ltd
- 11.2.13.1. Overview
- 11.2.13.2. Products
- 11.2.13.3. SWOT Analysis
- 11.2.13.4. Recent Developments
- 11.2.13.5. Financials (Based on Availability)
- 11.2.14 Sunwoda Electric Vehicle Battery Co Ltd (Sunwoda)
- 11.2.14.1. Overview
- 11.2.14.2. Products
- 11.2.14.3. SWOT Analysis
- 11.2.14.4. Recent Developments
- 11.2.14.5. Financials (Based on Availability)
- 11.2.15 Proterra Operating Company Inc
- 11.2.15.1. Overview
- 11.2.15.2. Products
- 11.2.15.3. SWOT Analysis
- 11.2.15.4. Recent Developments
- 11.2.15.5. Financials (Based on Availability)
- 11.2.16 Panasonic Holdings Corporation
- 11.2.16.1. Overview
- 11.2.16.2. Products
- 11.2.16.3. SWOT Analysis
- 11.2.16.4. Recent Developments
- 11.2.16.5. Financials (Based on Availability)
- 11.2.1 BMZ Batterien-Montage-Zentrum GmbH
List of Figures
- Figure 1: Global Electric Bus Battery Pack Market Revenue Breakdown (Million, %) by Region 2024 & 2032
- Figure 2: North America Electric Bus Battery Pack Market Revenue (Million), by Propulsion Type 2024 & 2032
- Figure 3: North America Electric Bus Battery Pack Market Revenue Share (%), by Propulsion Type 2024 & 2032
- Figure 4: North America Electric Bus Battery Pack Market Revenue (Million), by Battery Chemistry 2024 & 2032
- Figure 5: North America Electric Bus Battery Pack Market Revenue Share (%), by Battery Chemistry 2024 & 2032
- Figure 6: North America Electric Bus Battery Pack Market Revenue (Million), by Capacity 2024 & 2032
- Figure 7: North America Electric Bus Battery Pack Market Revenue Share (%), by Capacity 2024 & 2032
- Figure 8: North America Electric Bus Battery Pack Market Revenue (Million), by Battery Form 2024 & 2032
- Figure 9: North America Electric Bus Battery Pack Market Revenue Share (%), by Battery Form 2024 & 2032
- Figure 10: North America Electric Bus Battery Pack Market Revenue (Million), by Method 2024 & 2032
- Figure 11: North America Electric Bus Battery Pack Market Revenue Share (%), by Method 2024 & 2032
- Figure 12: North America Electric Bus Battery Pack Market Revenue (Million), by Component 2024 & 2032
- Figure 13: North America Electric Bus Battery Pack Market Revenue Share (%), by Component 2024 & 2032
- Figure 14: North America Electric Bus Battery Pack Market Revenue (Million), by Material Type 2024 & 2032
- Figure 15: North America Electric Bus Battery Pack Market Revenue Share (%), by Material Type 2024 & 2032
- Figure 16: North America Electric Bus Battery Pack Market Revenue (Million), by Country 2024 & 2032
- Figure 17: North America Electric Bus Battery Pack Market Revenue Share (%), by Country 2024 & 2032
- Figure 18: South America Electric Bus Battery Pack Market Revenue (Million), by Propulsion Type 2024 & 2032
- Figure 19: South America Electric Bus Battery Pack Market Revenue Share (%), by Propulsion Type 2024 & 2032
- Figure 20: South America Electric Bus Battery Pack Market Revenue (Million), by Battery Chemistry 2024 & 2032
- Figure 21: South America Electric Bus Battery Pack Market Revenue Share (%), by Battery Chemistry 2024 & 2032
- Figure 22: South America Electric Bus Battery Pack Market Revenue (Million), by Capacity 2024 & 2032
- Figure 23: South America Electric Bus Battery Pack Market Revenue Share (%), by Capacity 2024 & 2032
- Figure 24: South America Electric Bus Battery Pack Market Revenue (Million), by Battery Form 2024 & 2032
- Figure 25: South America Electric Bus Battery Pack Market Revenue Share (%), by Battery Form 2024 & 2032
- Figure 26: South America Electric Bus Battery Pack Market Revenue (Million), by Method 2024 & 2032
- Figure 27: South America Electric Bus Battery Pack Market Revenue Share (%), by Method 2024 & 2032
- Figure 28: South America Electric Bus Battery Pack Market Revenue (Million), by Component 2024 & 2032
- Figure 29: South America Electric Bus Battery Pack Market Revenue Share (%), by Component 2024 & 2032
- Figure 30: South America Electric Bus Battery Pack Market Revenue (Million), by Material Type 2024 & 2032
- Figure 31: South America Electric Bus Battery Pack Market Revenue Share (%), by Material Type 2024 & 2032
- Figure 32: South America Electric Bus Battery Pack Market Revenue (Million), by Country 2024 & 2032
- Figure 33: South America Electric Bus Battery Pack Market Revenue Share (%), by Country 2024 & 2032
- Figure 34: Europe Electric Bus Battery Pack Market Revenue (Million), by Propulsion Type 2024 & 2032
- Figure 35: Europe Electric Bus Battery Pack Market Revenue Share (%), by Propulsion Type 2024 & 2032
- Figure 36: Europe Electric Bus Battery Pack Market Revenue (Million), by Battery Chemistry 2024 & 2032
- Figure 37: Europe Electric Bus Battery Pack Market Revenue Share (%), by Battery Chemistry 2024 & 2032
- Figure 38: Europe Electric Bus Battery Pack Market Revenue (Million), by Capacity 2024 & 2032
- Figure 39: Europe Electric Bus Battery Pack Market Revenue Share (%), by Capacity 2024 & 2032
- Figure 40: Europe Electric Bus Battery Pack Market Revenue (Million), by Battery Form 2024 & 2032
- Figure 41: Europe Electric Bus Battery Pack Market Revenue Share (%), by Battery Form 2024 & 2032
- Figure 42: Europe Electric Bus Battery Pack Market Revenue (Million), by Method 2024 & 2032
- Figure 43: Europe Electric Bus Battery Pack Market Revenue Share (%), by Method 2024 & 2032
- Figure 44: Europe Electric Bus Battery Pack Market Revenue (Million), by Component 2024 & 2032
- Figure 45: Europe Electric Bus Battery Pack Market Revenue Share (%), by Component 2024 & 2032
- Figure 46: Europe Electric Bus Battery Pack Market Revenue (Million), by Material Type 2024 & 2032
- Figure 47: Europe Electric Bus Battery Pack Market Revenue Share (%), by Material Type 2024 & 2032
- Figure 48: Europe Electric Bus Battery Pack Market Revenue (Million), by Country 2024 & 2032
- Figure 49: Europe Electric Bus Battery Pack Market Revenue Share (%), by Country 2024 & 2032
- Figure 50: Middle East & Africa Electric Bus Battery Pack Market Revenue (Million), by Propulsion Type 2024 & 2032
- Figure 51: Middle East & Africa Electric Bus Battery Pack Market Revenue Share (%), by Propulsion Type 2024 & 2032
- Figure 52: Middle East & Africa Electric Bus Battery Pack Market Revenue (Million), by Battery Chemistry 2024 & 2032
- Figure 53: Middle East & Africa Electric Bus Battery Pack Market Revenue Share (%), by Battery Chemistry 2024 & 2032
- Figure 54: Middle East & Africa Electric Bus Battery Pack Market Revenue (Million), by Capacity 2024 & 2032
- Figure 55: Middle East & Africa Electric Bus Battery Pack Market Revenue Share (%), by Capacity 2024 & 2032
- Figure 56: Middle East & Africa Electric Bus Battery Pack Market Revenue (Million), by Battery Form 2024 & 2032
- Figure 57: Middle East & Africa Electric Bus Battery Pack Market Revenue Share (%), by Battery Form 2024 & 2032
- Figure 58: Middle East & Africa Electric Bus Battery Pack Market Revenue (Million), by Method 2024 & 2032
- Figure 59: Middle East & Africa Electric Bus Battery Pack Market Revenue Share (%), by Method 2024 & 2032
- Figure 60: Middle East & Africa Electric Bus Battery Pack Market Revenue (Million), by Component 2024 & 2032
- Figure 61: Middle East & Africa Electric Bus Battery Pack Market Revenue Share (%), by Component 2024 & 2032
- Figure 62: Middle East & Africa Electric Bus Battery Pack Market Revenue (Million), by Material Type 2024 & 2032
- Figure 63: Middle East & Africa Electric Bus Battery Pack Market Revenue Share (%), by Material Type 2024 & 2032
- Figure 64: Middle East & Africa Electric Bus Battery Pack Market Revenue (Million), by Country 2024 & 2032
- Figure 65: Middle East & Africa Electric Bus Battery Pack Market Revenue Share (%), by Country 2024 & 2032
- Figure 66: Asia Pacific Electric Bus Battery Pack Market Revenue (Million), by Propulsion Type 2024 & 2032
- Figure 67: Asia Pacific Electric Bus Battery Pack Market Revenue Share (%), by Propulsion Type 2024 & 2032
- Figure 68: Asia Pacific Electric Bus Battery Pack Market Revenue (Million), by Battery Chemistry 2024 & 2032
- Figure 69: Asia Pacific Electric Bus Battery Pack Market Revenue Share (%), by Battery Chemistry 2024 & 2032
- Figure 70: Asia Pacific Electric Bus Battery Pack Market Revenue (Million), by Capacity 2024 & 2032
- Figure 71: Asia Pacific Electric Bus Battery Pack Market Revenue Share (%), by Capacity 2024 & 2032
- Figure 72: Asia Pacific Electric Bus Battery Pack Market Revenue (Million), by Battery Form 2024 & 2032
- Figure 73: Asia Pacific Electric Bus Battery Pack Market Revenue Share (%), by Battery Form 2024 & 2032
- Figure 74: Asia Pacific Electric Bus Battery Pack Market Revenue (Million), by Method 2024 & 2032
- Figure 75: Asia Pacific Electric Bus Battery Pack Market Revenue Share (%), by Method 2024 & 2032
- Figure 76: Asia Pacific Electric Bus Battery Pack Market Revenue (Million), by Component 2024 & 2032
- Figure 77: Asia Pacific Electric Bus Battery Pack Market Revenue Share (%), by Component 2024 & 2032
- Figure 78: Asia Pacific Electric Bus Battery Pack Market Revenue (Million), by Material Type 2024 & 2032
- Figure 79: Asia Pacific Electric Bus Battery Pack Market Revenue Share (%), by Material Type 2024 & 2032
- Figure 80: Asia Pacific Electric Bus Battery Pack Market Revenue (Million), by Country 2024 & 2032
- Figure 81: Asia Pacific Electric Bus Battery Pack Market Revenue Share (%), by Country 2024 & 2032
List of Tables
- Table 1: Global Electric Bus Battery Pack Market Revenue Million Forecast, by Region 2019 & 2032
- Table 2: Global Electric Bus Battery Pack Market Revenue Million Forecast, by Propulsion Type 2019 & 2032
- Table 3: Global Electric Bus Battery Pack Market Revenue Million Forecast, by Battery Chemistry 2019 & 2032
- Table 4: Global Electric Bus Battery Pack Market Revenue Million Forecast, by Capacity 2019 & 2032
- Table 5: Global Electric Bus Battery Pack Market Revenue Million Forecast, by Battery Form 2019 & 2032
- Table 6: Global Electric Bus Battery Pack Market Revenue Million Forecast, by Method 2019 & 2032
- Table 7: Global Electric Bus Battery Pack Market Revenue Million Forecast, by Component 2019 & 2032
- Table 8: Global Electric Bus Battery Pack Market Revenue Million Forecast, by Material Type 2019 & 2032
- Table 9: Global Electric Bus Battery Pack Market Revenue Million Forecast, by Region 2019 & 2032
- Table 10: Global Electric Bus Battery Pack Market Revenue Million Forecast, by Propulsion Type 2019 & 2032
- Table 11: Global Electric Bus Battery Pack Market Revenue Million Forecast, by Battery Chemistry 2019 & 2032
- Table 12: Global Electric Bus Battery Pack Market Revenue Million Forecast, by Capacity 2019 & 2032
- Table 13: Global Electric Bus Battery Pack Market Revenue Million Forecast, by Battery Form 2019 & 2032
- Table 14: Global Electric Bus Battery Pack Market Revenue Million Forecast, by Method 2019 & 2032
- Table 15: Global Electric Bus Battery Pack Market Revenue Million Forecast, by Component 2019 & 2032
- Table 16: Global Electric Bus Battery Pack Market Revenue Million Forecast, by Material Type 2019 & 2032
- Table 17: Global Electric Bus Battery Pack Market Revenue Million Forecast, by Country 2019 & 2032
- Table 18: United States Electric Bus Battery Pack Market Revenue (Million) Forecast, by Application 2019 & 2032
- Table 19: Canada Electric Bus Battery Pack Market Revenue (Million) Forecast, by Application 2019 & 2032
- Table 20: Mexico Electric Bus Battery Pack Market Revenue (Million) Forecast, by Application 2019 & 2032
- Table 21: Global Electric Bus Battery Pack Market Revenue Million Forecast, by Propulsion Type 2019 & 2032
- Table 22: Global Electric Bus Battery Pack Market Revenue Million Forecast, by Battery Chemistry 2019 & 2032
- Table 23: Global Electric Bus Battery Pack Market Revenue Million Forecast, by Capacity 2019 & 2032
- Table 24: Global Electric Bus Battery Pack Market Revenue Million Forecast, by Battery Form 2019 & 2032
- Table 25: Global Electric Bus Battery Pack Market Revenue Million Forecast, by Method 2019 & 2032
- Table 26: Global Electric Bus Battery Pack Market Revenue Million Forecast, by Component 2019 & 2032
- Table 27: Global Electric Bus Battery Pack Market Revenue Million Forecast, by Material Type 2019 & 2032
- Table 28: Global Electric Bus Battery Pack Market Revenue Million Forecast, by Country 2019 & 2032
- Table 29: Brazil Electric Bus Battery Pack Market Revenue (Million) Forecast, by Application 2019 & 2032
- Table 30: Argentina Electric Bus Battery Pack Market Revenue (Million) Forecast, by Application 2019 & 2032
- Table 31: Rest of South America Electric Bus Battery Pack Market Revenue (Million) Forecast, by Application 2019 & 2032
- Table 32: Global Electric Bus Battery Pack Market Revenue Million Forecast, by Propulsion Type 2019 & 2032
- Table 33: Global Electric Bus Battery Pack Market Revenue Million Forecast, by Battery Chemistry 2019 & 2032
- Table 34: Global Electric Bus Battery Pack Market Revenue Million Forecast, by Capacity 2019 & 2032
- Table 35: Global Electric Bus Battery Pack Market Revenue Million Forecast, by Battery Form 2019 & 2032
- Table 36: Global Electric Bus Battery Pack Market Revenue Million Forecast, by Method 2019 & 2032
- Table 37: Global Electric Bus Battery Pack Market Revenue Million Forecast, by Component 2019 & 2032
- Table 38: Global Electric Bus Battery Pack Market Revenue Million Forecast, by Material Type 2019 & 2032
- Table 39: Global Electric Bus Battery Pack Market Revenue Million Forecast, by Country 2019 & 2032
- Table 40: United Kingdom Electric Bus Battery Pack Market Revenue (Million) Forecast, by Application 2019 & 2032
- Table 41: Germany Electric Bus Battery Pack Market Revenue (Million) Forecast, by Application 2019 & 2032
- Table 42: France Electric Bus Battery Pack Market Revenue (Million) Forecast, by Application 2019 & 2032
- Table 43: Italy Electric Bus Battery Pack Market Revenue (Million) Forecast, by Application 2019 & 2032
- Table 44: Spain Electric Bus Battery Pack Market Revenue (Million) Forecast, by Application 2019 & 2032
- Table 45: Russia Electric Bus Battery Pack Market Revenue (Million) Forecast, by Application 2019 & 2032
- Table 46: Benelux Electric Bus Battery Pack Market Revenue (Million) Forecast, by Application 2019 & 2032
- Table 47: Nordics Electric Bus Battery Pack Market Revenue (Million) Forecast, by Application 2019 & 2032
- Table 48: Rest of Europe Electric Bus Battery Pack Market Revenue (Million) Forecast, by Application 2019 & 2032
- Table 49: Global Electric Bus Battery Pack Market Revenue Million Forecast, by Propulsion Type 2019 & 2032
- Table 50: Global Electric Bus Battery Pack Market Revenue Million Forecast, by Battery Chemistry 2019 & 2032
- Table 51: Global Electric Bus Battery Pack Market Revenue Million Forecast, by Capacity 2019 & 2032
- Table 52: Global Electric Bus Battery Pack Market Revenue Million Forecast, by Battery Form 2019 & 2032
- Table 53: Global Electric Bus Battery Pack Market Revenue Million Forecast, by Method 2019 & 2032
- Table 54: Global Electric Bus Battery Pack Market Revenue Million Forecast, by Component 2019 & 2032
- Table 55: Global Electric Bus Battery Pack Market Revenue Million Forecast, by Material Type 2019 & 2032
- Table 56: Global Electric Bus Battery Pack Market Revenue Million Forecast, by Country 2019 & 2032
- Table 57: Turkey Electric Bus Battery Pack Market Revenue (Million) Forecast, by Application 2019 & 2032
- Table 58: Israel Electric Bus Battery Pack Market Revenue (Million) Forecast, by Application 2019 & 2032
- Table 59: GCC Electric Bus Battery Pack Market Revenue (Million) Forecast, by Application 2019 & 2032
- Table 60: North Africa Electric Bus Battery Pack Market Revenue (Million) Forecast, by Application 2019 & 2032
- Table 61: South Africa Electric Bus Battery Pack Market Revenue (Million) Forecast, by Application 2019 & 2032
- Table 62: Rest of Middle East & Africa Electric Bus Battery Pack Market Revenue (Million) Forecast, by Application 2019 & 2032
- Table 63: Global Electric Bus Battery Pack Market Revenue Million Forecast, by Propulsion Type 2019 & 2032
- Table 64: Global Electric Bus Battery Pack Market Revenue Million Forecast, by Battery Chemistry 2019 & 2032
- Table 65: Global Electric Bus Battery Pack Market Revenue Million Forecast, by Capacity 2019 & 2032
- Table 66: Global Electric Bus Battery Pack Market Revenue Million Forecast, by Battery Form 2019 & 2032
- Table 67: Global Electric Bus Battery Pack Market Revenue Million Forecast, by Method 2019 & 2032
- Table 68: Global Electric Bus Battery Pack Market Revenue Million Forecast, by Component 2019 & 2032
- Table 69: Global Electric Bus Battery Pack Market Revenue Million Forecast, by Material Type 2019 & 2032
- Table 70: Global Electric Bus Battery Pack Market Revenue Million Forecast, by Country 2019 & 2032
- Table 71: China Electric Bus Battery Pack Market Revenue (Million) Forecast, by Application 2019 & 2032
- Table 72: India Electric Bus Battery Pack Market Revenue (Million) Forecast, by Application 2019 & 2032
- Table 73: Japan Electric Bus Battery Pack Market Revenue (Million) Forecast, by Application 2019 & 2032
- Table 74: South Korea Electric Bus Battery Pack Market Revenue (Million) Forecast, by Application 2019 & 2032
- Table 75: ASEAN Electric Bus Battery Pack Market Revenue (Million) Forecast, by Application 2019 & 2032
- Table 76: Oceania Electric Bus Battery Pack Market Revenue (Million) Forecast, by Application 2019 & 2032
- Table 77: Rest of Asia Pacific Electric Bus Battery Pack Market Revenue (Million) Forecast, by Application 2019 & 2032
Frequently Asked Questions
1. What is the projected Compound Annual Growth Rate (CAGR) of the Electric Bus Battery Pack Market?
The projected CAGR is approximately 24.50%.
2. Which companies are prominent players in the Electric Bus Battery Pack Market?
Key companies in the market include BMZ Batterien-Montage-Zentrum GmbH, Tata Autocomp Systems Ltd, China Aviation Battery Co Ltd (CALB), Samsung SDI Co Ltd, LG Energy Solution Ltd, Guoxuan High-tech Co Ltd, Farasis Energy (Ganzhou) Co Ltd, Gotion High-Tech Co Ltd, TOSHIBA Corp, Contemporary Amperex Technology Co Ltd (CATL), NFI Group Inc, Leclanché SA, BYD Company Ltd, Sunwoda Electric Vehicle Battery Co Ltd (Sunwoda), Proterra Operating Company Inc, Panasonic Holdings Corporation.
3. What are the main segments of the Electric Bus Battery Pack Market?
The market segments include Propulsion Type, Battery Chemistry, Capacity, Battery Form, Method, Component, Material Type.
4. Can you provide details about the market size?
The market size is estimated to be USD XX Million as of 2022.
5. What are some drivers contributing to market growth?
Exponential Increase in Automotive Sector.
6. What are the notable trends driving market growth?
OTHER KEY INDUSTRY TRENDS COVERED IN THE REPORT.
7. Are there any restraints impacting market growth?
Digitization of R&D Operations in Automotive Sector.
8. Can you provide examples of recent developments in the market?
February 2023: Samsung SDI is expanding investment in its Hungary plant, which has the largest production capacity to respond to the fast-increasing demand for mid- to large-size batteries.January 2023: Korean battery maker Samsung SDI posted record-high profit in 2022, driven by solid demand for electric vehicle batteries and energy storage systems.November 2022: Samsung SDI has signed an agreement with Sungkyunkwan University to establish a course for battery technologies to raise battery experts.
9. What pricing options are available for accessing the report?
Pricing options include single-user, multi-user, and enterprise licenses priced at USD 3800, USD 4500, and USD 5800 respectively.
10. Is the market size provided in terms of value or volume?
The market size is provided in terms of value, measured in Million.
11. Are there any specific market keywords associated with the report?
Yes, the market keyword associated with the report is "Electric Bus Battery Pack Market," which aids in identifying and referencing the specific market segment covered.
12. How do I determine which pricing option suits my needs best?
The pricing options vary based on user requirements and access needs. Individual users may opt for single-user licenses, while businesses requiring broader access may choose multi-user or enterprise licenses for cost-effective access to the report.
13. Are there any additional resources or data provided in the Electric Bus Battery Pack Market report?
While the report offers comprehensive insights, it's advisable to review the specific contents or supplementary materials provided to ascertain if additional resources or data are available.
14. How can I stay updated on further developments or reports in the Electric Bus Battery Pack Market?
To stay informed about further developments, trends, and reports in the Electric Bus Battery Pack Market, consider subscribing to industry newsletters, following relevant companies and organizations, or regularly checking reputable industry news sources and publications.
Methodology
Step 1 - Identification of Relevant Samples Size from Population Database


Step 2 - Approaches for Defining Global Market Size (Value, Volume* & Price*)

Note*: In applicable scenarios
Step 3 - Data Sources
Primary Research
- Web Analytics
- Survey Reports
- Research Institute
- Latest Research Reports
- Opinion Leaders
Secondary Research
- Annual Reports
- White Paper
- Latest Press Release
- Industry Association
- Paid Database
- Investor Presentations

Step 4 - Data Triangulation
Involves using different sources of information in order to increase the validity of a study
These sources are likely to be stakeholders in a program - participants, other researchers, program staff, other community members, and so on.
Then we put all data in single framework & apply various statistical tools to find out the dynamic on the market.
During the analysis stage, feedback from the stakeholder groups would be compared to determine areas of agreement as well as areas of divergence


