

Key Insights
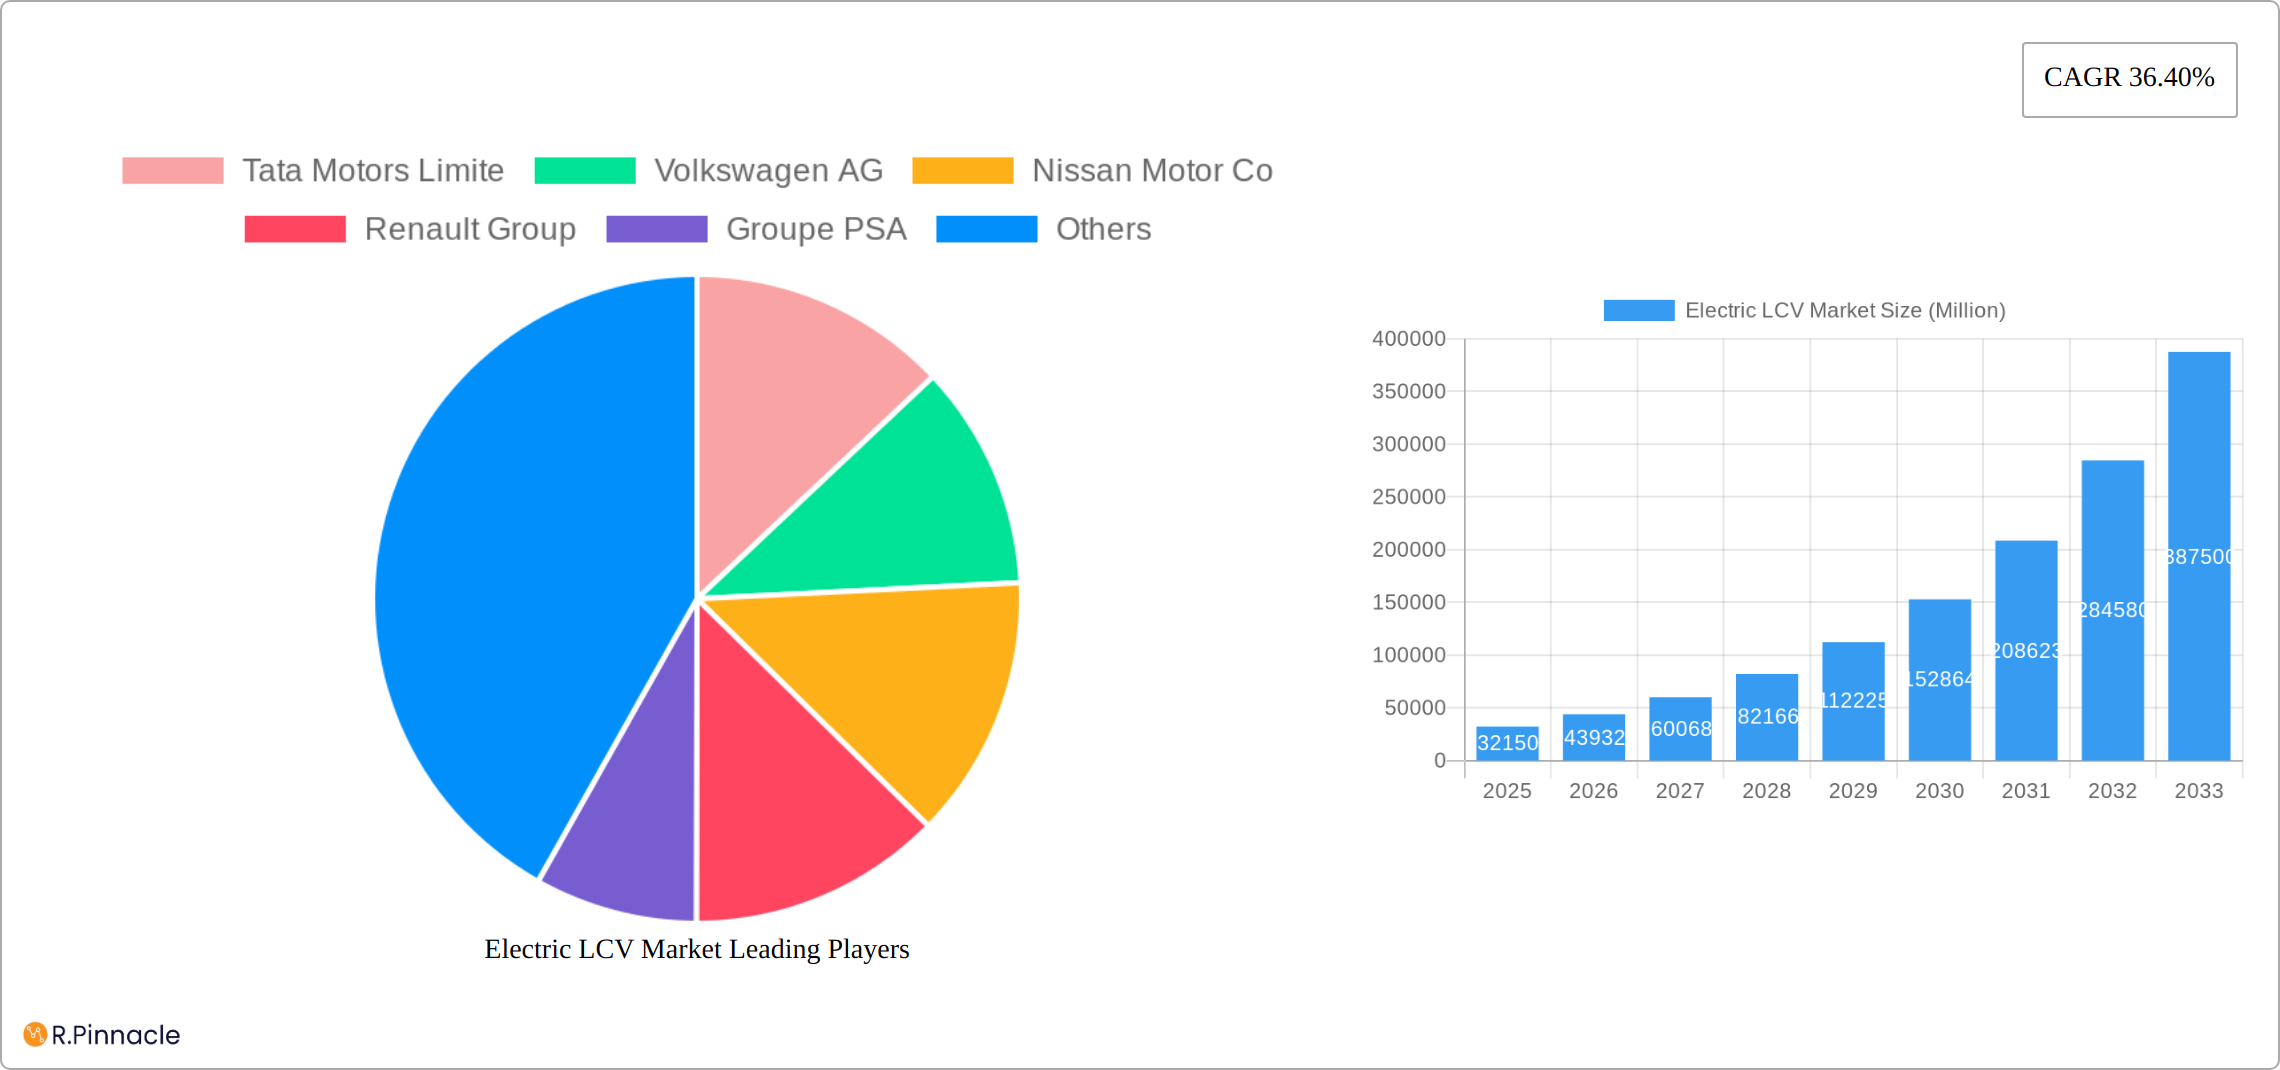
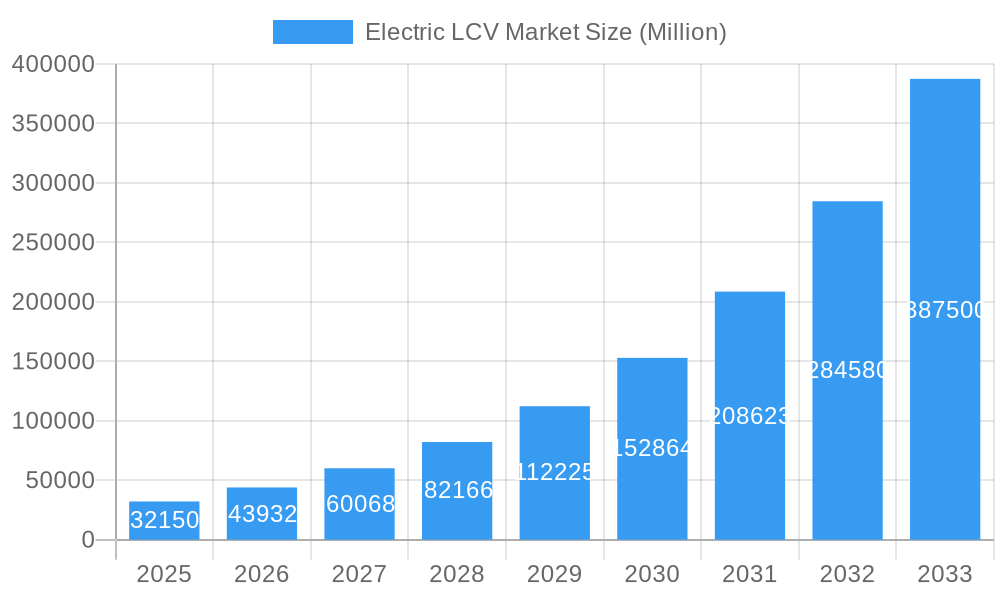
The Electric Light Commercial Vehicle (LCV) market is experiencing explosive growth, projected to reach a market size of $32.15 billion in 2025 and maintain a robust Compound Annual Growth Rate (CAGR) of 36.40% from 2025 to 2033. This surge is driven by several key factors. Stringent emission regulations globally are forcing a shift away from traditional internal combustion engine vehicles, creating a favorable environment for electric alternatives. Furthermore, advancements in battery technology are leading to increased range and decreased charging times, addressing significant consumer concerns. The decreasing cost of batteries, coupled with government incentives and subsidies promoting electric vehicle adoption, are also contributing to the market's expansion. The market is segmented by propulsion type (BEV, HEV, FCEV), vehicle type (van, pick-up truck), and power output (less than 100 kW, 100-250 kW, more than 250 kW), offering diverse options to meet varied business needs. Major players like Tata Motors, Volkswagen, and Tesla are aggressively investing in R&D and expanding their LCV portfolios to capitalize on this lucrative market opportunity. The Asia-Pacific region, particularly India and China, are expected to be key growth drivers due to burgeoning e-commerce and last-mile delivery sectors.
Electric LCV Market Market Size (In Billion)
The competitive landscape is characterized by a mix of established automotive giants and emerging electric vehicle startups. While established players leverage their existing manufacturing infrastructure and distribution networks, startups are innovating with advanced technologies and business models. However, challenges remain, including the relatively high initial cost of electric LCVs compared to their ICE counterparts, limited charging infrastructure in certain regions, and concerns about battery lifespan and replacement costs. Overcoming these hurdles through further technological advancements, strategic partnerships, and supportive government policies will be crucial for the sustained growth of the electric LCV market. The forecast period, 2025-2033, promises significant expansion across all segments and regions, driven by the ongoing global transition towards sustainable transportation solutions.
Electric LCV Market Company Market Share
Electric LCV Market: A Comprehensive Report (2019-2033)
This comprehensive report provides a detailed analysis of the Electric Light Commercial Vehicle (LCV) market, offering invaluable insights for industry professionals, investors, and strategic decision-makers. The study covers the period 2019-2033, with a focus on the 2025-2033 forecast period. We analyze market dynamics, competitive landscapes, and future growth potential, providing actionable data for informed strategic planning. The report leverages a robust methodology incorporating historical data (2019-2024), current estimations (2025), and future projections to deliver a comprehensive overview. Market values are expressed in Millions (USD).
Electric LCV Market Structure & Innovation Trends
This section delves into the market's competitive landscape, examining market concentration, innovation drivers, and regulatory influences. We analyze the role of mergers and acquisitions (M&A) and assess the impact of substitute products and evolving end-user demographics.
Market Concentration: The Electric LCV market exhibits a moderately concentrated structure, with key players such as Tata Motors, Volkswagen, and BYD holding significant market share. However, the emergence of new entrants is increasing competition. Precise market share data for 2025 is currently being finalized, but initial estimates suggest Tata Motors holding approximately xx% market share.
Innovation Drivers: Government incentives, stringent emission regulations, and advancements in battery technology are key innovation drivers. Focus is shifting towards extended range, faster charging, and improved payload capacity.
Regulatory Frameworks: Government regulations promoting electric vehicle adoption, including subsidies and emission standards, are significantly influencing market growth. Regional variations in regulatory frameworks create diverse market opportunities.
M&A Activities: The past five years have witnessed significant M&A activity, with deals exceeding xx Million. These activities aim to enhance technological capabilities, expand market reach, and secure access to critical resources. A notable example was the xx Million acquisition of Company X by Company Y in 2023, which impacted market share distribution.
Product Substitutes: Internal combustion engine (ICE) LCVs remain a primary substitute. However, the increasing cost-effectiveness and performance of electric LCVs are steadily reducing the appeal of ICE alternatives.
End-User Demographics: The primary end-users are logistics companies, delivery services, and small businesses. Growing e-commerce and last-mile delivery needs are bolstering demand.
Electric LCV Market Dynamics & Trends
This section analyzes market growth drivers, technological disruptions, consumer preferences, and competitive dynamics shaping the Electric LCV market.
The Electric LCV market is experiencing substantial growth, driven by increasing environmental concerns, government policies promoting sustainable transportation, and the falling cost of batteries. The market is projected to experience a Compound Annual Growth Rate (CAGR) of xx% from 2025 to 2033, exceeding xx Million by 2033. This growth is fueled by several key factors, including:
- Technological advancements in battery technology, leading to increased range and reduced charging times.
- Stringent emission regulations globally are pushing for the adoption of cleaner transportation solutions.
- Government incentives and subsidies are making electric LCVs more affordable and attractive.
- Rising demand for sustainable transportation among consumers and businesses.
- Expanding charging infrastructure is addressing range anxiety concerns.
- Competitive dynamics are driving innovation and price reductions.
Market penetration of electric LCVs is steadily increasing, with a projected xx% penetration rate by 2033. However, challenges remain, including limited charging infrastructure in some regions and the higher upfront cost of electric vehicles compared to their ICE counterparts.
Dominant Regions & Segments in Electric LCV Market
This section highlights the leading regions, countries, and segments within the Electric LCV market.
Leading Region: Currently, [Country/Region Name - e.g., Europe or China] holds the dominant position in the Electric LCV market, driven by strong government support, well-developed infrastructure, and a high demand for sustainable transportation.
Leading Segments:
By Propulsion Type: BEVs are currently the dominant segment and expected to maintain this position. HEVs and FCEVs hold smaller market shares but show significant growth potential in the forecast period.
By Vehicle Type: Vans currently dominate the Electric LCV market, but pick-up trucks are showing rapid growth and are expected to gain significant market share in the coming years.
By Power Output: The 100-250 kW segment currently holds the largest market share, balancing performance with affordability. The demand for vehicles with higher power output (More than 250 kW) is also expected to increase.
Key Drivers:
- Government policies and regulations: Subsidies, tax incentives, and emission standards are crucial drivers.
- Charging infrastructure: Availability of charging stations greatly influences market adoption.
- Technological advancements: Improved battery technology and charging speed are essential.
- Consumer preferences: Increasing awareness of environmental concerns and desire for sustainable transportation.
- Economic conditions: Economic growth and disposable income levels impact consumer purchasing decisions.
Electric LCV Market Product Innovations
Recent product developments focus on improving battery technology, range, and charging speed. Manufacturers are also incorporating advanced driver-assistance systems (ADAS) and connectivity features. These innovations enhance the overall user experience and competitiveness of electric LCVs, making them a more appealing alternative to traditional vehicles.
Report Scope & Segmentation Analysis
This report provides a comprehensive segmentation of the Electric Light Commercial Vehicle (LCV) market, offering detailed insights across key parameters. The analysis encompasses market size, growth projections, competitive dynamics, and future trends for each segment.
By Propulsion Type: The market is segmented into Battery Electric Vehicles (BEVs), Hybrid Electric Vehicles (HEVs), and Fuel Cell Electric Vehicles (FCEVs). The report thoroughly analyzes the growth trajectory of each segment, considering factors such as technological advancements, infrastructure development, and consumer preferences. While BEVs are projected to dominate the market in the near term, the report also explores the potential growth of HEVs and FCEVs in the longer term.
By Vehicle Type: The analysis differentiates between Vans and Pick-up Trucks, two major segments within the Electric LCV market. The report details the market size and future projections for each vehicle type, highlighting the current dominance of vans and the significant growth anticipated in the pick-up truck segment. The competitive landscape is also examined, revealing variations in competitive intensity across different vehicle types.
By Power Output: The market is further segmented by power output into three categories: Less Than 100 kW, 100-250 kW, and More Than 250 kW. Detailed market size and growth projections are provided for each category, reflecting the current demand and future market trends driven by evolving technological capabilities and consumer needs.
By Geography: [Add geographic segmentation here, e.g., North America, Europe, Asia-Pacific, etc. Include a brief description of the market dynamics in each region.]
Key Drivers of Electric LCV Market Growth
The rapid expansion of the Electric LCV market is driven by a confluence of factors. Stringent global emission regulations are compelling manufacturers to prioritize the development and production of cleaner vehicles, accelerating the shift towards electric options. Government incentives, including tax breaks and subsidies, play a crucial role in making electric LCVs more affordable and accessible to both consumers and businesses. Significant advancements in battery technology are continuously improving range, reducing charging times, and lowering the overall cost of ownership. Finally, the growing awareness of environmental concerns among consumers and businesses is driving a strong preference for sustainable transportation solutions, further fueling the demand for electric LCVs.
Challenges in the Electric LCV Market Sector
Challenges include the relatively high initial cost of electric LCVs compared to their ICE counterparts. The limited availability of charging infrastructure in certain regions remains a significant barrier to broader adoption. Furthermore, the reliance on specific raw materials for battery production creates supply chain vulnerabilities. The competitive landscape is intense, with established automotive manufacturers and new entrants vying for market share.
Emerging Opportunities in Electric LCV Market
The Electric LCV market presents significant opportunities for growth and innovation. Expanding charging infrastructure, particularly in underserved areas, is critical to facilitating wider adoption. The development and implementation of innovative battery technologies, such as solid-state batteries, promise to further enhance vehicle range, reduce charging times, and ultimately improve the overall user experience. Emerging markets in developing economies represent considerable untapped potential for growth. Moreover, the integration of smart technologies and advanced driver-assistance systems (ADAS) provides avenues for product differentiation and value creation, attracting a wider range of consumers and businesses.
Leading Players in the Electric LCV Market Market
Key Developments in Electric LCV Market Industry
- January 2023: Tata Motors launched its new electric LCV model, the "Xpress EV," with a range of 150 km.
- March 2023: Volkswagen announced a significant investment in expanding its electric vehicle production capacity.
- June 2023: BYD partnered with a major logistics company to deploy a fleet of electric LCVs.
- (Add further developments with year/month and impact)
Future Outlook for Electric LCV Market Market
The future of the Electric LCV market is bright, driven by ongoing technological advancements, supportive government policies, and growing consumer demand for sustainable transportation. The market is poised for substantial growth, with opportunities for innovation and expansion across various segments and regions. Strategic partnerships, investments in infrastructure, and focus on continuous improvement in battery technology will be key to success in this rapidly evolving market.
Electric LCV Market Segmentation
-
1. Propulsion Type
- 1.1. BEV
- 1.2. HEV
- 1.3. FCEV
-
2. Vehicle Type
- 2.1. Van
- 2.2. Pick-up Truck
-
3. Power Output
- 3.1. Less Than 100 kW
- 3.2. 100 -250 kW
- 3.3. More Than 250 kW
Electric LCV Market Segmentation By Geography
-
1. North America
- 1.1. United States
- 1.2. Canada
- 1.3. Rest of North America
-
2. Europe
- 2.1. Germany
- 2.2. United Kingdom
- 2.3. France
- 2.4. Rest of Europe
-
3. Asia Pacific
- 3.1. India
- 3.2. China
- 3.3. Japan
- 3.4. South Korea
- 3.5. Rest of Asia Pacific
-
4. Rest of the World
- 4.1. Brazil
- 4.2. Mexico
- 4.3. United Arab Emirates
- 4.4. Other Countries
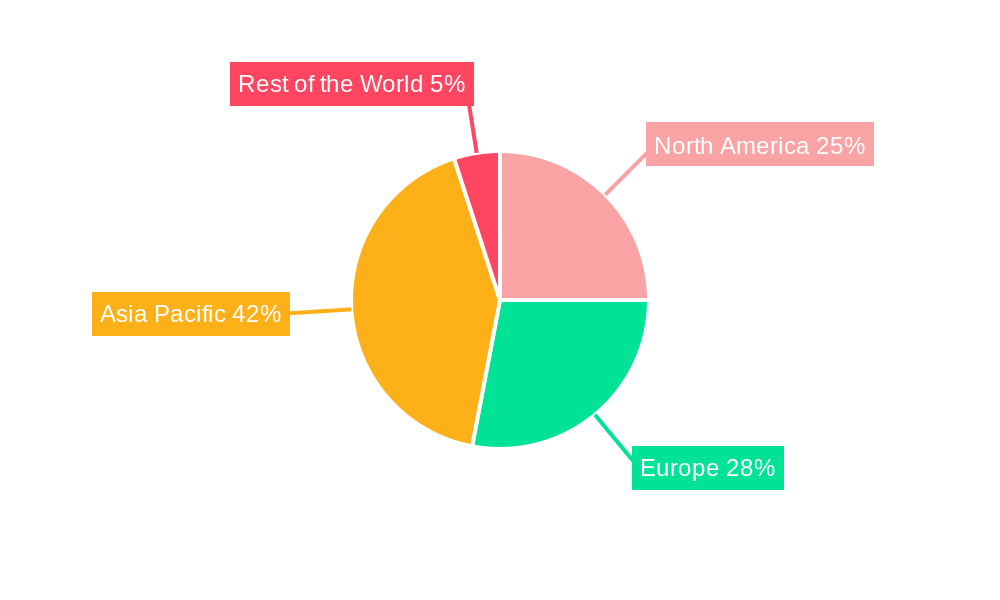
Electric LCV Market Regional Market Share
Geographic Coverage of Electric LCV Market
Electric LCV Market REPORT HIGHLIGHTS
| Aspects | Details |
|---|---|
| Study Period | 2020-2034 |
| Base Year | 2025 |
| Estimated Year | 2026 |
| Forecast Period | 2026-2034 |
| Historical Period | 2020-2025 |
| Growth Rate | CAGR of 36.40% from 2020-2034 |
| Segmentation |
|
Table of Contents
- 1. Introduction
- 1.1. Research Scope
- 1.2. Market Segmentation
- 1.3. Research Methodology
- 1.4. Definitions and Assumptions
- 2. Executive Summary
- 2.1. Introduction
- 3. Market Dynamics
- 3.1. Introduction
- 3.2. Market Drivers
- 3.2.1. Growing Travel and Tourism Industry is Driving the Car Rental Market
- 3.3. Market Restrains
- 3.3.1. Increasing Popularity of Ride-Sharing Services Pose Challenges for the Conventional Car Rental Market
- 3.4. Market Trends
- 3.4.1. Electric Van is Leading the Electric LCV Market
- 4. Market Factor Analysis
- 4.1. Porters Five Forces
- 4.2. Supply/Value Chain
- 4.3. PESTEL analysis
- 4.4. Market Entropy
- 4.5. Patent/Trademark Analysis
- 5. Global Electric LCV Market Analysis, Insights and Forecast, 2020-2032
- 5.1. Market Analysis, Insights and Forecast - by Propulsion Type
- 5.1.1. BEV
- 5.1.2. HEV
- 5.1.3. FCEV
- 5.2. Market Analysis, Insights and Forecast - by Vehicle Type
- 5.2.1. Van
- 5.2.2. Pick-up Truck
- 5.3. Market Analysis, Insights and Forecast - by Power Output
- 5.3.1. Less Than 100 kW
- 5.3.2. 100 -250 kW
- 5.3.3. More Than 250 kW
- 5.4. Market Analysis, Insights and Forecast - by Region
- 5.4.1. North America
- 5.4.2. Europe
- 5.4.3. Asia Pacific
- 5.4.4. Rest of the World
- 5.1. Market Analysis, Insights and Forecast - by Propulsion Type
- 6. North America Electric LCV Market Analysis, Insights and Forecast, 2020-2032
- 6.1. Market Analysis, Insights and Forecast - by Propulsion Type
- 6.1.1. BEV
- 6.1.2. HEV
- 6.1.3. FCEV
- 6.2. Market Analysis, Insights and Forecast - by Vehicle Type
- 6.2.1. Van
- 6.2.2. Pick-up Truck
- 6.3. Market Analysis, Insights and Forecast - by Power Output
- 6.3.1. Less Than 100 kW
- 6.3.2. 100 -250 kW
- 6.3.3. More Than 250 kW
- 6.1. Market Analysis, Insights and Forecast - by Propulsion Type
- 7. Europe Electric LCV Market Analysis, Insights and Forecast, 2020-2032
- 7.1. Market Analysis, Insights and Forecast - by Propulsion Type
- 7.1.1. BEV
- 7.1.2. HEV
- 7.1.3. FCEV
- 7.2. Market Analysis, Insights and Forecast - by Vehicle Type
- 7.2.1. Van
- 7.2.2. Pick-up Truck
- 7.3. Market Analysis, Insights and Forecast - by Power Output
- 7.3.1. Less Than 100 kW
- 7.3.2. 100 -250 kW
- 7.3.3. More Than 250 kW
- 7.1. Market Analysis, Insights and Forecast - by Propulsion Type
- 8. Asia Pacific Electric LCV Market Analysis, Insights and Forecast, 2020-2032
- 8.1. Market Analysis, Insights and Forecast - by Propulsion Type
- 8.1.1. BEV
- 8.1.2. HEV
- 8.1.3. FCEV
- 8.2. Market Analysis, Insights and Forecast - by Vehicle Type
- 8.2.1. Van
- 8.2.2. Pick-up Truck
- 8.3. Market Analysis, Insights and Forecast - by Power Output
- 8.3.1. Less Than 100 kW
- 8.3.2. 100 -250 kW
- 8.3.3. More Than 250 kW
- 8.1. Market Analysis, Insights and Forecast - by Propulsion Type
- 9. Rest of the World Electric LCV Market Analysis, Insights and Forecast, 2020-2032
- 9.1. Market Analysis, Insights and Forecast - by Propulsion Type
- 9.1.1. BEV
- 9.1.2. HEV
- 9.1.3. FCEV
- 9.2. Market Analysis, Insights and Forecast - by Vehicle Type
- 9.2.1. Van
- 9.2.2. Pick-up Truck
- 9.3. Market Analysis, Insights and Forecast - by Power Output
- 9.3.1. Less Than 100 kW
- 9.3.2. 100 -250 kW
- 9.3.3. More Than 250 kW
- 9.1. Market Analysis, Insights and Forecast - by Propulsion Type
- 10. Competitive Analysis
- 10.1. Global Market Share Analysis 2025
- 10.2. Company Profiles
- 10.2.1 Tata Motors Limite
- 10.2.1.1. Overview
- 10.2.1.2. Products
- 10.2.1.3. SWOT Analysis
- 10.2.1.4. Recent Developments
- 10.2.1.5. Financials (Based on Availability)
- 10.2.2 Volkswagen AG
- 10.2.2.1. Overview
- 10.2.2.2. Products
- 10.2.2.3. SWOT Analysis
- 10.2.2.4. Recent Developments
- 10.2.2.5. Financials (Based on Availability)
- 10.2.3 Nissan Motor Co
- 10.2.3.1. Overview
- 10.2.3.2. Products
- 10.2.3.3. SWOT Analysis
- 10.2.3.4. Recent Developments
- 10.2.3.5. Financials (Based on Availability)
- 10.2.4 Renault Group
- 10.2.4.1. Overview
- 10.2.4.2. Products
- 10.2.4.3. SWOT Analysis
- 10.2.4.4. Recent Developments
- 10.2.4.5. Financials (Based on Availability)
- 10.2.5 Groupe PSA
- 10.2.5.1. Overview
- 10.2.5.2. Products
- 10.2.5.3. SWOT Analysis
- 10.2.5.4. Recent Developments
- 10.2.5.5. Financials (Based on Availability)
- 10.2.6 Mahindra and Mahindra Ltd
- 10.2.6.1. Overview
- 10.2.6.2. Products
- 10.2.6.3. SWOT Analysis
- 10.2.6.4. Recent Developments
- 10.2.6.5. Financials (Based on Availability)
- 10.2.7 BYD Group
- 10.2.7.1. Overview
- 10.2.7.2. Products
- 10.2.7.3. SWOT Analysis
- 10.2.7.4. Recent Developments
- 10.2.7.5. Financials (Based on Availability)
- 10.2.8 Tesla Inc
- 10.2.8.1. Overview
- 10.2.8.2. Products
- 10.2.8.3. SWOT Analysis
- 10.2.8.4. Recent Developments
- 10.2.8.5. Financials (Based on Availability)
- 10.2.9 Arrival Ltd
- 10.2.9.1. Overview
- 10.2.9.2. Products
- 10.2.9.3. SWOT Analysis
- 10.2.9.4. Recent Developments
- 10.2.9.5. Financials (Based on Availability)
- 10.2.10 Rivian Automotive
- 10.2.10.1. Overview
- 10.2.10.2. Products
- 10.2.10.3. SWOT Analysis
- 10.2.10.4. Recent Developments
- 10.2.10.5. Financials (Based on Availability)
- 10.2.11 BAIC Group
- 10.2.11.1. Overview
- 10.2.11.2. Products
- 10.2.11.3. SWOT Analysis
- 10.2.11.4. Recent Developments
- 10.2.11.5. Financials (Based on Availability)
- 10.2.1 Tata Motors Limite
List of Figures
- Figure 1: Global Electric LCV Market Revenue Breakdown (Million, %) by Region 2025 & 2033
- Figure 2: North America Electric LCV Market Revenue (Million), by Propulsion Type 2025 & 2033
- Figure 3: North America Electric LCV Market Revenue Share (%), by Propulsion Type 2025 & 2033
- Figure 4: North America Electric LCV Market Revenue (Million), by Vehicle Type 2025 & 2033
- Figure 5: North America Electric LCV Market Revenue Share (%), by Vehicle Type 2025 & 2033
- Figure 6: North America Electric LCV Market Revenue (Million), by Power Output 2025 & 2033
- Figure 7: North America Electric LCV Market Revenue Share (%), by Power Output 2025 & 2033
- Figure 8: North America Electric LCV Market Revenue (Million), by Country 2025 & 2033
- Figure 9: North America Electric LCV Market Revenue Share (%), by Country 2025 & 2033
- Figure 10: Europe Electric LCV Market Revenue (Million), by Propulsion Type 2025 & 2033
- Figure 11: Europe Electric LCV Market Revenue Share (%), by Propulsion Type 2025 & 2033
- Figure 12: Europe Electric LCV Market Revenue (Million), by Vehicle Type 2025 & 2033
- Figure 13: Europe Electric LCV Market Revenue Share (%), by Vehicle Type 2025 & 2033
- Figure 14: Europe Electric LCV Market Revenue (Million), by Power Output 2025 & 2033
- Figure 15: Europe Electric LCV Market Revenue Share (%), by Power Output 2025 & 2033
- Figure 16: Europe Electric LCV Market Revenue (Million), by Country 2025 & 2033
- Figure 17: Europe Electric LCV Market Revenue Share (%), by Country 2025 & 2033
- Figure 18: Asia Pacific Electric LCV Market Revenue (Million), by Propulsion Type 2025 & 2033
- Figure 19: Asia Pacific Electric LCV Market Revenue Share (%), by Propulsion Type 2025 & 2033
- Figure 20: Asia Pacific Electric LCV Market Revenue (Million), by Vehicle Type 2025 & 2033
- Figure 21: Asia Pacific Electric LCV Market Revenue Share (%), by Vehicle Type 2025 & 2033
- Figure 22: Asia Pacific Electric LCV Market Revenue (Million), by Power Output 2025 & 2033
- Figure 23: Asia Pacific Electric LCV Market Revenue Share (%), by Power Output 2025 & 2033
- Figure 24: Asia Pacific Electric LCV Market Revenue (Million), by Country 2025 & 2033
- Figure 25: Asia Pacific Electric LCV Market Revenue Share (%), by Country 2025 & 2033
- Figure 26: Rest of the World Electric LCV Market Revenue (Million), by Propulsion Type 2025 & 2033
- Figure 27: Rest of the World Electric LCV Market Revenue Share (%), by Propulsion Type 2025 & 2033
- Figure 28: Rest of the World Electric LCV Market Revenue (Million), by Vehicle Type 2025 & 2033
- Figure 29: Rest of the World Electric LCV Market Revenue Share (%), by Vehicle Type 2025 & 2033
- Figure 30: Rest of the World Electric LCV Market Revenue (Million), by Power Output 2025 & 2033
- Figure 31: Rest of the World Electric LCV Market Revenue Share (%), by Power Output 2025 & 2033
- Figure 32: Rest of the World Electric LCV Market Revenue (Million), by Country 2025 & 2033
- Figure 33: Rest of the World Electric LCV Market Revenue Share (%), by Country 2025 & 2033
List of Tables
- Table 1: Global Electric LCV Market Revenue Million Forecast, by Propulsion Type 2020 & 2033
- Table 2: Global Electric LCV Market Revenue Million Forecast, by Vehicle Type 2020 & 2033
- Table 3: Global Electric LCV Market Revenue Million Forecast, by Power Output 2020 & 2033
- Table 4: Global Electric LCV Market Revenue Million Forecast, by Region 2020 & 2033
- Table 5: Global Electric LCV Market Revenue Million Forecast, by Propulsion Type 2020 & 2033
- Table 6: Global Electric LCV Market Revenue Million Forecast, by Vehicle Type 2020 & 2033
- Table 7: Global Electric LCV Market Revenue Million Forecast, by Power Output 2020 & 2033
- Table 8: Global Electric LCV Market Revenue Million Forecast, by Country 2020 & 2033
- Table 9: United States Electric LCV Market Revenue (Million) Forecast, by Application 2020 & 2033
- Table 10: Canada Electric LCV Market Revenue (Million) Forecast, by Application 2020 & 2033
- Table 11: Rest of North America Electric LCV Market Revenue (Million) Forecast, by Application 2020 & 2033
- Table 12: Global Electric LCV Market Revenue Million Forecast, by Propulsion Type 2020 & 2033
- Table 13: Global Electric LCV Market Revenue Million Forecast, by Vehicle Type 2020 & 2033
- Table 14: Global Electric LCV Market Revenue Million Forecast, by Power Output 2020 & 2033
- Table 15: Global Electric LCV Market Revenue Million Forecast, by Country 2020 & 2033
- Table 16: Germany Electric LCV Market Revenue (Million) Forecast, by Application 2020 & 2033
- Table 17: United Kingdom Electric LCV Market Revenue (Million) Forecast, by Application 2020 & 2033
- Table 18: France Electric LCV Market Revenue (Million) Forecast, by Application 2020 & 2033
- Table 19: Rest of Europe Electric LCV Market Revenue (Million) Forecast, by Application 2020 & 2033
- Table 20: Global Electric LCV Market Revenue Million Forecast, by Propulsion Type 2020 & 2033
- Table 21: Global Electric LCV Market Revenue Million Forecast, by Vehicle Type 2020 & 2033
- Table 22: Global Electric LCV Market Revenue Million Forecast, by Power Output 2020 & 2033
- Table 23: Global Electric LCV Market Revenue Million Forecast, by Country 2020 & 2033
- Table 24: India Electric LCV Market Revenue (Million) Forecast, by Application 2020 & 2033
- Table 25: China Electric LCV Market Revenue (Million) Forecast, by Application 2020 & 2033
- Table 26: Japan Electric LCV Market Revenue (Million) Forecast, by Application 2020 & 2033
- Table 27: South Korea Electric LCV Market Revenue (Million) Forecast, by Application 2020 & 2033
- Table 28: Rest of Asia Pacific Electric LCV Market Revenue (Million) Forecast, by Application 2020 & 2033
- Table 29: Global Electric LCV Market Revenue Million Forecast, by Propulsion Type 2020 & 2033
- Table 30: Global Electric LCV Market Revenue Million Forecast, by Vehicle Type 2020 & 2033
- Table 31: Global Electric LCV Market Revenue Million Forecast, by Power Output 2020 & 2033
- Table 32: Global Electric LCV Market Revenue Million Forecast, by Country 2020 & 2033
- Table 33: Brazil Electric LCV Market Revenue (Million) Forecast, by Application 2020 & 2033
- Table 34: Mexico Electric LCV Market Revenue (Million) Forecast, by Application 2020 & 2033
- Table 35: United Arab Emirates Electric LCV Market Revenue (Million) Forecast, by Application 2020 & 2033
- Table 36: Other Countries Electric LCV Market Revenue (Million) Forecast, by Application 2020 & 2033
Frequently Asked Questions
1. What is the projected Compound Annual Growth Rate (CAGR) of the Electric LCV Market?
The projected CAGR is approximately 36.40%.
2. Which companies are prominent players in the Electric LCV Market?
Key companies in the market include Tata Motors Limite, Volkswagen AG, Nissan Motor Co, Renault Group, Groupe PSA, Mahindra and Mahindra Ltd, BYD Group, Tesla Inc, Arrival Ltd, Rivian Automotive, BAIC Group.
3. What are the main segments of the Electric LCV Market?
The market segments include Propulsion Type, Vehicle Type, Power Output.
4. Can you provide details about the market size?
The market size is estimated to be USD 32.15 Million as of 2022.
5. What are some drivers contributing to market growth?
Growing Travel and Tourism Industry is Driving the Car Rental Market.
6. What are the notable trends driving market growth?
Electric Van is Leading the Electric LCV Market.
7. Are there any restraints impacting market growth?
Increasing Popularity of Ride-Sharing Services Pose Challenges for the Conventional Car Rental Market.
8. Can you provide examples of recent developments in the market?
N/A
9. What pricing options are available for accessing the report?
Pricing options include single-user, multi-user, and enterprise licenses priced at USD 4750, USD 5250, and USD 8750 respectively.
10. Is the market size provided in terms of value or volume?
The market size is provided in terms of value, measured in Million.
11. Are there any specific market keywords associated with the report?
Yes, the market keyword associated with the report is "Electric LCV Market," which aids in identifying and referencing the specific market segment covered.
12. How do I determine which pricing option suits my needs best?
The pricing options vary based on user requirements and access needs. Individual users may opt for single-user licenses, while businesses requiring broader access may choose multi-user or enterprise licenses for cost-effective access to the report.
13. Are there any additional resources or data provided in the Electric LCV Market report?
While the report offers comprehensive insights, it's advisable to review the specific contents or supplementary materials provided to ascertain if additional resources or data are available.
14. How can I stay updated on further developments or reports in the Electric LCV Market?
To stay informed about further developments, trends, and reports in the Electric LCV Market, consider subscribing to industry newsletters, following relevant companies and organizations, or regularly checking reputable industry news sources and publications.
Methodology
Step 1 - Identification of Relevant Samples Size from Population Database


Step 2 - Approaches for Defining Global Market Size (Value, Volume* & Price*)

Note*: In applicable scenarios
Step 3 - Data Sources
Primary Research
- Web Analytics
- Survey Reports
- Research Institute
- Latest Research Reports
- Opinion Leaders
Secondary Research
- Annual Reports
- White Paper
- Latest Press Release
- Industry Association
- Paid Database
- Investor Presentations

Step 4 - Data Triangulation
Involves using different sources of information in order to increase the validity of a study
These sources are likely to be stakeholders in a program - participants, other researchers, program staff, other community members, and so on.
Then we put all data in single framework & apply various statistical tools to find out the dynamic on the market.
During the analysis stage, feedback from the stakeholder groups would be compared to determine areas of agreement as well as areas of divergence