

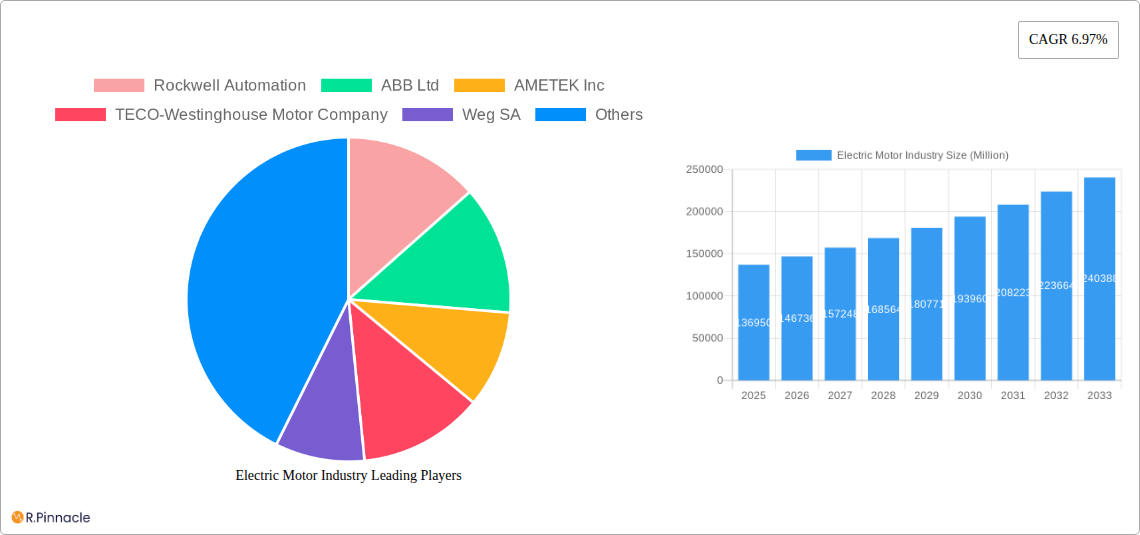
Key Insights
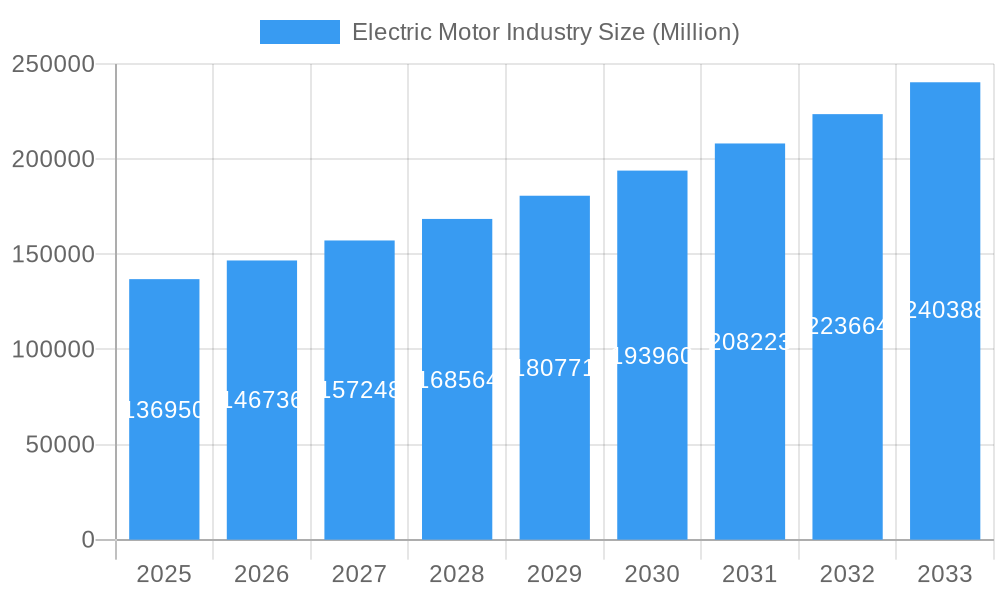
The global electric motor market, valued at $136.95 billion in 2025, is projected to experience robust growth, driven by the increasing adoption of electric vehicles (EVs), automation across industries, and stringent government regulations promoting energy efficiency. The 6.97% CAGR indicates a significant expansion over the forecast period (2025-2033). Key market drivers include the rising demand for energy-efficient motors in industrial applications like manufacturing and HVAC, coupled with the burgeoning renewable energy sector. Trends such as the increasing integration of smart technologies (IoT and predictive maintenance) in motor systems are further fueling market growth. While the increasing cost of raw materials and supply chain disruptions pose some restraints, the long-term outlook remains positive, fueled by technological advancements and sustainable development initiatives. Segmentation reveals a diverse landscape, with AC motors holding a significant share in the motor type segment, while the industrial application segment dominates overall demand. Geographically, North America and Asia Pacific are anticipated to be key contributors to market growth, with strong demand from the automotive and industrial sectors in these regions. The competitive landscape is characterized by established players like Rockwell Automation, ABB Ltd, and Siemens AG, alongside emerging players focusing on innovation and specialized motor solutions.
Electric Motor Industry Market Size (In Billion)
The forecast for 2033 suggests a market size exceeding $260 billion, indicating substantial growth opportunities for market participants. This growth will likely be driven by continued advancements in motor technology, including higher efficiency motors and the adoption of more durable and sustainable materials. Furthermore, government incentives aimed at reducing carbon emissions and promoting electric mobility will play a crucial role in shaping the market trajectory over the coming years. Specific regional growth rates will depend on factors such as economic development, infrastructural investments, and policy support within each region. Companies will need to focus on innovation, strategic partnerships, and efficient supply chain management to successfully navigate the dynamic market landscape and capture market share.
Electric Motor Industry Company Market Share
Electric Motor Industry Market Report: 2019-2033
This comprehensive report provides a detailed analysis of the electric motor industry, offering invaluable insights for industry professionals, investors, and strategists. Covering the period 2019-2033, with a focus on 2025, this report examines market structure, dynamics, key players, and future trends, equipping readers with the knowledge to navigate this rapidly evolving landscape. The report analyzes a market valued at xx Million USD in 2025, projected to reach xx Million USD by 2033, exhibiting a robust CAGR of xx%.
Electric Motor Industry Market Structure & Innovation Trends
The electric motor industry is characterized by a moderately concentrated market structure, with key players holding significant market share. Rockwell Automation, ABB Ltd, and Siemens AG are among the leading companies, collectively accounting for an estimated xx% of the global market in 2025. Innovation is driven by advancements in materials science, power electronics, and control systems, leading to higher efficiency, smaller form factors, and enhanced durability. Stringent environmental regulations, particularly concerning energy efficiency, are pushing the adoption of high-performance electric motors. Product substitution is occurring with the increasing prevalence of brushless DC motors over traditional brushed DC motors in several applications. The end-user demographics are diverse, spanning residential, commercial, industrial, and automotive sectors. M&A activity has been significant, with deal values totaling an estimated xx Million USD in the last five years, driven by consolidation efforts and the pursuit of technological capabilities.
- Market Concentration: High (xx% market share held by top 3 players in 2025)
- Innovation Drivers: Advancements in materials, power electronics, and control systems.
- Regulatory Frameworks: Stringent energy efficiency standards globally.
- Product Substitutes: Brushless DC motors replacing brushed DC motors.
- M&A Activity: xx Million USD in deal values (2019-2024)
Electric Motor Industry Market Dynamics & Trends
The global electric motor market is experiencing robust and accelerating growth, significantly propelled by the pervasive electrification trend across diverse industrial and consumer sectors. The burgeoning demand for electric vehicles (EVs) stands as a primary catalyst, while the relentless drive for automation within industrial processes further intensifies market expansion. Technological advancements are fundamentally reshaping the competitive landscape, with a particular emphasis on the development of ultra-high-efficiency motors and sophisticated smart motor technologies that offer enhanced control and predictive maintenance capabilities. Consumer preferences are demonstrably shifting towards energy-efficient, sustainable, and environmentally conscious solutions, thereby reinforcing market demand and incentivizing innovation. The competitive arena is characterized by intense rivalry, compelling leading industry players to make substantial investments in research and development (R&D) and forge strategic partnerships to solidify and expand their market share. The market exhibits impressive growth across all its major segments, with the automotive sector spearheading this expansion due to the EV revolution, closely followed by the industrial sector which benefits from increased automation and energy efficiency mandates.
Dominant Regions & Segments in Electric Motor Industry
The Asia-Pacific region dominates the global electric motor market, driven by rapid industrialization, increasing vehicle production, and supportive government policies. China and Japan are the leading countries within this region. Within the market segmentation:
- Motor Type: AC motors hold a larger market share than DC motors due to their cost-effectiveness and reliability.
- Voltage: The segment of motors with voltage less than 1 kV holds the largest market share owing to its wide applicability across various sectors.
- Application: The industrial segment dominates the market, followed by the automotive sector, driven by the increasing demand for electric vehicles and automation.
Key Drivers:
- Asia-Pacific Region: Rapid industrialization, high vehicle production, supportive government policies.
- AC Motors: Cost-effectiveness and reliability.
- <1 kV Voltage Motors: Wide applicability across sectors.
- Industrial Applications: Automation and industrialization drives demand.
Electric Motor Industry Product Innovations
Recent product innovations in the electric motor industry are centered around maximizing energy efficiency and integrating intelligent functionalities. This includes the design and manufacturing of motors utilizing advanced materials like rare-earth magnets and novel winding techniques, alongside sophisticated aerodynamic and thermal management designs. The integration of smart technologies, such as embedded sensors and advanced control algorithms, is enabling real-time monitoring, predictive maintenance, and remote diagnostics, leading to significant operational cost savings and enhanced system reliability. These advancements are crucial in meeting the escalating demand for sustainable and intelligent solutions across all applications. Furthermore, there's a discernible market trend towards the development of smaller, lighter, and more power-dense motors, a critical requirement driven by the spatial and weight constraints of electric vehicles and other portable, energy-efficient devices.
Report Scope & Segmentation Analysis
This report segments the electric motor market based on motor type (AC, DC), voltage (Less than 1 kV, Between 1 kV-6 kV, Higher than 6 kV), and application (Residential, Commercial, Automotive, Industrial). Each segment is analyzed in detail, providing market size, growth projections, and competitive dynamics. For instance, the AC motor segment is projected to grow at a CAGR of xx% during the forecast period, driven by its dominance in industrial applications. The automotive segment is expected to experience the fastest growth due to the increasing adoption of electric vehicles.
Key Drivers of Electric Motor Industry Growth
The growth of the electric motor industry is primarily driven by the increasing demand for energy-efficient solutions, the rising adoption of electric vehicles, and the growing automation in industrial processes. Government regulations promoting energy conservation are also fueling market growth. Furthermore, technological advancements in motor design and control systems are enhancing efficiency and performance, boosting market demand.
Challenges in the Electric Motor Industry Sector
Challenges include the volatility of raw material prices, supply chain disruptions, and intense competition among manufacturers. Regulatory compliance requirements, varying across different regions, pose another significant challenge. These factors can impact production costs and profitability, requiring manufacturers to adopt efficient strategies for sourcing, production, and distribution.
Emerging Opportunities in Electric Motor Industry
Emerging opportunities include the growing demand for electric motors in renewable energy applications (wind turbines, solar power systems), the rise of smart motors with integrated sensors and controls, and the expansion of the electric vehicle market in developing economies. These trends present significant growth potential for manufacturers who can adapt to evolving technological advancements and market demands.
Leading Players in the Electric Motor Industry Market
- Rockwell Automation
- ABB Ltd
- AMETEK Inc
- TECO-Westinghouse Motor Company
- Weg SA
- Toshiba Corp
- Nidec Corporation
- Johnson Electric Holdings Limited
- Siemens AG
- Hitachi Ltd
- Robert Bosch GmbH
- Regal Rexnord Corporation
Key Developments in Electric Motor Industry
- November 2022: Nidec Corporation announced a significant investment of USD 715 Million in Mexico to establish a new manufacturing facility dedicated to producing electric motors and e-axle drives for the rapidly expanding electric vehicle market. This expansion is slated to achieve an impressive annual production capacity of 1 Million units.
- February 2023: Flash, a prominent electronic component manufacturer, forged a strategic partnership with Slovenia-based GEM motors. This collaboration aims to accelerate the development and production of a comprehensive range of electric motors, spanning from 1 kW to 15 kW, for various electric vehicle segments, addressing diverse performance requirements.
Future Outlook for Electric Motor Industry Market
The electric motor industry is strategically positioned for sustained and robust growth in the foreseeable future. This optimistic outlook is underpinned by several converging trends: the relentless expansion of the global electric vehicle market, the ongoing surge in industrial automation adoption driven by efficiency and productivity gains, and the accelerating integration of renewable energy technologies that often rely on electric motors for conversion and distribution. To navigate and capitalize on this dynamic market, companies will need to prioritize strategic investments in cutting-edge R&D, foster collaborative strategic partnerships, and actively pursue mergers and acquisitions to enhance their technological capabilities and market reach. The overarching global imperative for sustainability and enhanced energy efficiency will continue to serve as the primary driver for product innovation, shaping consumer demand and influencing regulatory frameworks within the industry.
Electric Motor Industry Segmentation
-
1. Motor Type
- 1.1. AC
- 1.2. DC
-
2. Voltage
- 2.1. Less than 1 kV
- 2.2. Between 1kV-6kV
- 2.3. Higher than 6 kV
-
3. Application
- 3.1. Residential
- 3.2. Commercial
- 3.3. Automotive
- 3.4. Industrial
Electric Motor Industry Segmentation By Geography
-
1. North America
- 1.1. United States
- 1.2. Canada
- 1.3. Rest of North America
-
2. Europe
- 2.1. Germany
- 2.2. France
- 2.3. United Kingdom
- 2.4. Rest of Europe
-
3. Asia Pacific
- 3.1. China
- 3.2. India
- 3.3. Japan
- 3.4. South Korea
- 3.5. Rest of Asia Pacific
-
4. South America
- 4.1. Brazil
- 4.2. Argentina
- 4.3. Rest of South America
-
5. Middle East and Africa
- 5.1. Saudi Arabia
- 5.2. United Arab Emirates
- 5.3. South Africa
- 5.4. Rest of Middle East and Africa
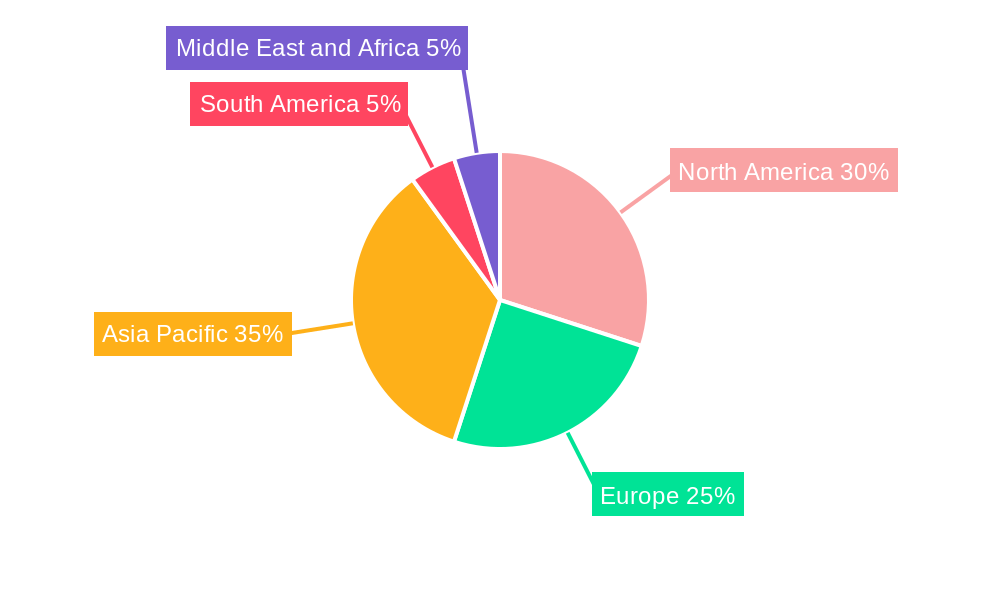
Electric Motor Industry Regional Market Share
Geographic Coverage of Electric Motor Industry
Electric Motor Industry REPORT HIGHLIGHTS
| Aspects | Details |
|---|---|
| Study Period | 2020-2034 |
| Base Year | 2025 |
| Estimated Year | 2026 |
| Forecast Period | 2026-2034 |
| Historical Period | 2020-2025 |
| Growth Rate | CAGR of 6.97% from 2020-2034 |
| Segmentation |
|
Table of Contents
- 1. Introduction
- 1.1. Research Scope
- 1.2. Market Segmentation
- 1.3. Research Objective
- 1.4. Definitions and Assumptions
- 2. Executive Summary
- 2.1. Market Snapshot
- 3. Market Dynamics
- 3.1. Market Drivers
- 3.2. Market Restrains
- 3.3. Market Trends
- 3.4. Market Opportunities
- 4. Market Factor Analysis
- 4.1. Porters Five Forces
- 4.1.1. Bargaining Power of Suppliers
- 4.1.2. Bargaining Power of Buyers
- 4.1.3. Threat of New Entrants
- 4.1.4. Threat of Substitutes
- 4.1.5. Competitive Rivalry
- 4.2. PESTEL analysis
- 4.3. BCG Analysis
- 4.3.1. Stars (High Growth, High Market Share)
- 4.3.2. Cash Cows (Low Growth, High Market Share)
- 4.3.3. Question Mark (High Growth, Low Market Share)
- 4.3.4. Dogs (Low Growth, Low Market Share)
- 4.4. Ansoff Matrix Analysis
- 4.5. Supply Chain Analysis
- 4.6. Regulatory Landscape
- 4.7. Current Market Potential and Opportunity Assessment (TAM–SAM–SOM Framework)
- 4.8. PRI Analyst Note
- 4.1. Porters Five Forces
- 5. Market Analysis, Insights and Forecast 2021-2033
- 5.1. Market Analysis, Insights and Forecast - by Motor Type
- 5.1.1. AC
- 5.1.2. DC
- 5.2. Market Analysis, Insights and Forecast - by Voltage
- 5.2.1. Less than 1 kV
- 5.2.2. Between 1kV-6kV
- 5.2.3. Higher than 6 kV
- 5.3. Market Analysis, Insights and Forecast - by Application
- 5.3.1. Residential
- 5.3.2. Commercial
- 5.3.3. Automotive
- 5.3.4. Industrial
- 5.4. Market Analysis, Insights and Forecast - by Region
- 5.4.1. North America
- 5.4.2. Europe
- 5.4.3. Asia Pacific
- 5.4.4. South America
- 5.4.5. Middle East and Africa
- 5.1. Market Analysis, Insights and Forecast - by Motor Type
- 6. Global Electric Motor Industry Analysis, Insights and Forecast, 2021-2033
- 6.1. Market Analysis, Insights and Forecast - by Motor Type
- 6.1.1. AC
- 6.1.2. DC
- 6.2. Market Analysis, Insights and Forecast - by Voltage
- 6.2.1. Less than 1 kV
- 6.2.2. Between 1kV-6kV
- 6.2.3. Higher than 6 kV
- 6.3. Market Analysis, Insights and Forecast - by Application
- 6.3.1. Residential
- 6.3.2. Commercial
- 6.3.3. Automotive
- 6.3.4. Industrial
- 6.1. Market Analysis, Insights and Forecast - by Motor Type
- 7. North America Electric Motor Industry Analysis, Insights and Forecast, 2020-2032
- 7.1. Market Analysis, Insights and Forecast - by Motor Type
- 7.1.1. AC
- 7.1.2. DC
- 7.2. Market Analysis, Insights and Forecast - by Voltage
- 7.2.1. Less than 1 kV
- 7.2.2. Between 1kV-6kV
- 7.2.3. Higher than 6 kV
- 7.3. Market Analysis, Insights and Forecast - by Application
- 7.3.1. Residential
- 7.3.2. Commercial
- 7.3.3. Automotive
- 7.3.4. Industrial
- 7.1. Market Analysis, Insights and Forecast - by Motor Type
- 8. Europe Electric Motor Industry Analysis, Insights and Forecast, 2020-2032
- 8.1. Market Analysis, Insights and Forecast - by Motor Type
- 8.1.1. AC
- 8.1.2. DC
- 8.2. Market Analysis, Insights and Forecast - by Voltage
- 8.2.1. Less than 1 kV
- 8.2.2. Between 1kV-6kV
- 8.2.3. Higher than 6 kV
- 8.3. Market Analysis, Insights and Forecast - by Application
- 8.3.1. Residential
- 8.3.2. Commercial
- 8.3.3. Automotive
- 8.3.4. Industrial
- 8.1. Market Analysis, Insights and Forecast - by Motor Type
- 9. Asia Pacific Electric Motor Industry Analysis, Insights and Forecast, 2020-2032
- 9.1. Market Analysis, Insights and Forecast - by Motor Type
- 9.1.1. AC
- 9.1.2. DC
- 9.2. Market Analysis, Insights and Forecast - by Voltage
- 9.2.1. Less than 1 kV
- 9.2.2. Between 1kV-6kV
- 9.2.3. Higher than 6 kV
- 9.3. Market Analysis, Insights and Forecast - by Application
- 9.3.1. Residential
- 9.3.2. Commercial
- 9.3.3. Automotive
- 9.3.4. Industrial
- 9.1. Market Analysis, Insights and Forecast - by Motor Type
- 10. South America Electric Motor Industry Analysis, Insights and Forecast, 2020-2032
- 10.1. Market Analysis, Insights and Forecast - by Motor Type
- 10.1.1. AC
- 10.1.2. DC
- 10.2. Market Analysis, Insights and Forecast - by Voltage
- 10.2.1. Less than 1 kV
- 10.2.2. Between 1kV-6kV
- 10.2.3. Higher than 6 kV
- 10.3. Market Analysis, Insights and Forecast - by Application
- 10.3.1. Residential
- 10.3.2. Commercial
- 10.3.3. Automotive
- 10.3.4. Industrial
- 10.1. Market Analysis, Insights and Forecast - by Motor Type
- 11. Middle East and Africa Electric Motor Industry Analysis, Insights and Forecast, 2020-2032
- 11.1. Market Analysis, Insights and Forecast - by Motor Type
- 11.1.1. AC
- 11.1.2. DC
- 11.2. Market Analysis, Insights and Forecast - by Voltage
- 11.2.1. Less than 1 kV
- 11.2.2. Between 1kV-6kV
- 11.2.3. Higher than 6 kV
- 11.3. Market Analysis, Insights and Forecast - by Application
- 11.3.1. Residential
- 11.3.2. Commercial
- 11.3.3. Automotive
- 11.3.4. Industrial
- 11.1. Market Analysis, Insights and Forecast - by Motor Type
- 12. Competitive Analysis
- 12.1. Company Profiles
- 12.1.1 Rockwell Automation
- 12.1.1.1. Company Overview
- 12.1.1.2. Products
- 12.1.1.3. Company Financials
- 12.1.1.4. SWOT Analysis
- 12.1.2 ABB Ltd
- 12.1.2.1. Company Overview
- 12.1.2.2. Products
- 12.1.2.3. Company Financials
- 12.1.2.4. SWOT Analysis
- 12.1.3 AMETEK Inc
- 12.1.3.1. Company Overview
- 12.1.3.2. Products
- 12.1.3.3. Company Financials
- 12.1.3.4. SWOT Analysis
- 12.1.4 TECO-Westinghouse Motor Company
- 12.1.4.1. Company Overview
- 12.1.4.2. Products
- 12.1.4.3. Company Financials
- 12.1.4.4. SWOT Analysis
- 12.1.5 Weg SA
- 12.1.5.1. Company Overview
- 12.1.5.2. Products
- 12.1.5.3. Company Financials
- 12.1.5.4. SWOT Analysis
- 12.1.6 Toshiba Corp
- 12.1.6.1. Company Overview
- 12.1.6.2. Products
- 12.1.6.3. Company Financials
- 12.1.6.4. SWOT Analysis
- 12.1.7 Nidec Corporation
- 12.1.7.1. Company Overview
- 12.1.7.2. Products
- 12.1.7.3. Company Financials
- 12.1.7.4. SWOT Analysis
- 12.1.8 Johnson Electric Holdings Limited
- 12.1.8.1. Company Overview
- 12.1.8.2. Products
- 12.1.8.3. Company Financials
- 12.1.8.4. SWOT Analysis
- 12.1.9 Siemens AG
- 12.1.9.1. Company Overview
- 12.1.9.2. Products
- 12.1.9.3. Company Financials
- 12.1.9.4. SWOT Analysis
- 12.1.10 Hitachi Ltd
- 12.1.10.1. Company Overview
- 12.1.10.2. Products
- 12.1.10.3. Company Financials
- 12.1.10.4. SWOT Analysis
- 12.1.11 Robert Bosch GmbH
- 12.1.11.1. Company Overview
- 12.1.11.2. Products
- 12.1.11.3. Company Financials
- 12.1.11.4. SWOT Analysis
- 12.1.12 Regal Rexnord Corporation
- 12.1.12.1. Company Overview
- 12.1.12.2. Products
- 12.1.12.3. Company Financials
- 12.1.12.4. SWOT Analysis
- 12.1.1 Rockwell Automation
- 12.2. Market Entropy
- 12.2.1 Company's Key Areas Served
- 12.2.2 Recent Developments
- 12.3. Company Market Share Analysis 2025
- 12.3.1 Top 5 Companies Market Share Analysis
- 12.3.2 Top 3 Companies Market Share Analysis
- 12.4. List of Potential Customers
- 13. Research Methodology
List of Figures
- Figure 1: Global Electric Motor Industry Revenue Breakdown (Million, %) by Region 2025 & 2033
- Figure 2: North America Electric Motor Industry Revenue (Million), by Motor Type 2025 & 2033
- Figure 3: North America Electric Motor Industry Revenue Share (%), by Motor Type 2025 & 2033
- Figure 4: North America Electric Motor Industry Revenue (Million), by Voltage 2025 & 2033
- Figure 5: North America Electric Motor Industry Revenue Share (%), by Voltage 2025 & 2033
- Figure 6: North America Electric Motor Industry Revenue (Million), by Application 2025 & 2033
- Figure 7: North America Electric Motor Industry Revenue Share (%), by Application 2025 & 2033
- Figure 8: North America Electric Motor Industry Revenue (Million), by Country 2025 & 2033
- Figure 9: North America Electric Motor Industry Revenue Share (%), by Country 2025 & 2033
- Figure 10: Europe Electric Motor Industry Revenue (Million), by Motor Type 2025 & 2033
- Figure 11: Europe Electric Motor Industry Revenue Share (%), by Motor Type 2025 & 2033
- Figure 12: Europe Electric Motor Industry Revenue (Million), by Voltage 2025 & 2033
- Figure 13: Europe Electric Motor Industry Revenue Share (%), by Voltage 2025 & 2033
- Figure 14: Europe Electric Motor Industry Revenue (Million), by Application 2025 & 2033
- Figure 15: Europe Electric Motor Industry Revenue Share (%), by Application 2025 & 2033
- Figure 16: Europe Electric Motor Industry Revenue (Million), by Country 2025 & 2033
- Figure 17: Europe Electric Motor Industry Revenue Share (%), by Country 2025 & 2033
- Figure 18: Asia Pacific Electric Motor Industry Revenue (Million), by Motor Type 2025 & 2033
- Figure 19: Asia Pacific Electric Motor Industry Revenue Share (%), by Motor Type 2025 & 2033
- Figure 20: Asia Pacific Electric Motor Industry Revenue (Million), by Voltage 2025 & 2033
- Figure 21: Asia Pacific Electric Motor Industry Revenue Share (%), by Voltage 2025 & 2033
- Figure 22: Asia Pacific Electric Motor Industry Revenue (Million), by Application 2025 & 2033
- Figure 23: Asia Pacific Electric Motor Industry Revenue Share (%), by Application 2025 & 2033
- Figure 24: Asia Pacific Electric Motor Industry Revenue (Million), by Country 2025 & 2033
- Figure 25: Asia Pacific Electric Motor Industry Revenue Share (%), by Country 2025 & 2033
- Figure 26: South America Electric Motor Industry Revenue (Million), by Motor Type 2025 & 2033
- Figure 27: South America Electric Motor Industry Revenue Share (%), by Motor Type 2025 & 2033
- Figure 28: South America Electric Motor Industry Revenue (Million), by Voltage 2025 & 2033
- Figure 29: South America Electric Motor Industry Revenue Share (%), by Voltage 2025 & 2033
- Figure 30: South America Electric Motor Industry Revenue (Million), by Application 2025 & 2033
- Figure 31: South America Electric Motor Industry Revenue Share (%), by Application 2025 & 2033
- Figure 32: South America Electric Motor Industry Revenue (Million), by Country 2025 & 2033
- Figure 33: South America Electric Motor Industry Revenue Share (%), by Country 2025 & 2033
- Figure 34: Middle East and Africa Electric Motor Industry Revenue (Million), by Motor Type 2025 & 2033
- Figure 35: Middle East and Africa Electric Motor Industry Revenue Share (%), by Motor Type 2025 & 2033
- Figure 36: Middle East and Africa Electric Motor Industry Revenue (Million), by Voltage 2025 & 2033
- Figure 37: Middle East and Africa Electric Motor Industry Revenue Share (%), by Voltage 2025 & 2033
- Figure 38: Middle East and Africa Electric Motor Industry Revenue (Million), by Application 2025 & 2033
- Figure 39: Middle East and Africa Electric Motor Industry Revenue Share (%), by Application 2025 & 2033
- Figure 40: Middle East and Africa Electric Motor Industry Revenue (Million), by Country 2025 & 2033
- Figure 41: Middle East and Africa Electric Motor Industry Revenue Share (%), by Country 2025 & 2033
List of Tables
- Table 1: Global Electric Motor Industry Revenue Million Forecast, by Motor Type 2020 & 2033
- Table 2: Global Electric Motor Industry Revenue Million Forecast, by Voltage 2020 & 2033
- Table 3: Global Electric Motor Industry Revenue Million Forecast, by Application 2020 & 2033
- Table 4: Global Electric Motor Industry Revenue Million Forecast, by Region 2020 & 2033
- Table 5: Global Electric Motor Industry Revenue Million Forecast, by Motor Type 2020 & 2033
- Table 6: Global Electric Motor Industry Revenue Million Forecast, by Voltage 2020 & 2033
- Table 7: Global Electric Motor Industry Revenue Million Forecast, by Application 2020 & 2033
- Table 8: Global Electric Motor Industry Revenue Million Forecast, by Country 2020 & 2033
- Table 9: United States Electric Motor Industry Revenue (Million) Forecast, by Application 2020 & 2033
- Table 10: Canada Electric Motor Industry Revenue (Million) Forecast, by Application 2020 & 2033
- Table 11: Rest of North America Electric Motor Industry Revenue (Million) Forecast, by Application 2020 & 2033
- Table 12: Global Electric Motor Industry Revenue Million Forecast, by Motor Type 2020 & 2033
- Table 13: Global Electric Motor Industry Revenue Million Forecast, by Voltage 2020 & 2033
- Table 14: Global Electric Motor Industry Revenue Million Forecast, by Application 2020 & 2033
- Table 15: Global Electric Motor Industry Revenue Million Forecast, by Country 2020 & 2033
- Table 16: Germany Electric Motor Industry Revenue (Million) Forecast, by Application 2020 & 2033
- Table 17: France Electric Motor Industry Revenue (Million) Forecast, by Application 2020 & 2033
- Table 18: United Kingdom Electric Motor Industry Revenue (Million) Forecast, by Application 2020 & 2033
- Table 19: Rest of Europe Electric Motor Industry Revenue (Million) Forecast, by Application 2020 & 2033
- Table 20: Global Electric Motor Industry Revenue Million Forecast, by Motor Type 2020 & 2033
- Table 21: Global Electric Motor Industry Revenue Million Forecast, by Voltage 2020 & 2033
- Table 22: Global Electric Motor Industry Revenue Million Forecast, by Application 2020 & 2033
- Table 23: Global Electric Motor Industry Revenue Million Forecast, by Country 2020 & 2033
- Table 24: China Electric Motor Industry Revenue (Million) Forecast, by Application 2020 & 2033
- Table 25: India Electric Motor Industry Revenue (Million) Forecast, by Application 2020 & 2033
- Table 26: Japan Electric Motor Industry Revenue (Million) Forecast, by Application 2020 & 2033
- Table 27: South Korea Electric Motor Industry Revenue (Million) Forecast, by Application 2020 & 2033
- Table 28: Rest of Asia Pacific Electric Motor Industry Revenue (Million) Forecast, by Application 2020 & 2033
- Table 29: Global Electric Motor Industry Revenue Million Forecast, by Motor Type 2020 & 2033
- Table 30: Global Electric Motor Industry Revenue Million Forecast, by Voltage 2020 & 2033
- Table 31: Global Electric Motor Industry Revenue Million Forecast, by Application 2020 & 2033
- Table 32: Global Electric Motor Industry Revenue Million Forecast, by Country 2020 & 2033
- Table 33: Brazil Electric Motor Industry Revenue (Million) Forecast, by Application 2020 & 2033
- Table 34: Argentina Electric Motor Industry Revenue (Million) Forecast, by Application 2020 & 2033
- Table 35: Rest of South America Electric Motor Industry Revenue (Million) Forecast, by Application 2020 & 2033
- Table 36: Global Electric Motor Industry Revenue Million Forecast, by Motor Type 2020 & 2033
- Table 37: Global Electric Motor Industry Revenue Million Forecast, by Voltage 2020 & 2033
- Table 38: Global Electric Motor Industry Revenue Million Forecast, by Application 2020 & 2033
- Table 39: Global Electric Motor Industry Revenue Million Forecast, by Country 2020 & 2033
- Table 40: Saudi Arabia Electric Motor Industry Revenue (Million) Forecast, by Application 2020 & 2033
- Table 41: United Arab Emirates Electric Motor Industry Revenue (Million) Forecast, by Application 2020 & 2033
- Table 42: South Africa Electric Motor Industry Revenue (Million) Forecast, by Application 2020 & 2033
- Table 43: Rest of Middle East and Africa Electric Motor Industry Revenue (Million) Forecast, by Application 2020 & 2033
Frequently Asked Questions
1. What is the projected Compound Annual Growth Rate (CAGR) of the Electric Motor Industry?
The projected CAGR is approximately 6.97%.
2. Which companies are prominent players in the Electric Motor Industry?
Key companies in the market include Rockwell Automation, ABB Ltd, AMETEK Inc, TECO-Westinghouse Motor Company, Weg SA, Toshiba Corp, Nidec Corporation, Johnson Electric Holdings Limited, Siemens AG, Hitachi Ltd, Robert Bosch GmbH, Regal Rexnord Corporation.
3. What are the main segments of the Electric Motor Industry?
The market segments include Motor Type, Voltage, Application.
4. Can you provide details about the market size?
The market size is estimated to be USD 136.95 Million as of 2022.
5. What are some drivers contributing to market growth?
4Increasing Residential Usage of the Electric Motor. Rising Adoption of Electric Vehicles.
6. What are the notable trends driving market growth?
Automotive Segment to Witness Growth.
7. Are there any restraints impacting market growth?
Fluctuating Prices of Raw Materials.
8. Can you provide examples of recent developments in the market?
February 2023: Electronic component maker Flash announced a technical collaboration with Slovenia-based GEM motors to develop electric motors. Under the partnership, both brands will manufacture hub motors for various electric vehicle segments in the range of 1 kW to 15 kW.
9. What pricing options are available for accessing the report?
Pricing options include single-user, multi-user, and enterprise licenses priced at USD 4750, USD 5250, and USD 8750 respectively.
10. Is the market size provided in terms of value or volume?
The market size is provided in terms of value, measured in Million.
11. Are there any specific market keywords associated with the report?
Yes, the market keyword associated with the report is "Electric Motor Industry," which aids in identifying and referencing the specific market segment covered.
12. How do I determine which pricing option suits my needs best?
The pricing options vary based on user requirements and access needs. Individual users may opt for single-user licenses, while businesses requiring broader access may choose multi-user or enterprise licenses for cost-effective access to the report.
13. Are there any additional resources or data provided in the Electric Motor Industry report?
While the report offers comprehensive insights, it's advisable to review the specific contents or supplementary materials provided to ascertain if additional resources or data are available.
14. How can I stay updated on further developments or reports in the Electric Motor Industry?
To stay informed about further developments, trends, and reports in the Electric Motor Industry, consider subscribing to industry newsletters, following relevant companies and organizations, or regularly checking reputable industry news sources and publications.
Methodology
Step 1 - Identification of Relevant Samples Size from Population Database


Step 2 - Approaches for Defining Global Market Size (Value, Volume* & Price*)

Note*: In applicable scenarios
Step 3 - Data Sources
Primary Research
- Web Analytics
- Survey Reports
- Research Institute
- Latest Research Reports
- Opinion Leaders
Secondary Research
- Annual Reports
- White Paper
- Latest Press Release
- Industry Association
- Paid Database
- Investor Presentations

Step 4 - Data Triangulation
Involves using different sources of information in order to increase the validity of a study
These sources are likely to be stakeholders in a program - participants, other researchers, program staff, other community members, and so on.
Then we put all data in single framework & apply various statistical tools to find out the dynamic on the market.
During the analysis stage, feedback from the stakeholder groups would be compared to determine areas of agreement as well as areas of divergence